. 2024 Dec 13:15:1506034.
doi: 10.3389/fimmu.2024.1506034. eCollection 2024.

Functional MRGPRX2 expression on peripheral blood-derived human mast cells increases at low seeding density and is suppressed by interleukin-9 and fetal bovine serum

Affiliations

Functional MRGPRX2 expression on peripheral blood-derived human mast cells increases at low seeding density and is suppressed by interleukin-9 and fetal bovine serum

Toon Ieven et al. Front Immunol. .

Abstract

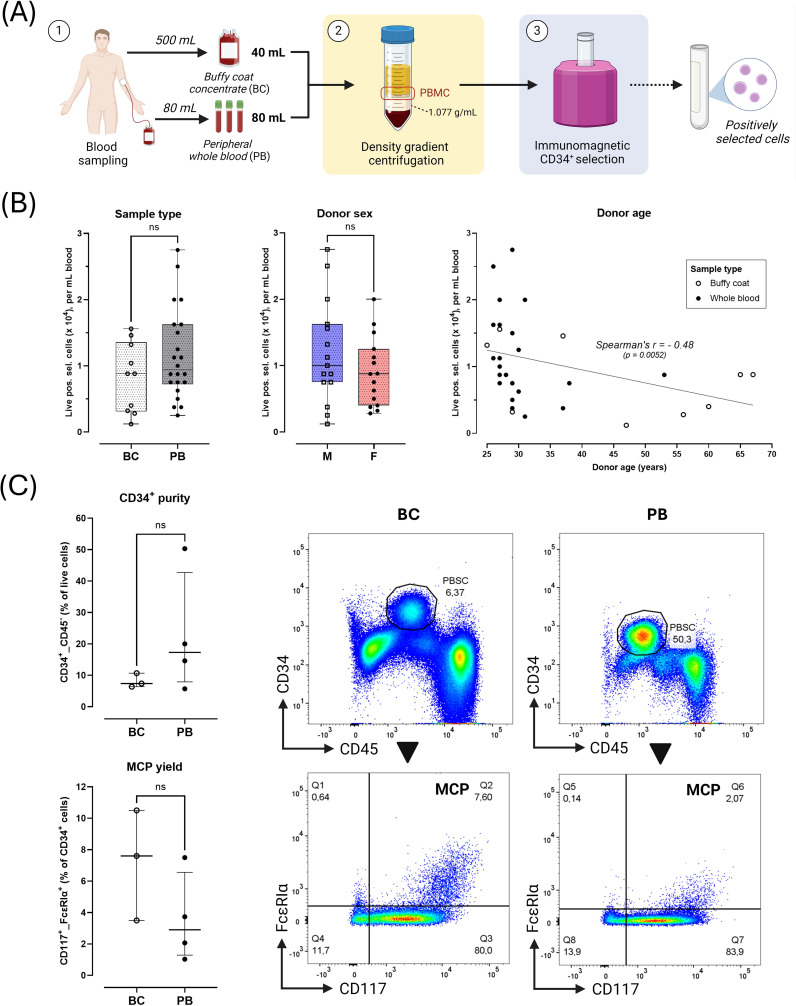
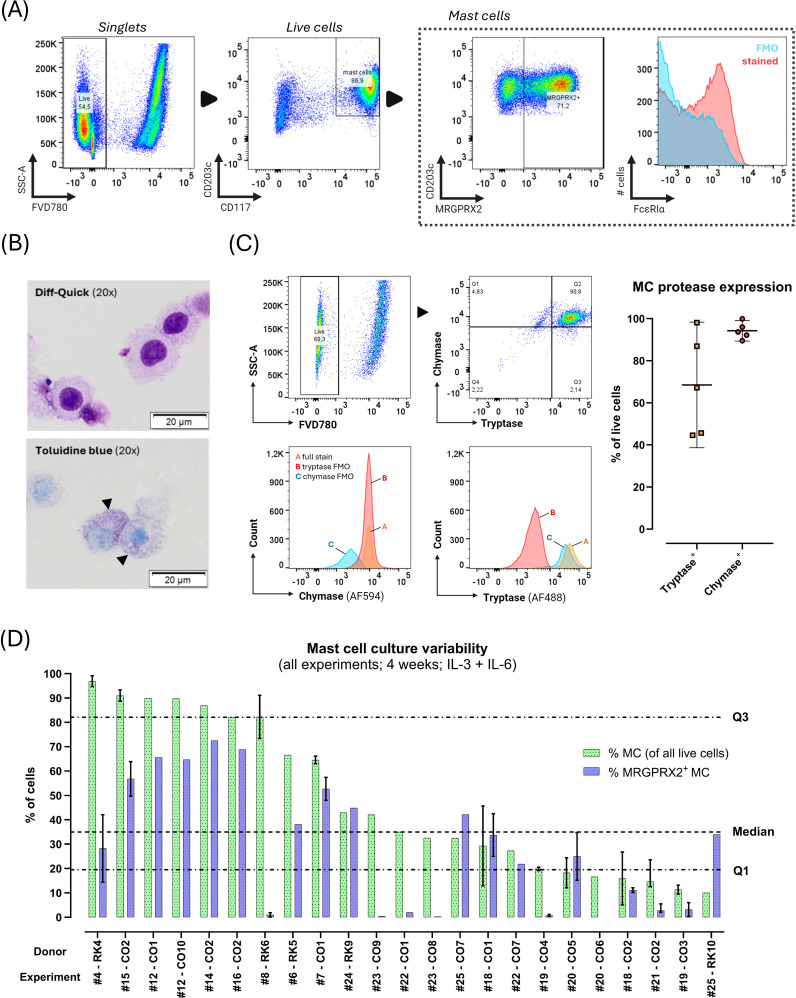
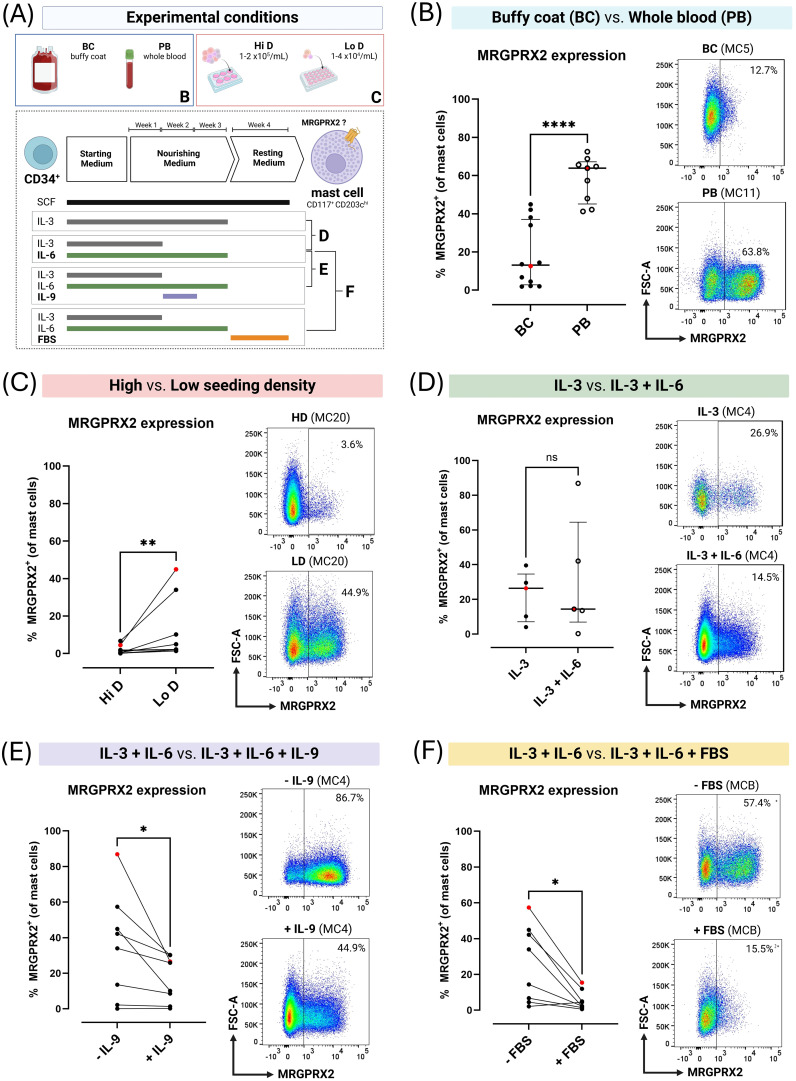
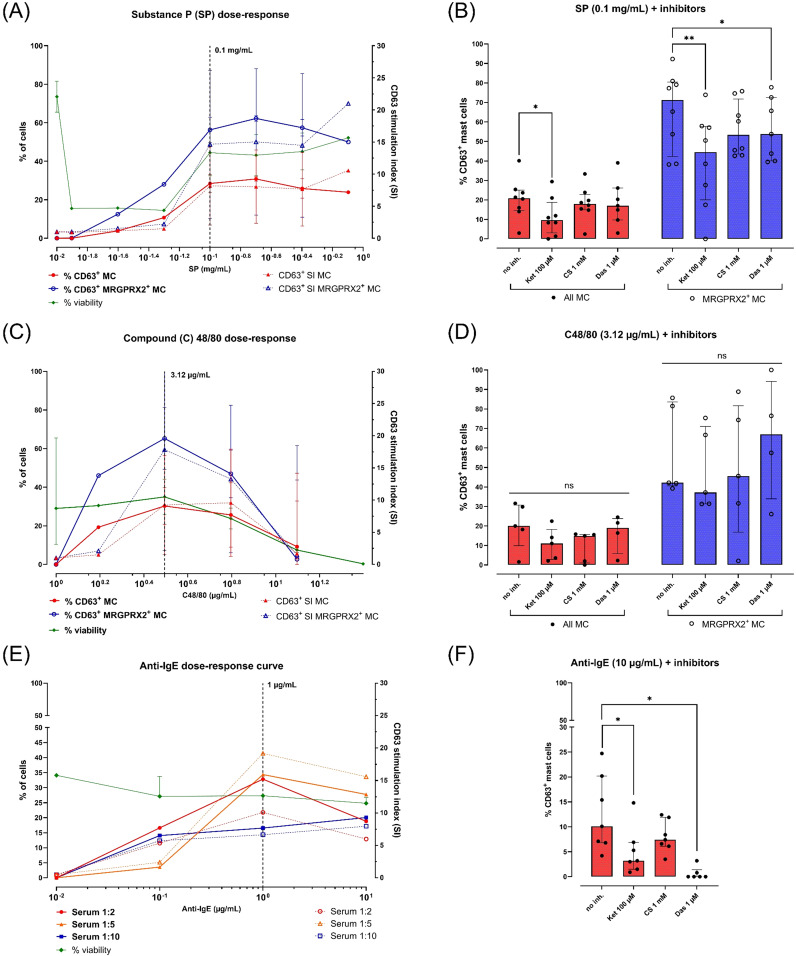
Primary human mast cells (MC) obtained through culturing of blood-derived MC progenitors are the preferred model for the ex vivo study of MRGPRX2- vs. IgE-mediated MC activation. In order to assess the impact of culture conditions on functional MRGPRX2 expression, we cultured CD34+-enriched PBMC from peripheral whole blood (PB) and buffy coat (BC) samples in MethoCult medium containing stem cell factor (SCF) and interleukin (IL)-3, modified through variations in seeding density and adding or withholding IL-6, IL-9 and fetal bovine serum (FBS). Functional expression of MRGPRX2 was assessed after 4 weeks via flow cytometry. We found similar proportions of CD34+ MC-committed progenitors in BC and PB. Higher seeding densities (≥ 1x10⁵ cells/mL) and exposure to IL-9 and FBS suppressed functional MRGPRX2 expression at 4 weeks, while leaving MC yield largely unaffected. IL-6 had no impact on MRGPRX2 expression. MRGPRX2-expressing MC upregulated CD63 upon stimulation with polyclonal anti-IgE, substance P and compound 48/80 at 4 weeks. Ketotifen and dasatinib but not cromolyn sodium inhibited both IgE- and MRGPRX2-dependent pathways. Our results confirm the feasibility of functional MC activation studies on PB-derived MC after a short 4-week culture and highlight the impact of culture conditions on functional MRGPRX2 expression.

Keywords: MRGPRX2; blood; culture; human; interleukin-9; ketotifen; mast cell; serum.


Conflict of interest statement

The authors declare that the research was conducted in the absence of any commercial or financial relationships that could be construed as a potential conflict of interest.

Figures

Figure 1
Figure 1
Starting sample characteristics. (A) Overview of sampling and processing. 1) Buffy coat concentrates (BC, 40 mL) were acquired as rest products after blood donation through centrifugation of 500 mL peripheral whole blood. Peripheral whole blood (PB, 80 mL) was directly drawn in vacuum tubes on lithium-heparin anticoagulant. 2) Peripheral blood mononuclear cells (PBMC) were collected from the interphase after density gradient centrifugation. 3) PBMC were enriched for circulating peripheral blood CD34+ stem cells (PBSC) through positive immunomagnetic selection. The positively selected cell fraction was analyzed via flow cytometry or seeded into cultures. (B) Yield of positively selected cells normalized per mL initial donor blood volume according to sample type (BC [n=10] vs. PB [n=22]), donor sex (male, M [n=15] vs. female, F [n=15]) and donor age (with linear regression line). (C) Flow cytometric characterization of PBMC fractions obtained after step 3 (BC [n=3]), PB [n=4] samples). Black arrows indicate directionality of flow cytometric gating. Quadrant gating was applied based on FMOs. Results shown as median ± IQR. Plots show representative gating of CD34+ PBMC (top panels) and CD34+_CD117hi_FcϵRIαhi mast cell-committed progenitors (MCP, Q2 gate) for one PB donor (CO1) and one BC donor (RK9). Horizontal error bars indicate Mann-Whitney U unpaired comparisons between groups (ns = not significant, p > 0,05).
Figure 2
Figure 2
Phenotype of blood-derived primary human mast cells (MC) after 4 weeks culture with stem cell factor, IL-6 and IL-3 (first week only). (A) MC immunophenotype assessed with flow cytometry (donor CO2 shown). Black arrows indicate directionality of gating. First, live (FVD780-) cells were selected within singlets, and CD117hi_CD203+ MC were selected within live cells; next, MRGPRX2+ cells were identified among live MC. Due to presence of autofluorescence in the FcϵRIα channel (see blue FMO population), the %FcϵRIα+ MC could not be reliably determined in the fully stained (red population) sample. (B) Light microscopy of cytospins stained with Diff-Quick™ (top) or toluidine blue (bottom). Toluidine blue staining reveals dark-purple metachromatic granules in the cytoplasm (black arrowheads) (donor CO2 shown). (C) Intracellular MC protease expression assessed through flow cytometry in live cells after 4 weeks of culture. Top row shows the flow cytometric gating strategy for intracellular proteases on a single representative donor sample (CO2). Quadrant gates (top right panel) were set on all live cultured cells (FVD780-) based on FMO’s (bottom panels). The plot on the right shows the median (± IQR) % of live tryptase+ and chymase+ cells after 4 weeks of culture (n=5 cultures). (D) Results of repeated culture experiments (n=23) from various donors (n=15) cultured under similar circumstances for 4 weeks with IL-3 (week 1 only) and IL-6 (continuously). Y-axis indicates %MC (CD117hi_CD203c+ as % of all live cells; green bars) and %MRGPRX2+ MC (as % of total MC; blue bars) obtained at the end of the culture, ordered from highest to lowest MC purity. X-axis indicates the donor and experiment number, respectively. For donors with multiple culture replicates under the same circumstances during the same culture run, results are shown as median with IQR (vertical error bars). Horizontal dotted lines indicate global median and IQR of %MC.
Figure 3
Figure 3
MRGPRX2 expression on blood-derived primary human mast cells (MC) cultured for 4 weeks in MethoCult under varying culture conditions. (A) Overview of experimental culture conditions. (B) Unpaired comparison between buffy coat concentrate (BC)-derived (n=12) and peripheral whole blood (PB)-derived (n=9) MC cultures. (C) Paired comparison between BC-derived MC cultures (n=7) seeded at high density (Hi D; 1-2x10⁵ cells/mL) or low density (Lo D; 1-4x10⁴ cells/mL). (D) Unpaired comparison between MC cultured in continuous presence of interleukin (IL)-3 or IL-3 during week 1 and IL-6 continuously (n=5). (E) Paired comparison between MC cultured in IL-3 and IL-6 or IL-3 and IL-6 with addition of IL-9 during week 2 (n=8). (F) Paired comparison between MC cultured with or without fetal bovine serum (FBS) during week 4 (n=8). Each dot corresponds to a single donor (in single replicate). Red dots correspond to the flow cytometry plots shown. Error bars show median and interquartile ranges for unpaired data. For paired data, cultures obtained from the same donor during the same experiment are connected with lines. Horizontal lines indicate comparisons between groups using the Mann-Whitney U test for unpaired data and the Wilcoxon matched-pairs signed rank test for paired data. Pairwise comparisons were made between cultures derived from the same donor during the same culture run. ns = not significant (p > 0.05), * = p < 0.05, ** = p < 0.01, **** = p < 0.001.
Figure 4
Figure 4
Responses of peripheral blood-derived primary human mast cells (MC) to various stimuli and inhibitors. All MC were obtained after 4 weeks of culture in MethoCult with IL-3 (week 1) and IL-6 (continuous). MC activation is reported as % CD63+ live MC corrected for spontaneous activation (left y-axes, continuous lines) or as CD63 stimulation indices (SI; right y-axes, dotted lines). MC viability (% FVD780- cells) is indicated for each concentration of stimulus (left y-axes, continuous green line). Each dot represents a single donor (in single replicate). The number (n) of donors used is indicated between brackets. (A) CD63 dose-response curves after stimulation with substance P (SP) 0.0125 – 0.8 mg/mL (n=2, median + range), (B) MC activation by SP 0.1 mg/mL after preincubation with buffer or inhibitors (n=8, median + IQR). (C) CD63 dose-response curves after stimulation with compound 48/80 (C48/80) 1.56 – 100 µg/mL (n=3, median + range), (D) MC activation by C48/80 3.12 µg/mL after preincubation with buffer or inhibitors (n=5 donors, median + IQR), (E) CD63 dose-responses curve after overnight sensitization with human serum (1:10, blue squares; 1:5, orange triangles; 1:2, red circles) and stimulation with polyclonal goat anti-human IgE 0.1-10 µg/mL (n=1), (F) MC activation by anti-IgE 10 µg/mL after overnight passive sensitization in human serum 1:5 and preincubation with buffer or inhibitors (n=4, median + IQR). Horizontal bars indicate pairwise comparisons between groups using the Wilcoxon matched-pairs signed rank test. ns = not significant (p ≥ 0.05), * = p < 0.05, ** = p < 0.01.

Similar articles

References

    1. Galli SJ, Gaudenzio N, Tsai M. Mast cells in inflammation and disease: recent progress and ongoing concerns. Annu Rev Immunol. (2020) 38:49–77. doi: 10.1146/annurev-immunol-071719-094903 - DOI - PubMed
    1. Dwyer DF, Barrett NA, Austen KF. Immunological Genome Project Consortium. Expression profiling of constitutive mast cells reveals a unique identity within the immune system. Nat Immunol. (2016) 17:878–87. doi: 10.1038/ni.3445 - DOI - PMC - PubMed
    1. Gentek R, Ghigo C, Hoeffel G, Bulle MJ, Msallam R, Gautier G, et al. . Hemogenic endothelial fate mapping reveals dual developmental origin of mast cells. Immunity. (2018) 48:1160–1171.e5. doi: 10.1016/j.immuni.2018.04.025 - DOI - PubMed
    1. Dahlin JS, Maurer M, Metcalfe DD, Pejler G, Sagi-Eisenberg R, Nilsson G. The ingenious mast cell: Contemporary insights into mast cell behavior and function. Allergy. (2022) 77:83–99. doi: 10.1111/all.14881 - DOI - PubMed
    1. Krystel-Whittemore M, Dileepan KN, Wood JG. Mast cell: A multi-functional master cell. Front Immunol. (2016) 6:620. doi: 10.3389/fimmu.2015.00620 - DOI - PMC - PubMed

LinkOut - more resources