. 2024 Dec 16:12:1497652.
doi: 10.3389/fcell.2024.1497652. eCollection 2024.

Flow-cytometry reveals mitochondrial DNA accumulation in Saccharomyces cerevisiae cells during cell cycle arrest

Affiliations

Flow-cytometry reveals mitochondrial DNA accumulation in Saccharomyces cerevisiae cells during cell cycle arrest

Elena Yu Potapenko et al. Front Cell Dev Biol. .

Abstract

Mitochondria are semi-autonomous organelles containing their own DNA (mtDNA), which is replicated independently of nuclear DNA (nDNA). While cell cycle arrest halts nDNA replication, mtDNA replication continues. In Saccharomyces cerevisiae, flow cytometry enables semi-quantitative estimation of mtDNA levels by measuring the difference in signals between cells lacking mtDNA and those containing mtDNA. In this study, we used flow cytometry to investigate mtDNA accumulation in yeast cells under G1 and G2 phase cell cycle arrest conditions utilising thermosensitive mutants cdc4-3 and cdc15-2. In line with the previous studies, cell cycle arrest induced a several-fold accumulation of mtDNA in both mutants. The total DNA levels in arrested cells correlated with cell forward scattering, suggesting a relationship between individual cell mtDNA quantity and size. In cell cycle-arrested cells, we observed no correlation between cell size and intercellular mtDNA copy number variability. This implies that as cell size increases during arrest, the mtDNA content remains within a specific limited range for each size class. This observation suggests that mtDNA quantity control mechanisms can function in cell cycle-arrested cells.

Keywords: cell cycle arrest; cell cycle defect; mtDNA; mtDNA copy number; mtDNA copy number control; yeast.


Conflict of interest statement

The authors declare that the research was conducted in the absence of any commercial or financial relationships that could be construed as a potential conflict of interest.

Figures

FIGURE 1
FIGURE 1
Mitochondrial DNA contributes to the Propidium Iodide (A) and Sytox Green (B) signal in yeast cells. Dotted lines indicate the position of distribution modes for 1n and 2n peaks; (C) Higher intensity of Sytox Green signal in rho + cells compared to rho 0 cells cannot be explained by the larger cell size of rho + cells. FSC-A (forward scattering area) provided a semi-quantitative estimate for the cell size.
FIGURE 2
FIGURE 2
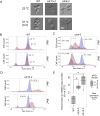
Accumulation of mtDNA during cell cycle arrest is indicated by the shift in the peaks of the Sytox Green fluorescence intensity distribution. Photograph of control cells and cell cycle arrested cells (A). Sytox Green intensity distribution of rho + and rho 0 wild type (B), cdc4-3 (C), and cdc15-2 (D) incubated for 6 hours at permissive (25°C) and non-permissive (37°C) temperatures. Sytox Green intensity a.u. is calculated in log2 scale. The positions of 1n and 2n peaks were determined in R using the multimode package (see Methods). The arrows indicate shift of the peak mode as average ±standard deviation (n = 3). (E) Increase in mtDNA copy numbers in wild type, cdc4-3 and cdc15-2 strains after 6 h of incubation at 37°C assessed using qPCR with two sets of primers (see Methods). The blue dotted lines show the average increase in mtDNA calculated using flow cytometry data. * P-Value is less than 0.025 according to Wilcoxon rank sum exact test.
FIGURE 3
FIGURE 3
The highest correlation between the Sytox Green signal and cell size (log2 of forward scattering area) is observed in cell cycle-arrested rho + cell suspensions. Correlations were calculated for 1n cells in the cdc4-3 strain (left panel) and 2n cells in the cdc15-2 strain (right panel).
FIGURE 4
FIGURE 4
Yeast cells remain homogeneous in mtDNA content despite the increase in size during cell cycle arrest. (A) Distributions of FSC-A values for cells of strain cdc15-2 before and after incubation at the non-permissive temperature. (B) Values of the variation coefficient calculated for arrested and non-arrested cells in different size bins (average values, n = 3). Dotted line shows population average without binning on cell size. (C) Schematic illustrating that the variation coefficient reflects the heterogeneity of cells in the Sytox Green signal, which in turn depends on the mtDNA copy number in the arrested cells.

Similar articles

Cited by

References

    1. Ameijeiras-Alonso J., Crujeiras R. M., Rodriguez-Casal A. (2021). Multimode: an R package for mode assessment. J. Stat. Softw. 97, 1–32. 10.18637/jss.v097.i09 - DOI
    1. Chan K.-M., Liu Y.-T., Ma C.-H., Jayaram M., Sau S. (2013). The 2 micron plasmid of Saccharomyces cerevisiae: a miniaturized selfish genome with optimized functional competence. Plasmid 70, 2–17. 10.1016/j.plasmid.2013.03.001 - DOI - PubMed
    1. Chatre L., Ricchetti M. (2013). Prevalent coordination of mitochondrial DNA transcription and initiation of replication with the cell cycle. Nucleic Acids Res. 41, 3068–3078. 10.1093/nar/gkt015 - DOI - PMC - PubMed
    1. Clay Montier L. L., Deng J. J., Bai Y. (2009). Number matters: control of mammalian mitochondrial DNA copy number. J. Genet. Genomics 36, 125–131. 10.1016/S1673-8527(08)60099-5 - DOI - PMC - PubMed
    1. Filograna R., Mennuni M., Alsina D., Larsson N.-G. (2021). Mitochondrial DNA copy number in human disease: the more the better? FEBS Lett. 595, 976–1002. 10.1002/1873-3468.14021 - DOI - PMC - PubMed

LinkOut - more resources