

Integrating dynamical modeling and phylogeographic inference to characterize global influenza circulation
- PMID: 39737444
- PMCID: PMC11683419
- DOI: 10.1093/pnasnexus/pgae561
Integrating dynamical modeling and phylogeographic inference to characterize global influenza circulation
Abstract
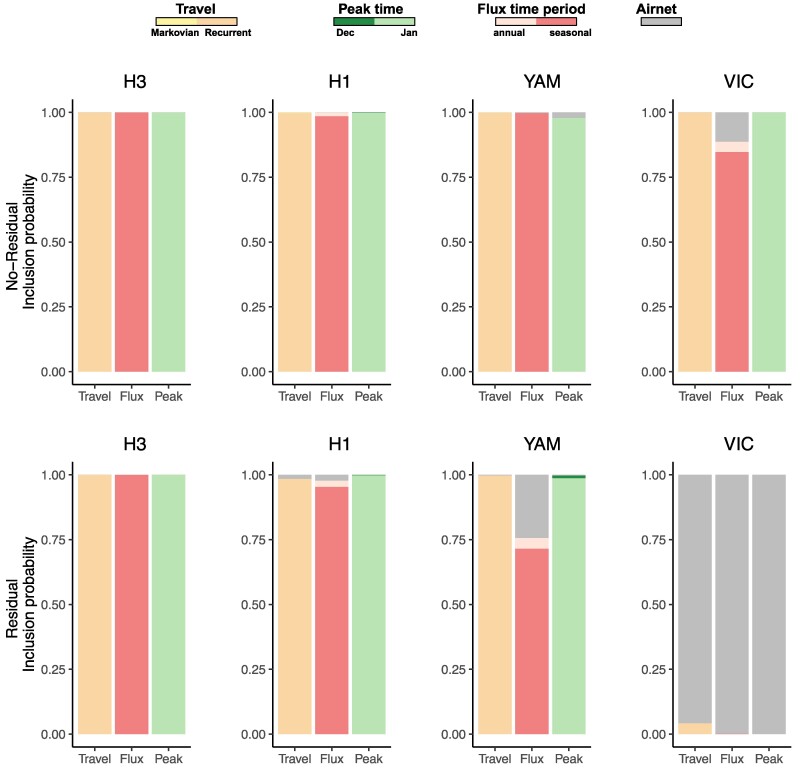
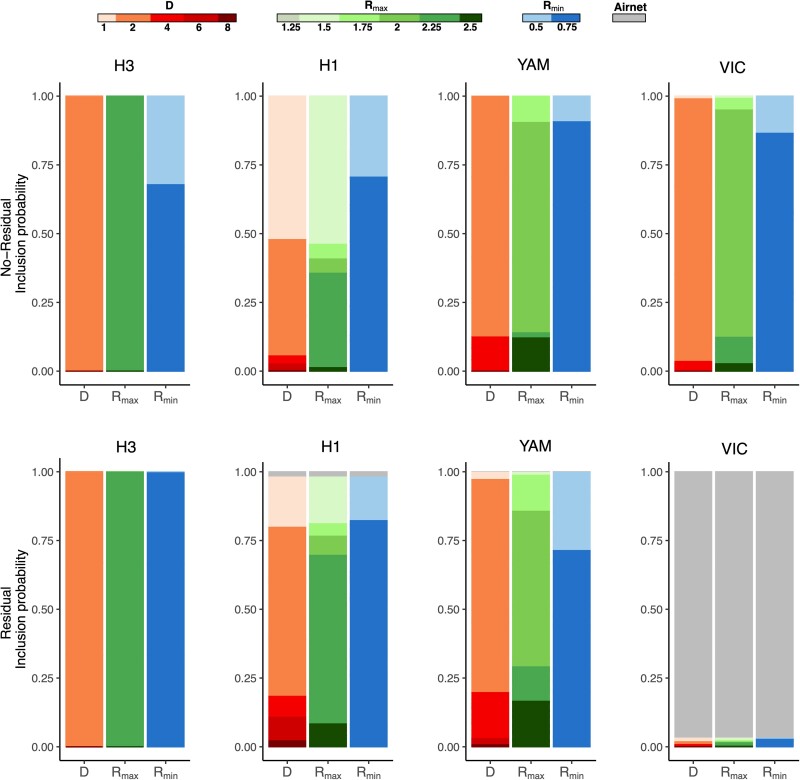
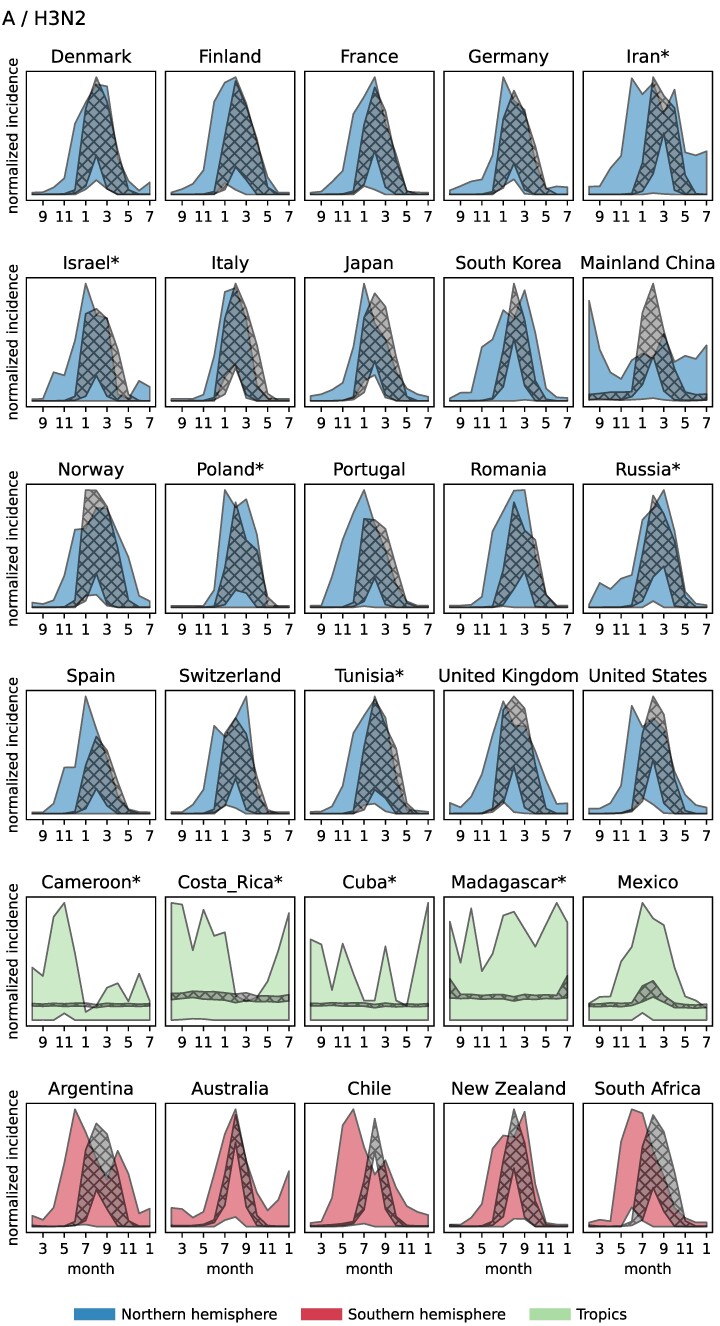
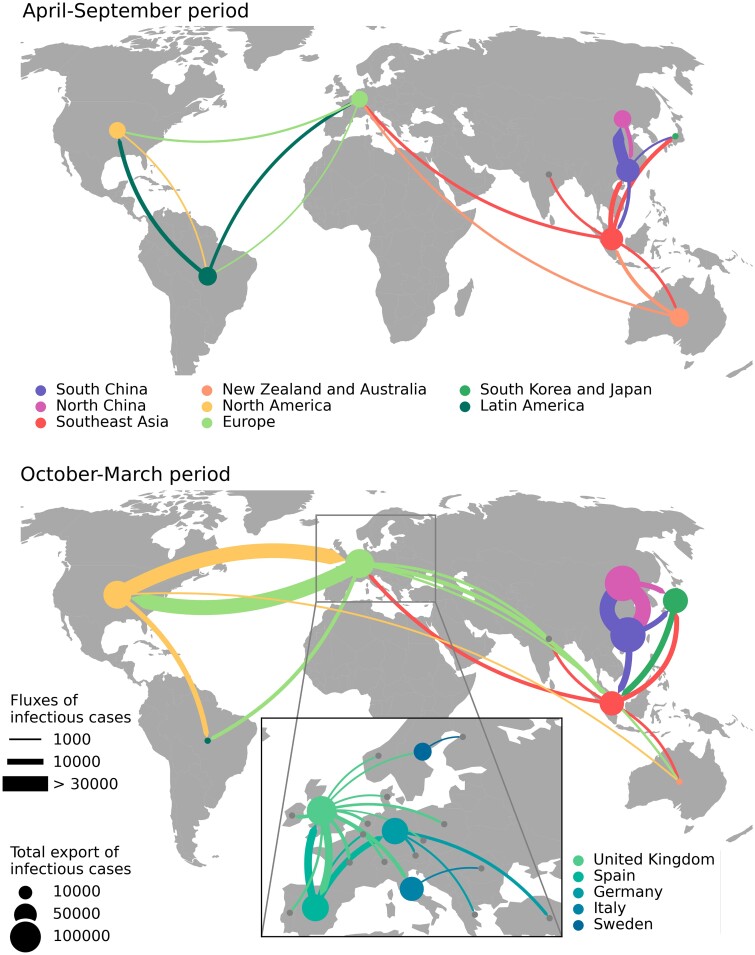
Global seasonal influenza circulation involves a complex interplay between local (seasonality, demography, host immunity) and global factors (international mobility) shaping recurrent epidemic patterns. No studies so far have reconciled the two spatial levels, evaluating the coupling between national epidemics, considering heterogeneous coverage of epidemiological, and virological data, integrating different data sources. We propose a novel-combined approach based on a dynamical model of global influenza spread (GLEAM), integrating high-resolution demographic, and mobility data, and a generalized linear model of phylogeographic diffusion that accounts for time-varying migration rates. Seasonal migration fluxes across countries simulated with GLEAM are tested as phylogeographic predictors to provide model validation and calibration based on genetic data. Seasonal fluxes obtained with a specific transmissibility peak time and recurrent travel outperformed the raw air-transportation predictor, previously considered as optimal indicator of global influenza migration. Influenza A subtypes supported autumn-winter reproductive number as high as 2.25 and an average immunity duration of 2 years. Similar dynamics were preferred by influenza B lineages, with a lower autumn-winter reproductive number. Comparing simulated epidemic profiles against FluNet data offered comparatively limited resolution power. The multiscale approach enables model selection yielding a novel computational framework for describing global influenza dynamics at different scales-local transmission and national epidemics vs. international coupling through mobility and imported cases. Our findings have important implications to improve preparedness against seasonal influenza epidemics. The approach can be generalized to other epidemic contexts, such as emerging disease outbreaks to improve the flexibility and predictive power of modeling.
Keywords: Bayesian inference; influenza; metapopulation; phylogeography.
© The Author(s) 2024. Published by Oxford University Press on behalf of National Academy of Sciences.
Figures
Update of
-
Integrating dynamical modeling and phylogeographic inference to characterize global influenza circulation.medRxiv [Preprint]. 2024 Mar 15:2024.03.14.24303719. doi: 10.1101/2024.03.14.24303719. medRxiv. 2024. Update in: PNAS Nexus. 2024 Dec 17;4(1):pgae561. doi: 10.1093/pnasnexus/pgae561. PMID: 38559244 Free PMC article. Updated. Preprint.
Similar articles
-
Integrating dynamical modeling and phylogeographic inference to characterize global influenza circulation.medRxiv [Preprint]. 2024 Mar 15:2024.03.14.24303719. doi: 10.1101/2024.03.14.24303719. medRxiv. 2024. Update in: PNAS Nexus. 2024 Dec 17;4(1):pgae561. doi: 10.1093/pnasnexus/pgae561. PMID: 38559244 Free PMC article. Updated. Preprint.
-
Physical interventions to interrupt or reduce the spread of respiratory viruses.Cochrane Database Syst Rev. 2023 Jan 30;1(1):CD006207. doi: 10.1002/14651858.CD006207.pub6. Cochrane Database Syst Rev. 2023. PMID: 36715243 Free PMC article.
-
Neuraminidase inhibitors for preventing and treating influenza in healthy adults and children.Cochrane Database Syst Rev. 2012 Jan 18;1:CD008965. doi: 10.1002/14651858.CD008965.pub3. Cochrane Database Syst Rev. 2012. Update in: Cochrane Database Syst Rev. 2014 Apr 10;(4):CD008965. doi: 10.1002/14651858.CD008965.pub4. PMID: 22258996 Updated.
-
Systemic pharmacological treatments for chronic plaque psoriasis: a network meta-analysis.Cochrane Database Syst Rev. 2017 Dec 22;12(12):CD011535. doi: 10.1002/14651858.CD011535.pub2. Cochrane Database Syst Rev. 2017. Update in: Cochrane Database Syst Rev. 2020 Jan 9;1:CD011535. doi: 10.1002/14651858.CD011535.pub3. PMID: 29271481 Free PMC article. Updated.
-
Population-based interventions for reducing sexually transmitted infections, including HIV infection.Cochrane Database Syst Rev. 2004;(2):CD001220. doi: 10.1002/14651858.CD001220.pub2. Cochrane Database Syst Rev. 2004. Update in: Cochrane Database Syst Rev. 2011 Mar 16;(3):CD001220. doi: 10.1002/14651858.CD001220.pub3. PMID: 15106156 Updated.
Cited by
-
Viral introductions and return to baseline sexual behaviors maintain low-level mpox incidence in Los Angeles County, USA, 2023-2024.medRxiv [Preprint]. 2025 Jun 7:2025.03.14.25323999. doi: 10.1101/2025.03.14.25323999. medRxiv. 2025. PMID: 40162240 Free PMC article. Preprint.
