. 2025 Mar;12(12):e2404166.
doi: 10.1002/advs.202404166. Epub 2024 Dec 31.

Deep Learning-Based Ion Channel Kinetics Analysis for Automated Patch Clamp Recording

Affiliations

Deep Learning-Based Ion Channel Kinetics Analysis for Automated Patch Clamp Recording

Shengjie Yang et al. Adv Sci (Weinh). 2025 Mar.

Abstract

The patch clamp technique is a fundamental tool for investigating ion channel dynamics and electrophysiological properties. This study proposes the first artificial intelligence framework for characterizing multiple ion channel kinetics of whole-cell recordings. The framework integrates machine learning for anomaly detection and deep learning for multi-class classification. The anomaly detection excludes recordings that are incompatible with ion channel behavior. The multi-class classification combined a 1D convolutional neural network, bidirectional long short-term memory, and an attention mechanism to capture the spatiotemporal patterns of the recordings. The framework achieves an accuracy of 97.58% in classifying 124 test datasets into six categories based on ion channel kinetics. The utility of the novel framework is demonstrated in two applications: Alzheimer's disease drug screening and nanomatrix-induced neuronal differentiation. In drug screening, the framework illustrates the inhibitory effects of memantine on endogenous channels, and antagonistic interactions among potassium, magnesium, and calcium ion channels. For nanomatrix-induced differentiation, the classifier indicates the effects of differentiation conditions on sodium and potassium channels associated with action potentials, validating the functional properties of differentiated neurons for Parkinson's disease treatment. The proposed framework is promising for enhancing the efficiency and accuracy of ion channel kinetics analysis in electrophysiological research.

Keywords: deep learning; electrophysiology; ion channels; patch clamp; whole‐cell recording.


Conflict of interest statement

The authors declare no conflict of interest.

Figures

Figure 1
Figure 1
Overview of the proposed method for ion channel kinetics analysis. A) Ion channels on the cell membrane and the whole‐cell configuration for acquiring ion channel currents. B) Anomaly detection for filtering out anomalous recordings and neural networks for recording multi‐class classification. C) Six representative traces of whole‐cell voltage‐clamp recordings: (I) typical ion channel activity; (II) unsustainable outward currents of non‐inactivation activity; (III) slow‐rising current due to the absence of fast inactivation activity; (IV) the presence of slow activation/inactivation activity; (V) disorder channel activity with overlapping currents; and (VI) observation of hyperpolarization‐activated cyclic nucleotide‐gated activity. D) The artificial intelligence framework analyzed recordings to assess the inhibitory effects of memantine on endogenous ion channels, providing kinetics data for drug screening in neurodegenerative diseases. The evoked ion channel activities (red curves) and non‐evoked response currents (black curves) illustrate the effects of the drug. E) The artificial intelligence framework investigated nanomatrix‐induced NSCs differentiation by identifying neurophysiological properties. The activity of evoked sodium and potassium ion channels indicates the functional properties of the neuronal cells.
Figure 2
Figure 2
Anomaly detection of recordings. A) Four representative categories of anomaly signal recordings: (I) aberrant transient ion channel behaviors under voltage stimuli; (II) invalid recordings that fail to capture ion channel activity, where the stimulated region shows no discernible correlation between current and voltage; (III) low signal‐to‐noise ratio recording; and (IV) recording with partially abnormal ion channel activity, where erratic depolarization supersedes hyperpolarization in the non‐stimulated tail region. B) Visualization of anomaly detection using principal component analysis (PCA). The coordinates are principal components. The test dataset consists of 72 abnormal and 72 normal recordings. C) The performance comparison of anomaly detection models employed various mathematical approaches: linear discriminant analysis (LDA), naive Bayes (NB), random forest (RF), decision tree (DT), extra trees (ET), light gradient boosting machine (LGBM), and k‐nearest neighbors (KNN). Performance is evaluated using four metrics: accuracy (Acc.), precision (Pre.), F‐score (F1), and Matthew's correlation coefficient (MCC).
Figure 3
Figure 3
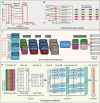
Feature extraction and neural network architecture for multi‐class classification. A) The recording is segmented into three phases: rising, sustaining, and falling. The rising phase marks the increase in current due to voltage‐gated ion channel activation. The sustaining phase presents a steady current, reflecting the equilibrium of ion channel activity. In the falling phase, the end of voltage stimuli manifests as a hyperpolarization process. B) The five response currents are divided into data points within a defined time window, t. Each signal sequence captures time‐dependent ion channel activity and current variations resulting from differing voltages. C) Overview of the neural network architecture. Three 1DCNN‐BiLSTM‐Attention branches process each phase independently. The concatenated outputs from the attention layers across all phases yield the whole‐phase recording label. D) Details of rising branch. Time windows segment each phase into multiple time steps. A sliding kernel across these points forms a feature map, subsequently reduced by pooling. After the dense layer, the BiLSTM layers capture temporal dependencies in both directions. Dropout neurons reduce overfitting. An attention layer assigns weights to the recording's time windows, focusing the model on pertinent features.
Figure 4
Figure 4
Evaluation and comparison of the 1DCNN‐BiLSTM‐Attention model. The entire phase represents the final output from the deep learning model, while the remaining matrices pertain to segmented phases. The model evaluation metrics include A) confusion matrices, B) precision‐recall (PR) curves, and C) receiver operating characteristic (ROC) curves, along with average precision (AP) and area under the curve (AUC) values. D) Comparison of accuracies obtained from different models using the test set.
Figure 5
Figure 5
Drug screening of memantine on endogenous ion channels. A) The inhibitory effect of memantine on the NMDA receptor in reducing excitotoxicity associated with Alzheimer's disease. B) The preparation for whole‐cell voltage‐clamp recordings with six different cell culture and extracellular solution sets, including conditions with and without 50 µM memantine and additional sets with 20 mm calcium and 10 mm magnesium. C) The testing results of multi‐class classification by the ion channel kinetics analysis framework. D) Representative whole‐cell voltage‐clamp recordings from cells untreated and treated with 50 µM memantine. The green box indicates the inward sodium current during the rising phase, the outward potassium current during the rising phase by the yellow box, and the tail current during the falling phase by the purple box. E) Potassium current density for the control (n = 28), membrane (MNT, n = 31), calcium (Ca, n = 24), and the memantine and calcium group (MNT+Ca, n = 26). F) Sodium current density for the control (n = 20), memantine (n = 27), magnesium (Mg, n = 22), and the memantine and magnesium group (MNT+Mg, n = 23). (The data are shown as means ± s.d.; *p < 0.05, **p < 0.01, ***p < 0.001.).
Figure 6
Figure 6
Dynamics of ion channels during memantine (abbreviated MNT in the figure) drug screening. Memantine represents the inclusion of 50 µM memantine in the culture medium. The extracellular solutions contained 10 mm Mg ions or 20 mm Ca ions. The depicted outward current‐voltage (I–V) curves reflect the behavior of potassium (K+) ion channels under different conditions: A) MNT (n = 31) versus control (n = 28), and B) Ca (n = 24) versus MNT+Ca (n = 26). Sodium ion channel activities are represented by the inward sodium (Na+) I–V curves for C) MNT (n = 27) versus control (n = 20), and D) Mg (n = 22) versus MNT+Mg (n = 23). (The data are shown as means ± s.d.).
Figure 7
Figure 7
Characterization of the specific phenotypic differentiation of NSCs by iSECnMs. A) SEM images of iSECnMs showing tilt and top views. The zigzag pitch is approximately 170 nm, and the stiffness is 2.04 ± 0.22 GPa (Young's modulus). B) NSCs were seeded on iSECnMs (left) and glass plates (right, control group) to induce differentiation. NSCs morphology was monitored on the 14th day of culture via microscopy. Axon‐like structures were marked by white arrows. C) The differentiation of NSCs mediated by iSECnMs and control was determined using immunocytochemical analysis of GFAP expression (stained in green). The fluorescence intensity was 12.85 A.U. for iSECnMs and 52.79 A.U. for the control. D) The classification results of ion channel kinetics from recordings of differentiated NSCs, as analyzed by the artificial intelligence framework. E) Representative whole‐cell voltage‐clamp recordings from differentiated NSCs on (i) iSECnMs, (ii) the control, and (iii) iSECnMs with TTX. F) Current density of differentiated NSCs on iSECnMs and the control: outward K+ current density (left); and inward Na+ current density (right). G) I–V curves of inward current for the control (n = 12), iSECnMs (n = 15), and TTX (n = 12). Normalized I–V curves of outward current for the control (n = 12), iSECnMs (n = 15), and TTX (n = 12). Data are presented as means ± s.d.; *p < 0.05, **p < 0.01, ***p < 0.001.

Similar articles

Cited by

References

    1. Parpaite T., Brosse L., Séjourné N., Laur A., Mechioukhi Y., Delmas P., Coste B., Cell Rep. 2021, 37. - PMC - PubMed
    1. Vandael D., Okamoto Y., Borges‐Merjane C., Vargas‐Barroso V., Suter B. A., Jonas P., Nat. Protoc. 2021, 16, 2947. - PubMed
    1. Minakuchi T., Guthman E. M., Acharya P., Hinson J., Fleming W., Witten I. B., Oline S. N., Falkner A. L., Nat. Neurosci. 2024, 24, 702. - PubMed
    1. Sessler C. D., Zhou Y., Wang W., Hartley N. D., Fu Z., Graykowski D., Sheng M., Wang X., Liu J., Sci. Adv. 2022, 8, eade1136. - PMC - PubMed
    1. Choi S. B., Polter A. M., Nemes P., Anal. Chem. 2021, 94, 1637. - PubMed

LinkOut - more resources