Enhancing human ACE2 expression in mouse models to improve COVID-19 research
- PMID: 39737574
- PMCID: PMC11788745
- DOI: 10.1002/2211-5463.13934
Enhancing human ACE2 expression in mouse models to improve COVID-19 research
Abstract
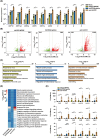
Mice are one of the most common biological models for laboratory use. However, wild-type mice are not susceptible to COVID-19 infection due to the low affinity of mouse ACE2, the entry protein for SARS-CoV-2. Although mice with human ACE2 (hACE2) driven by Ace2 promoter reflect its tissue specificity, these animals exhibit low ACE2 expression, potentially limiting their fidelity in mimicking COVID-19 manifestations and their utility in viral studies. Here, we created and compared hACE2 mouse models generated with different strategies. Our findings show that distinct β-globin insertion within hACE2 cassette significantly influences its expression, with downstream placement enhancing transcription. Moreover, optimizing hACE2 codons (opt-hACE2) improves translation efficiency in multiple tissues. Notably, opt-hACE2 mice displayed more active immune responses and severe COVID-19 phenotypes following SARS-CoV-2 challenge compared to other models. Our study demonstrates the dual regulatory role of β-globin element in transgene transcription and suggests that opt-hACE2 mice might serve as valuable tools for SARS-CoV-2 research.
Keywords: COVID‐19; hACE2; mouse model; β‐globin.
© 2024 The Author(s). FEBS Open Bio published by John Wiley & Sons Ltd on behalf of Federation of European Biochemical Societies.
Conflict of interest statement
Author Wu Guangming is currently running a company called MingCeler Biotech Co Lt, which may be affected by the research reported in the enclosed paper. The other authors have no competing interests.
Figures


Similar articles
-
A human-ACE2 knock-in mouse model for SARS-CoV-2 infection recapitulates respiratory disorders but avoids neurological disease associated with the transgenic K18-hACE2 model.mBio. 2025 May 14;16(5):e0072025. doi: 10.1128/mbio.00720-25. Epub 2025 Apr 24. mBio. 2025. PMID: 40272151 Free PMC article.
-
SARS-CoV-2 Causes Lung Infection without Severe Disease in Human ACE2 Knock-In Mice.J Virol. 2022 Jan 12;96(1):e0151121. doi: 10.1128/JVI.01511-21. Epub 2021 Oct 20. J Virol. 2022. PMID: 34668780 Free PMC article.
-
The K18-Human ACE2 Transgenic Mouse Model Recapitulates Non-severe and Severe COVID-19 in Response to an Infectious Dose of the SARS-CoV-2 Virus.J Virol. 2022 Jan 12;96(1):e0096421. doi: 10.1128/JVI.00964-21. Epub 2021 Oct 20. J Virol. 2022. PMID: 34668775 Free PMC article.
-
Variants in ACE2; potential influences on virus infection and COVID-19 severity.Infect Genet Evol. 2021 Jun;90:104773. doi: 10.1016/j.meegid.2021.104773. Epub 2021 Feb 17. Infect Genet Evol. 2021. PMID: 33607284 Free PMC article. Review.
-
K18- and CAG-hACE2 Transgenic Mouse Models and SARS-CoV-2: Implications for Neurodegeneration Research.Molecules. 2022 Jun 28;27(13):4142. doi: 10.3390/molecules27134142. Molecules. 2022. PMID: 35807384 Free PMC article. Review.
References
MeSH terms
Substances
Grants and funding
- P35268-B/The Austrian Science Fund (FWF) and 'Herzfelder'sche Familienstiftung project
- Health@InnoHK Program launched by Innovation Technology Commission of the Hong Kong SAR, P. R. China
- 32225012/The National Natural Science Foundation of China
- GIBHBRP23-02/Basic Research Project of Guangzhou Institutes of Biomedicine and Health, Chinese Academy of Sciences
- CN 04/2021/BMBWF and WTZ-OEAD grant
- 2021ZT09Y233/Pearl River Talent Recruitment Program
- GZNL2023A02005/Major Project of Guangzhou National Laboratory
- 2023B1212060050/Science and Technology Planning Project of Guangdong Province, China
- 2023B1212120009/Science and Technology Planning Project of Guangdong Province, China
- 2021YFE0112900/the National Key R&D Program of China
- 2023YFF1204701/the National Key R&D Program of China
LinkOut - more resources
Full Text Sources
Medical
Miscellaneous

