

Real-Time Tractography-Assisted Neuronavigation for Transcranial Magnetic Stimulation
- PMID: 39737576
- PMCID: PMC11685379
- DOI: 10.1002/hbm.70122
Real-Time Tractography-Assisted Neuronavigation for Transcranial Magnetic Stimulation
Abstract
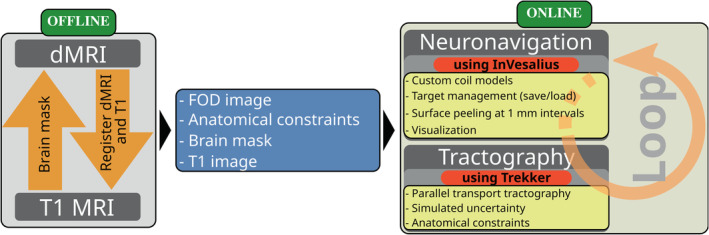
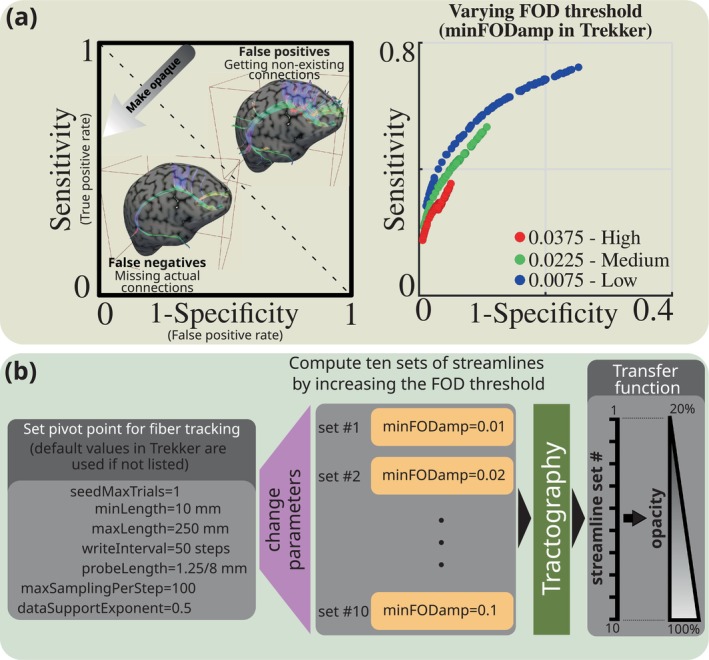
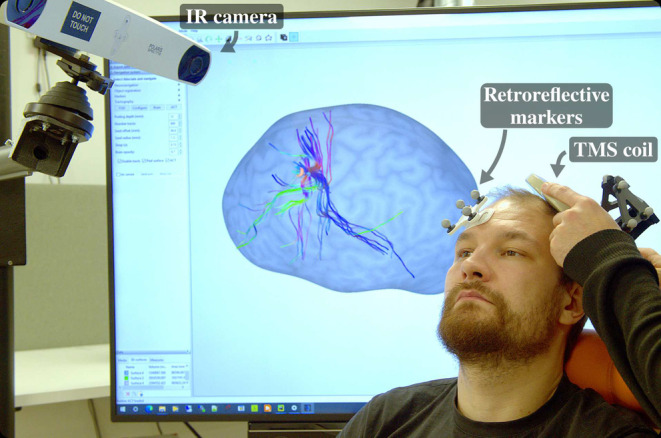
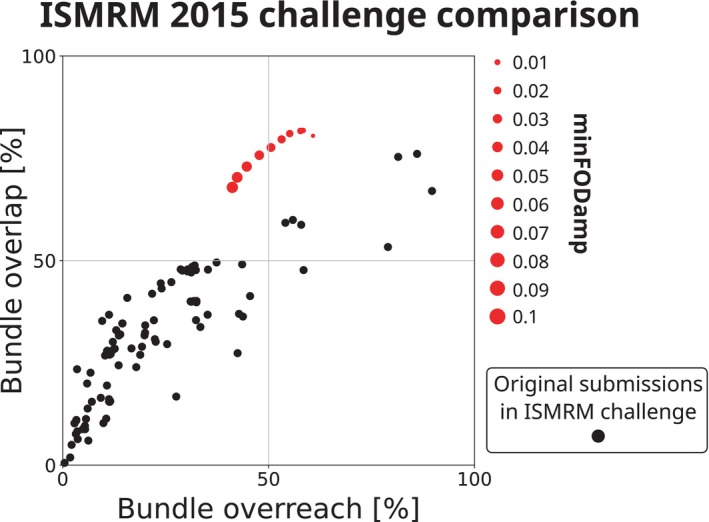
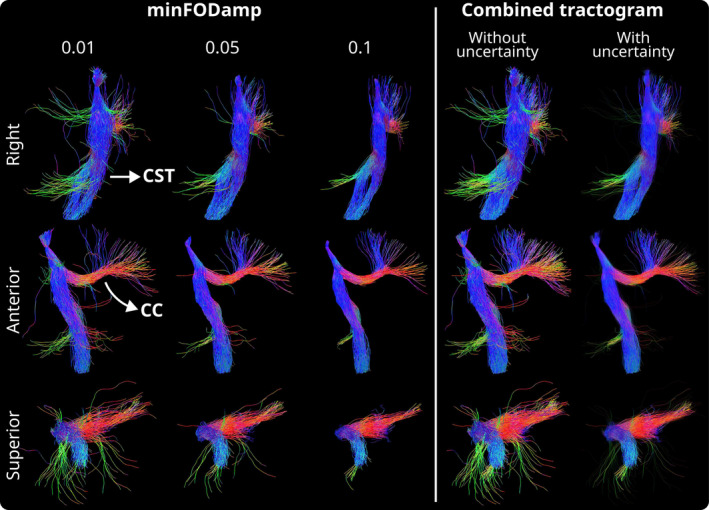
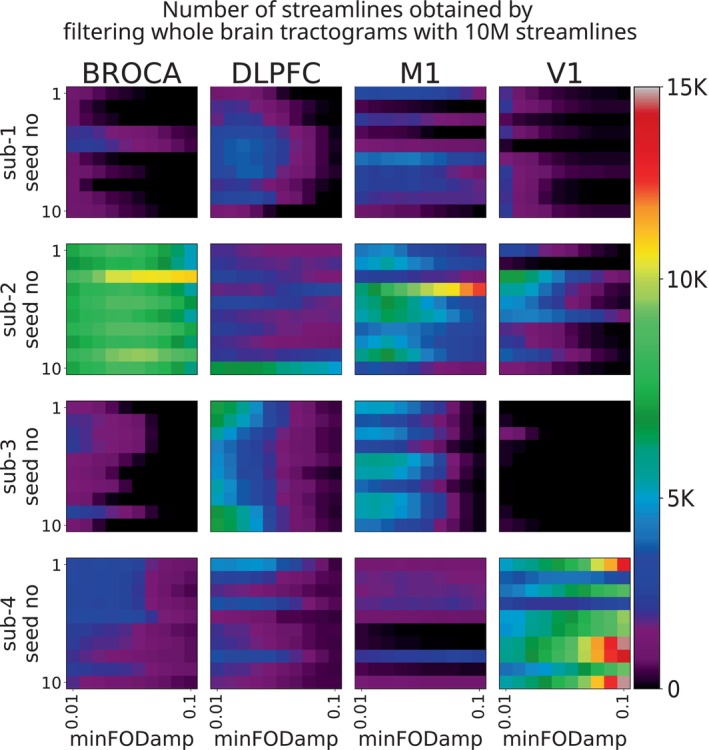
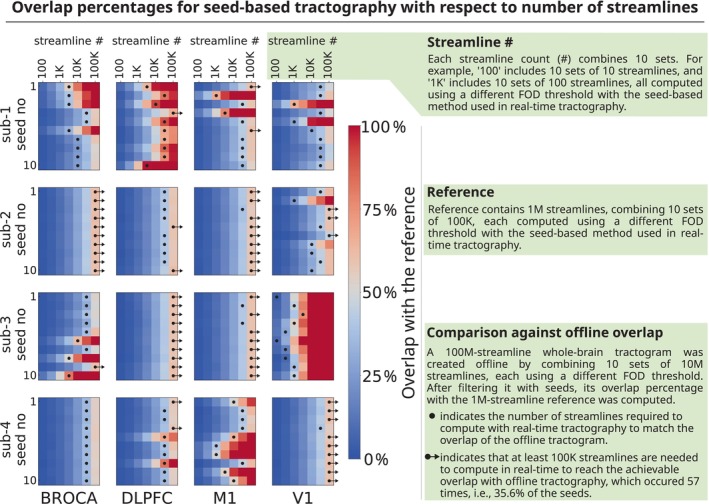
State-of-the-art navigated transcranial magnetic stimulation (nTMS) systems can display the TMS coil position relative to the structural magnetic resonance image (MRI) of the subject's brain and calculate the induced electric field. However, the local effect of TMS propagates via the white-matter network to different areas of the brain, and currently there is no commercial or research neuronavigation system that can highlight in real time the brain's structural connections during TMS. This lack of real-time visualization may overlook critical inter-individual differences in brain connectivity and does not provide the opportunity to target brain networks. In contrast, real-time tractography enables on-the-fly parameter tuning and detailed exploration of connections, which is computationally inefficient and limited with offline methods. To target structural brain connections, particularly in network-based treatments like major depressive disorder, a real-time tractography-based neuronavigation solution is needed to account for each individual's unique brain connectivity. The objective of this work is to develop a real-time tractography-assisted TMS neuronavigation system and investigate its feasibility. We propose a modular framework that seamlessly integrates offline (preparatory) analysis of diffusion MRI data with online (real-time) probabilistic tractography using the parallel transport approach. For tractography and neuronavigation, we combine our open source software Trekker and InVesalius, respectively. We evaluate our system using synthetic data and MRI scans of four healthy volunteers obtained using a multi-shell high-angular resolution diffusion imaging protocol. The feasibility of our online approach is assessed by studying four major TMS targets via comparing streamline count and overlap against offline tractography results based on filtering of one hundred million streamlines. Our development of a real-time tractography-assisted TMS neuronavigation system showcases advanced tractography techniques, with interactive parameter tuning and real-time visualization of thousands of streamlines via an innovative uncertainty visualization method. Our analysis reveals considerable variability among subjects and TMS targets in the streamline count, for example, while 15,000 streamlines were observed for the TMS target on the visual cortex (V1) of subject #4, in the case of subject #3's V1, no streamlines were obtained. Overlap analysis against offline tractograms demonstrated that real-time tractography can quickly cover a substantial part of the target areas' connectivity, often surpassing the coverage of offline approaches within seconds. For instance, significant portions of Broca's area and the primary motor cortex were effectively visualized after generating tens of thousands of streamlines, highlighting the system's efficiency and feasibility in capturing brain connectivity in real-time. Overall, our work shows that real-time tractography-assisted TMS neuronavigation is feasible. With our system, it is possible to target specific brain regions based on their structural connectivity, and to aim for the fiber tracts that make up the brain's networks. Real-time tractography provides new opportunities for TMS targeting through novel visualization techniques without compromising structural connectivity estimates when compared to the offline approach.
Keywords: TMS; brain stimulation; connectivity; diffusion MRI; neuronavigation; tractography.
© 2024 The Author(s). Human Brain Mapping published by Wiley Periodicals LLC.
Conflict of interest statement
PL has been consulting Nexstim Plc in matters other than diffusion based navigated TMS. RJI has consulted Nexstim Plc and has several patents or patent applications related to TMS.
Figures
Similar articles
-
Language pathway tracking: comparing nTMS-based DTI fiber tracking with a cubic ROIs-based protocol.J Neurosurg. 2017 Mar;126(3):1006-1014. doi: 10.3171/2016.2.JNS152382. Epub 2016 May 27. J Neurosurg. 2017. PMID: 27231977
-
Modeling transcranial magnetic stimulation from the induced electric fields to the membrane potentials along tractography-based white matter fiber tracts.J Neural Eng. 2016 Apr;13(2):026028. doi: 10.1088/1741-2560/13/2/026028. Epub 2016 Mar 2. J Neural Eng. 2016. PMID: 26934301
-
A new approach for corticospinal tract reconstruction based on navigated transcranial stimulation and standardized fractional anisotropy values.Neuroimage. 2012 Sep;62(3):1600-9. doi: 10.1016/j.neuroimage.2012.05.059. Epub 2012 May 29. Neuroimage. 2012. PMID: 22659445
-
The structural and functional connectivity of the posterior cingulate cortex: comparison between deterministic and probabilistic tractography for the investigation of structure-function relationships.Neuroimage. 2014 Nov 15;102 Pt 1:118-27. doi: 10.1016/j.neuroimage.2013.12.022. Epub 2013 Dec 21. Neuroimage. 2014. PMID: 24365673 Review.
-
Merits and Limits of Tractography Techniques for the Uninitiated.Adv Tech Stand Neurosurg. 2016;(43):37-60. doi: 10.1007/978-3-319-21359-0_2. Adv Tech Stand Neurosurg. 2016. PMID: 26508405 Review.
Cited by
-
State-Dependent Transcranial Magnetic Stimulation Synchronized with Electroencephalography: Mechanisms, Applications, and Future Directions.Brain Sci. 2025 Jul 8;15(7):731. doi: 10.3390/brainsci15070731. Brain Sci. 2025. PMID: 40722322 Free PMC article. Review.
-
Optimization of TMS target engagement: current state and future perspectives.Front Neurosci. 2025 Jan 29;19:1517228. doi: 10.3389/fnins.2025.1517228. eCollection 2025. Front Neurosci. 2025. PMID: 39944889 Free PMC article.
-
Design, construction, and deployment of a multi-locus transcranial magnetic stimulation system for clinical use.Biomed Eng Online. 2025 May 18;24(1):61. doi: 10.1186/s12938-025-01393-6. Biomed Eng Online. 2025. PMID: 40383760 Free PMC article.
References
-
- Arai, N. , Lu M. K., Ugawa Y., and Ziemann U.. 2012. “Effective Connectivity Between Human Supplementary Motor Area and Primary Motor Cortex: A Paired‐Coil TMS Study.” Experimental Brain Research 220: 79–87. - PubMed
-
- Avants, B. B. , Tustison N., and Song G.. 2009. “Advanced Normalization Tools (ANTS).” Insight Journal 2: 1–35.
-
- Aydogan, D. B. 2020. “Visualization of Uncertainty in Tractograms Using ROC‐Based Transfer Functions for Real‐Time TMS Applications.” In Proceedings of the 28th Annual Meeting of ISMRM .
MeSH terms
Grants and funding
LinkOut - more resources
Full Text Sources
