

Microstructural mapping of neural pathways in Alzheimer's disease using macrostructure-informed normative tractometry
- PMID: 39737627
- PMCID: PMC11782200
- DOI: 10.1002/alz.14371
Microstructural mapping of neural pathways in Alzheimer's disease using macrostructure-informed normative tractometry
Abstract
Introduction: Diffusion-weighted magnetic resonance imaging (dMRI) is sensitive to the microstructural properties of brain tissues and shows great promise in detecting the effects of degenerative diseases. However, many approaches analyze single measures averaged over regions of interest without considering the underlying fiber geometry.
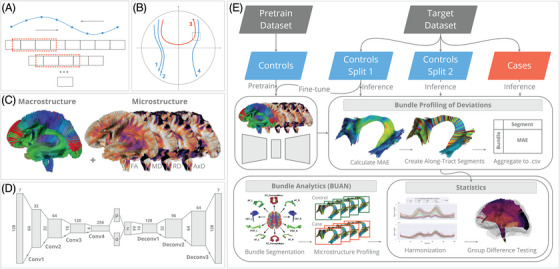
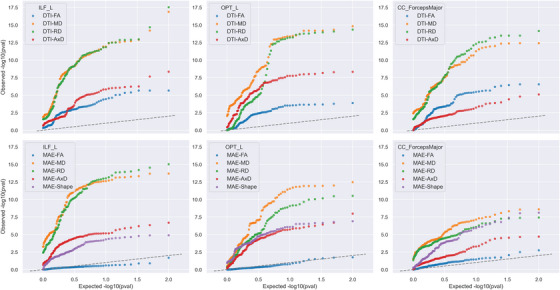
Methods: We propose a novel macrostructure-informed normative tractometry (MINT) framework to investigate how white matter (WM) microstructure and macrostructure are jointly altered in mild cognitive impairment (MCI) and dementia. We compared MINT-derived metrics with univariate diffusion tensor imaging (DTI) metrics to examine how fiber geometry may impact the interpretation of microstructure.
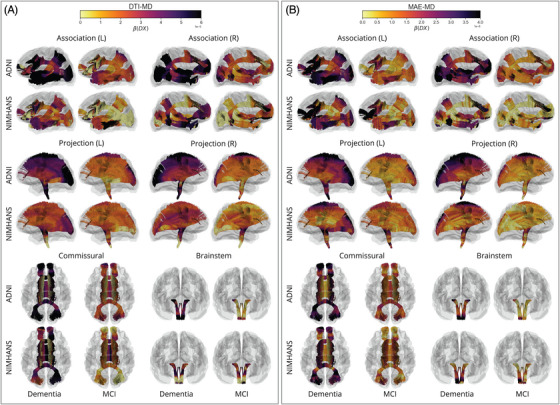
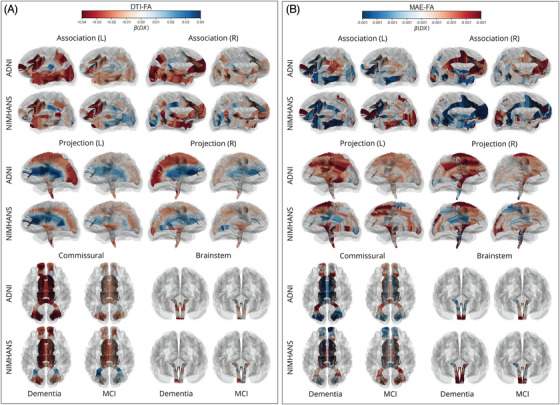
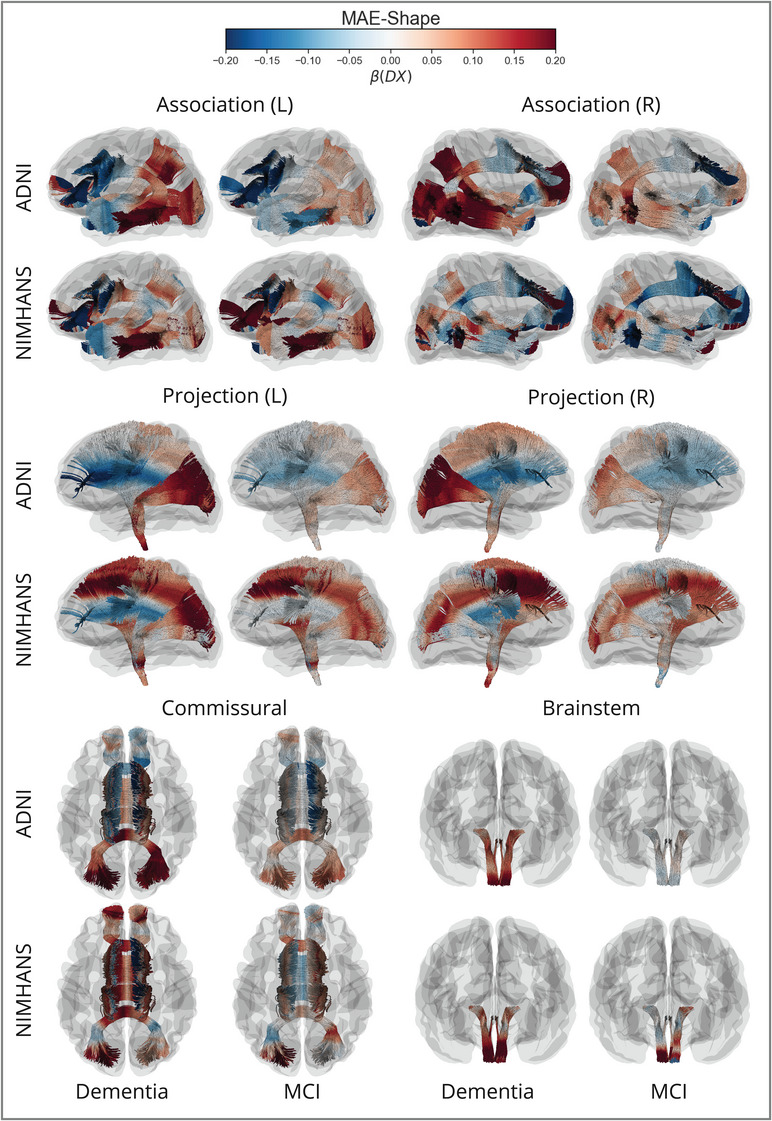
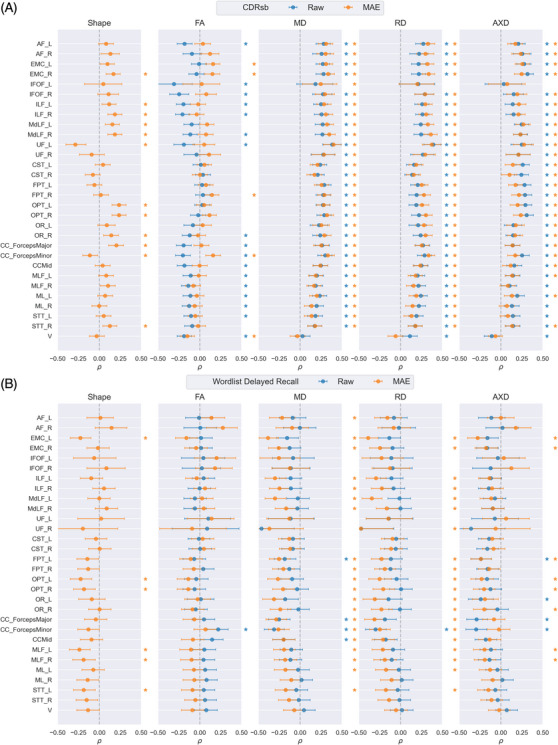
Results: In two multisite cohorts from North America and India, we find consistent patterns of microstructural and macrostructural anomalies implicated in MCI and dementia; we also rank diffusion metrics' sensitivity to dementia.
Discussion: We show that MINT, by jointly modeling tract shape and microstructure, has the potential to disentangle and better interpret the effects of degenerative disease on the brain's neural pathways.
Highlights: Changes in diffusion tensor imaging metrics may be due to macroscopic changes. Normative models encode normal variability of diffusion metrics in healthy controls. Variational autoencoder applied on tractography can learn patterns of fiber geometry. WM microstructure and macrostructure are modeled with multivariate methods. Transfer learning uses pretraining and fine-tuning for increased efficiency.
Keywords: Alzheimer's disease; anomaly detection; deep generative models; diffusion magnetic resonance imaging; normative modeling; tractometry; transfer learning.
© 2024 The Author(s). Alzheimer's & Dementia published by Wiley Periodicals LLC on behalf of Alzheimer's Association.
Conflict of interest statement
The authors declare no potential conflict of interests. Author disclosures are available in the Supporting Information.
Figures
Update of
-
Microstructural Mapping of Neural Pathways in Alzheimer's Disease using Macrostructure-Informed Normative Tractometry.bioRxiv [Preprint]. 2024 Apr 28:2024.04.25.591183. doi: 10.1101/2024.04.25.591183. bioRxiv. 2024. Update in: Alzheimers Dement. 2025 Jan;21(1):e14371. doi: 10.1002/alz.14371. PMID: 38712293 Free PMC article. Updated. Preprint.
Similar articles
-
Microstructural Mapping of Neural Pathways in Alzheimer's Disease using Macrostructure-Informed Normative Tractometry.bioRxiv [Preprint]. 2024 Apr 28:2024.04.25.591183. doi: 10.1101/2024.04.25.591183. bioRxiv. 2024. Update in: Alzheimers Dement. 2025 Jan;21(1):e14371. doi: 10.1002/alz.14371. PMID: 38712293 Free PMC article. Updated. Preprint.
-
Mapping Alzheimer's disease pathology using free water through integrated analysis of plasma biomarkers, microstructural DTI metrics, and macrostructural MRI measures.Sci Rep. 2025 Aug 21;15(1):30702. doi: 10.1038/s41598-025-14200-y. Sci Rep. 2025. PMID: 40841382 Free PMC article.
-
Abnormal white matter changes in Alzheimer's disease based on diffusion tensor imaging: A systematic review.Ageing Res Rev. 2023 Jun;87:101911. doi: 10.1016/j.arr.2023.101911. Epub 2023 Mar 15. Ageing Res Rev. 2023. PMID: 36931328
-
Predicting cognitive decline: Deep-learning reveals subtle brain changes in pre-MCI stage.J Prev Alzheimers Dis. 2025 May;12(5):100079. doi: 10.1016/j.tjpad.2025.100079. Epub 2025 Feb 6. J Prev Alzheimers Dis. 2025. PMID: 39920001 Free PMC article.
-
18F PET with flutemetamol for the early diagnosis of Alzheimer's disease dementia and other dementias in people with mild cognitive impairment (MCI).Cochrane Database Syst Rev. 2017 Nov 22;11(11):CD012884. doi: 10.1002/14651858.CD012884. Cochrane Database Syst Rev. 2017. PMID: 29164602 Free PMC article.
Cited by
-
Association between high plasma p-tau181 level and gait changes in patients with mild cognitive impairment.Sci Rep. 2025 Apr 26;15(1):14679. doi: 10.1038/s41598-025-94472-6. Sci Rep. 2025. PMID: 40287471 Free PMC article.
-
Amyloid, Tau, and APOE in Alzheimer's Disease: Impact on White Matter Tracts.bioRxiv [Preprint]. 2024 Aug 6:2024.08.05.606560. doi: 10.1101/2024.08.05.606560. bioRxiv. 2024. Update in: Pac Symp Biocomput. 2025;30:394-411. doi: 10.1142/9789819807024_0029. PMID: 39149378 Free PMC article. Updated. Preprint.
-
Synthetic Diffusion Tensor Imaging Maps Generated by 2D and 3D Probabilistic Diffusion Models: Evaluation and Applications.bioRxiv [Preprint]. 2025 Feb 25:2025.02.21.639511. doi: 10.1101/2025.02.21.639511. bioRxiv. 2025. PMID: 40060678 Free PMC article. Preprint.
-
Functional discrimination of CSF from Alzheimer's patients in a brain on chip platform.Sci Rep. 2025 Aug 13;15(1):29738. doi: 10.1038/s41598-025-97186-x. Sci Rep. 2025. PMID: 40804138 Free PMC article.
-
Recent Insights into the Neurobiology of Alzheimer's Disease and Advanced Treatment Strategies.Mol Neurobiol. 2025 Feb;62(2):2314-2332. doi: 10.1007/s12035-024-04384-1. Epub 2024 Aug 5. Mol Neurobiol. 2025. PMID: 39102108 Review.
References
-
- Le Bihan D, Breton E, Lallemand D, Grenier P, Cabanis E, Laval‐Jeantet M. MR imaging of intravoxel incoherent motions: application to diffusion and perfusion in neurologic disorders. Radiology. 1986;161(2):401–407. - PubMed
-
- Thomopoulos SI, Nir TM, Villalon‐Reina JE, et al. Diffusion MRI metrics and their relation to dementia severity: effects of harmonization approaches. In: Walker A, Rittner L, Romero Castro E, Lepore N, Brieva J, Linguraru MG, eds. 17th International Symposium on Medical Information Processing and Analysis . SPIE; 2021:79.
MeSH terms
Grants and funding
- AARG-23-1149996/US Alzheimer's Association
- R01 AG057892/AG/NIA NIH HHS/United States
- U19 AG024904/AG/NIA NIH HHS/United States
- R01 AG060610/GF/NIH HHS/United States
- R01 AG060610/AG/NIA NIH HHS/United States
- DSTSR/CSI/73/2011 (G)/Department of Science and Technology, Government of India
- DST/CSRI/2017/249 (G)/Department of Science and Technology, Government of India
- R01 AG087513/AG/NIA NIH HHS/United States
- R01 MH134004/MH/NIMH NIH HHS/United States
- DST-SR/CSI/70/2011 (G)/Department of Science and Technology, Government of India
- R01 AG059874/AG/NIA NIH HHS/United States
