

Seasonal Assembly of Nectar Microbial Communities Across Angiosperm Plant Species: Assessing Contributions of Climate and Plant Traits
- PMID: 39737670
- PMCID: PMC11687353
- DOI: 10.1111/ele.70045
Seasonal Assembly of Nectar Microbial Communities Across Angiosperm Plant Species: Assessing Contributions of Climate and Plant Traits
Abstract
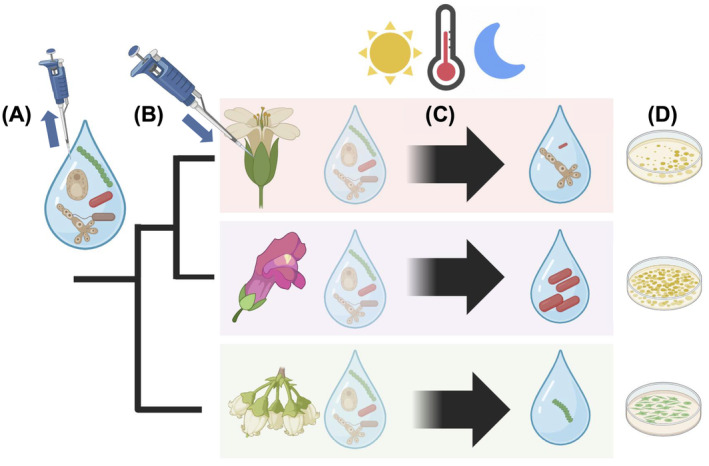
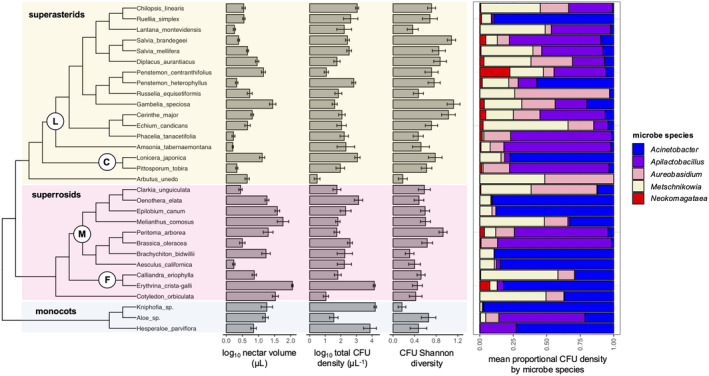
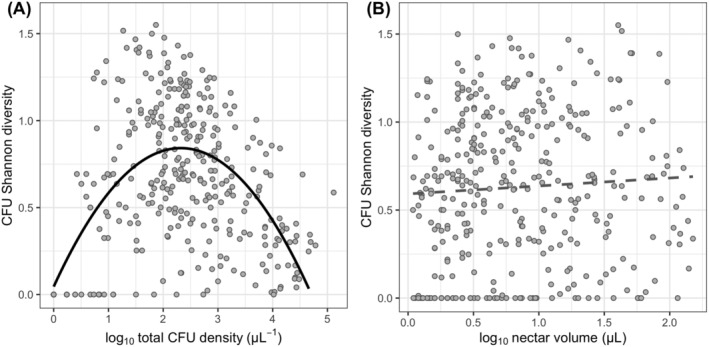
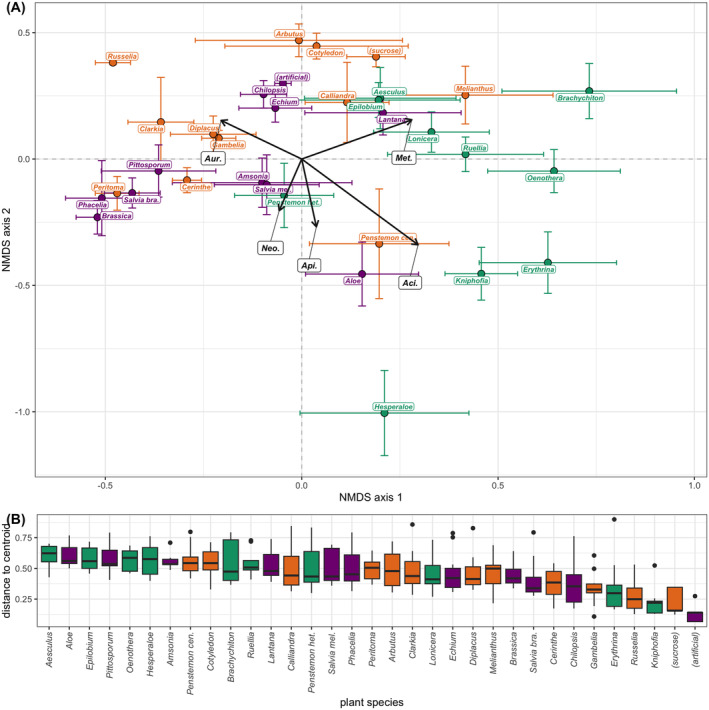
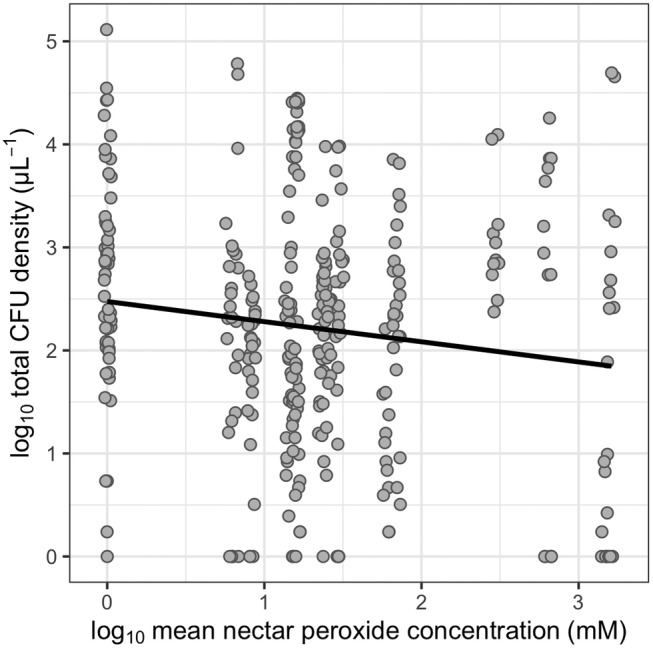
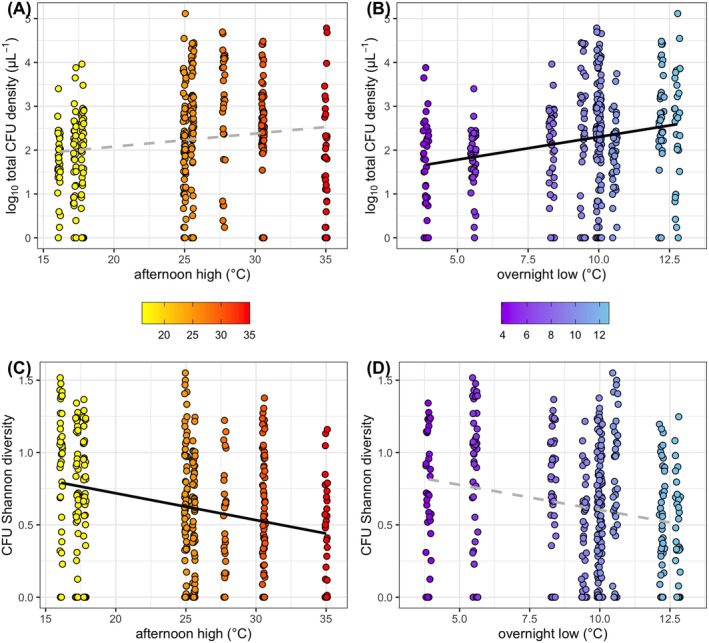
Plant-microbe associations are ubiquitous, but parsing contributions of dispersal, host filtering, competition and temperature on microbial community composition is challenging. Floral nectar-inhabiting microbes, which can influence flowering plant health and pollination, offer a tractable system to disentangle community assembly processes. We inoculated a synthetic community of yeasts and bacteria into nectars of 31 plant species while excluding pollinators. We monitored weather and, after 24 h, collected and cultured communities. We found a strong signature of plant species on resulting microbial abundance and community composition, in part explained by plant phylogeny and nectar peroxide content, but not floral morphology. Increasing temperature reduced microbial diversity, while higher minimum temperatures increased growth, suggesting complex ecological effects of temperature. Consistent nectar microbial communities within plant species could enable plant or pollinator adaptation. Our work supports the roles of host identity, traits and temperature in microbial community assembly, and indicates diversity-productivity relationships within host-associated microbiomes.
Keywords: bacteria; coexistence; community assembly; microbiome; nectar; plant–microbe; pollination syndrome; species interactions; synthetic community; yeasts.
© 2024 The Author(s). Ecology Letters published by John Wiley & Sons Ltd.
Conflict of interest statement
The authors declare no conflicts of interest.
Figures
Similar articles
-
Ecological mechanisms of microbial assembly in clonal plant Glechoma longituba: from soil to endosphere.Appl Environ Microbiol. 2025 Jun 18;91(6):e0033625. doi: 10.1128/aem.00336-25. Epub 2025 May 12. Appl Environ Microbiol. 2025. PMID: 40353652 Free PMC article.
-
Global change aggravates drought, with consequences for plant reproduction.Ann Bot. 2025 Feb 8;135(1-2):89-104. doi: 10.1093/aob/mcae186. Ann Bot. 2025. PMID: 39692585 Review.
-
Neglected Microbes in Floral Nectar: Influence of Filamentous Fungi on Nectar Scent and Parasitoid Olfactory Responses.J Chem Ecol. 2025 Mar 12;51(2):33. doi: 10.1007/s10886-025-01586-2. J Chem Ecol. 2025. PMID: 40072808 Free PMC article.
-
Species morphology better predicts plant-hummingbird interactions across elevations than nectar traits.Proc Biol Sci. 2024 Sep;291(2031):20241279. doi: 10.1098/rspb.2024.1279. Epub 2024 Sep 25. Proc Biol Sci. 2024. PMID: 39317323
-
How Useful Are Plant Traits in Explaining Variation in Phyllosphere Microbial Abundance and Composition Across Hosts?Environ Microbiol. 2025 Jun;27(6):e70123. doi: 10.1111/1462-2920.70123. Environ Microbiol. 2025. PMID: 40527519 Free PMC article.
Cited by
-
The Role of Phenotypic Plasticity and Within-Environment Trait Variability in the Assembly of the Nectar Microbiome and Plant-Microbe-Animal Interactions.Ecol Evol. 2025 Mar 2;15(3):e71059. doi: 10.1002/ece3.71059. eCollection 2025 Mar. Ecol Evol. 2025. PMID: 40027422 Free PMC article. Review.
-
Tiny but mighty? Overview of a decade of research on nectar bacteria.New Phytol. 2025 Mar;245(5):1897-1910. doi: 10.1111/nph.20369. Epub 2024 Dec 23. New Phytol. 2025. PMID: 39716780 Free PMC article. Review.
-
Pollen diet, more than geographic distance, shapes provision microbiome composition in two species of cavity-nesting bees.FEMS Microbiol Ecol. 2025 Jul 14;101(8):fiaf067. doi: 10.1093/femsec/fiaf067. FEMS Microbiol Ecol. 2025. PMID: 40728918 Free PMC article.
-
Nectar peroxide: assessing variation among plant species, microbial tolerance, and effects on microbial community assembly.New Phytol. 2025 May;246(3):1361-1376. doi: 10.1111/nph.70050. Epub 2025 Mar 19. New Phytol. 2025. PMID: 40107316 Free PMC article.
References
-
- Agrawal, A. A. , and Weber M. G.. 2015. “On the Study of Plant Defence and Herbivory Using Comparative Approaches: How Important Are Secondary Plant Compounds.” Ecology Letters 18: 985–991. - PubMed
-
- Aizenberg‐Gershtein, Y. , Izhaki I., and Halpern M.. 2017. “From Microhabitat of Floral Nectar up to Biogeographic Scale: Novel Insights on Neutral and Niche Bacterial Assemblies.” Microbial Ecology 74: 128–139. - PubMed
-
- Aleklett, K. , Hart M., and Shade A.. 2014. “The Microbial Ecology of Flowers: An Emerging Frontier in Phyllosphere Research.” Botany 92: 253–266.
