Meta-Analysis
. 2025 Jan;28(1):e70026.
doi: 10.1111/ele.70026.

Environmental Conditions Modulate Warming Effects on Plant Litter Decomposition Globally

Affiliations
Meta-Analysis

Environmental Conditions Modulate Warming Effects on Plant Litter Decomposition Globally

Sarah Schwieger et al. Ecol Lett. 2025 Jan.

Abstract

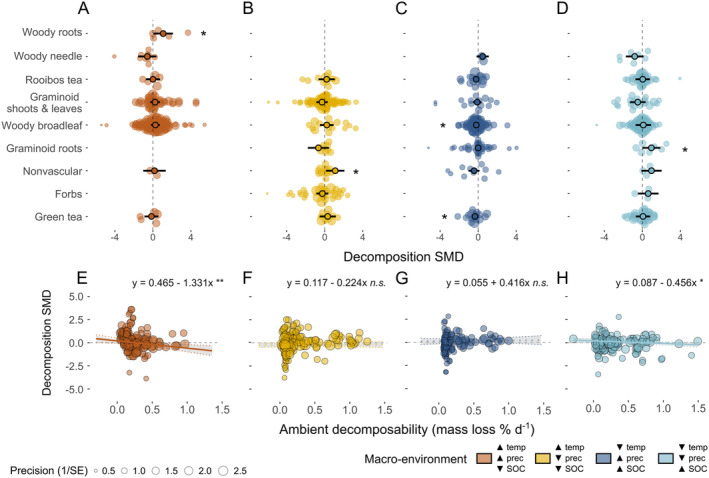
Empirical studies worldwide show that warming has variable effects on plant litter decomposition, leaving the overall impact of climate change on decomposition uncertain. We conducted a meta-analysis of 109 experimental warming studies across seven continents, using natural and standardised plant material, to assess the overarching effect of warming on litter decomposition and identify potential moderating factors. We determined that at least 5.2° of warming is required for a significant increase in decomposition. Overall, warming did not have a significant effect on decomposition at a global scale. However, we found that warming reduced decomposition in warmer, low-moisture areas, while it slightly increased decomposition in colder regions, although this increase was not significant. This is particularly relevant given the past decade's global warming trend at higher latitudes where a large proportion of terrestrial carbon is stored. Future changes in vegetation towards plants with lower litter quality, which we show were likely to be more sensitive to warming, could increase carbon release and reduce the amount of organic matter building up in the soil. Our findings highlight how the interplay between warming, environmental conditions, and litter characteristics improves predictions of warming's impact on ecosystem processes, emphasising the importance of considering context-specific factors.

Keywords: climate change; decomposition; experimental warming; litter bags; litter quality; macro‐environment; meta‐analysis; precipitation; tea bags; temperature.


Conflict of interest statement

The authors declare no conflicts of interest.

Figures

FIGURE 1
FIGURE 1
(A) Map and (B) Whittaker biome diagram showing the location of the 52 published studies of natural litter decomposition in warming experiments (blue circles) and the location of the 57 open‐top chamber experiments where we deployed tea as a standardised plant litter to assess decomposition response to experimental warming (purple triangles) used in this meta‐analysis. Data availability was limited in temperate and tropical rain forests.
FIGURE 2
FIGURE 2
Effects of experimental warming on plant litter decomposition. The pooled average decomposition standardised mean difference (SMD, Hedges' g; triangles) and 95% confidence intervals (black error bars) resulting from warming. Black diamond, represents the overall mean across natural and standardised plant litter; number of effect sizes (k = 637), and separately for the natural litter (grey outlined square, k = 523), rooibos (red outlined triangle, k = 57) and green tea (green outlined triangle, k = 57). Each coloured dot is an individual effect size (non‐outlined circles) with dot size representing its precision (i.e., the inverse of the standard error, with larger points having greater influence on the model).
FIGURE 3
FIGURE 3
Impacts of macro‐environment on litter decomposition responses to experimental warming. (A) Principal component analysis (PCA) of the variation in macro‐environmental factors in our dataset. The arrows are coloured according to the components, which are grouped into temperature, precipitation, soil and other factors (Table S3). The first two axes represent temperature and soil organic carbon‐related variables (PC1), and precipitation (PC2). Full list of the macro‐environmental factors, their scores on PC1 and PC2 and their mean in every class is presented in Tables S3 and S4A. Colours indicate the four macro‐environmental classes distinguished by different combinations of high (▲) or low (▼) temperature (temp), precipitation (prec) and soil organic carbon (SOC). (B) Pooled average decomposition SMD per macro‐environmental class of natural litter (outlined diamonds), rooibos tea (outlines squares), and green tea (outlined circles) ±95% confidence intervals (error bars). Each coloured dot is an individual effect size (non‐outlined circles) with dot size representing its precision (the inverse of the standard error, with larger points having greater influence on the model). Asterisks indicate that the overall pooled average SMD is significantly different from zero (**p < 0.01), whereas different letters denote overall significant differences in the pooled average SMD between macro‐environmental classes, averaged over data type.
FIGURE 4
FIGURE 4
Relationships between the effect of experimental warming on litter decomposition (SMD) and either (A, C, E, G) the degree of warming (i.e., absolute temperature difference between warmed and ambient plots) or (B, D, F, H) warming‐induced changes in soil moisture (i.e., difference between warmed and ambient plots) separately for the four macro‐environmental classes (different panels). Colours indicate the four macro‐environmental classes distinguished by different combinations of high (▲) or low (▼) temperature (temp), precipitation (prec) and soil organic carbon (SOC), consistent with Figure 3. Each coloured dot is an individual effect size (non‐outlined circles) with dot size representing its precision (the inverse of the standard error, with larger points having greater influence on the model). Solid lines indicate regression lines with shaded areas representing the 95% confidence intervals (***p < 0.001). Dashed lines indicate no significant relationship (n.s. = not significant).
FIGURE 5
FIGURE 5
Relationship between plant functional types, ambient decomposability and the experimental warming effect on litter decomposition across the four macro‐environmental classes. (A, B, C, D) The pooled average decomposition standardised mean difference (SMD, Hedges' g, black outlined circles) and 95% confidence intervals (black error bars) for different plant functional types (when data was available; see methods) in each of the four macro‐environmental classes. (E, F, G, H) Relationship between ambient decomposability (ambient mass loss rate in % d−1) and the warming effect on decomposition for each of the four macro‐environmental classes (see also Figure S7). Colours indicate the four macro‐environmental classes distinguished by different combinations of high (▲) or low (▼) temperature (temp), precipitation (prec) and soil organic carbon (SOC), consistent with Figure 3. Each coloured dot is an individual effect size (non‐outlined circles) with dot size representing its precision (i.e., the inverse of the standard error, with larger points having greater influence on the model). Solid lines indicate regression lines with shaded areas representing the 95% CI. Asterisks, located in association to the direction of the effect, indicate that the overall pooled average SMD is significantly different from zero (*p < 0.05, **p < 0.01). Dashed lines indicate no significant relationship (n.s. = not significant).
FIGURE 6
FIGURE 6
Conceptual summary of significant moderators of the experimental warming effect on plant litter decomposition across four macro‐environmental classes. Main effects of macroenvironmental settings is indicated with large squares, Asterisks denote that the overall pooled average SMD is significantly different from zero (**p < 0.01; n.s. = not significant). Moderators within classes are indicated as having an increasing (+) or decreasing (−) effect on decomposition compared to ambient conditions for those moderators that were significant. Colours represent the four classes, defined by combinations of high or low temperature and precipitation, consistent with Figure 3.

Similar articles

References

    1. Aerts, R. 1997. “Climate, Leaf Litter Chemistry and Leaf Litter Decomposition in Terrestrial Ecosystems: A Triangular Relationship.” Oikos 79: 439.
    1. Aerts, R. 2006. “The Freezer Defrosting: Global Warming and Litter Decomposition Rates in Cold Biomes: Global Warming and Litter Decomposition .” Journal of Ecology 94: 713–724.
    1. Aronson, E. L. , and McNulty S. G.. 2009. “Appropriate Experimental Ecosystem Warming Methods by Ecosystem, Objective, and Practicality.” Agricultural and Forest Meteorology 149: 1791–1799.
    1. Bai, T. , Wang P., Qiu Y., Zhang Y., and Hu S.. 2023. “Nitrogen Availability Mediates Soil Carbon Cycling Response to Climate Warming: A Meta‐Analysis.” Global Change Biology 29: 2608–2626. - PubMed
    1. Bardgett, R. D. , Freeman C., and Ostle N. J.. 2008. “Microbial Contributions to Climate Change Through Carbon Cycle Feedbacks.” ISME Journal 2: 805–814. - PubMed

Websites

    1. European Centre for Medium‐Range Weather Forecasts . 2022. “European State of the Climate.” Last Accessed 29 January 2024. https://climate.copernicus.eu/esotc/2022.
    1. National Centers for Environmental Information . 2023. “Global Drought Information System.” Last Accessed 29 January 2024. https://www.ncei.noaa.gov/access/monitoring/monthly‐report/global‐drough....

Publication types

LinkOut - more resources