

T2* relaxometry of fetal brain structures using low-field (0.55T) MRI
- PMID: 39737688
- PMCID: PMC11893027
- DOI: 10.1002/mrm.30409
T2* relaxometry of fetal brain structures using low-field (0.55T) MRI
Abstract
Purpose: Human brain development during gestation is complex, as both structure and function are rapidly forming. Structural imaging methods using MRI are well developed to explore these changes, but functional imaging tools are lacking. Low-field MRI is a promising modality to bridge this gap. The longer intrinsic T2* values at low field strengths increase the dynamic range and enable the quantification of individual brain regions with low T2* values, such as deep gray matter. This study investigates regional brain T2* quantification throughout the second half of gestation on low-field 0.55T MRI.
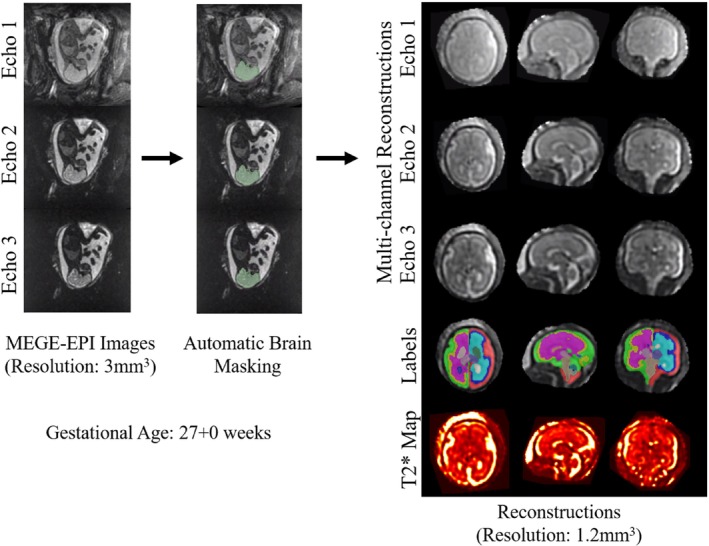
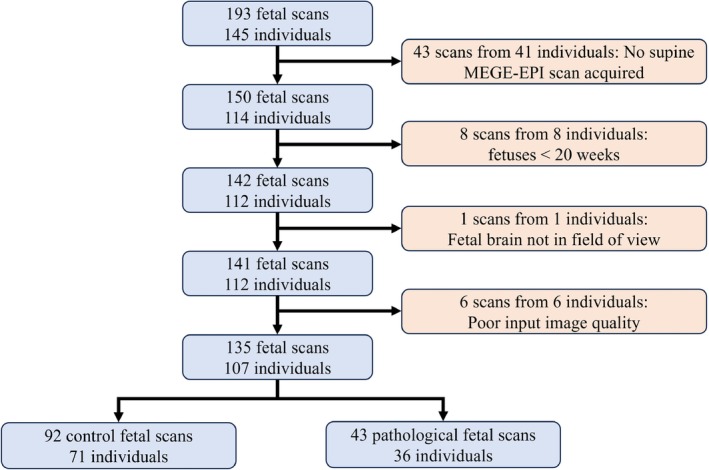
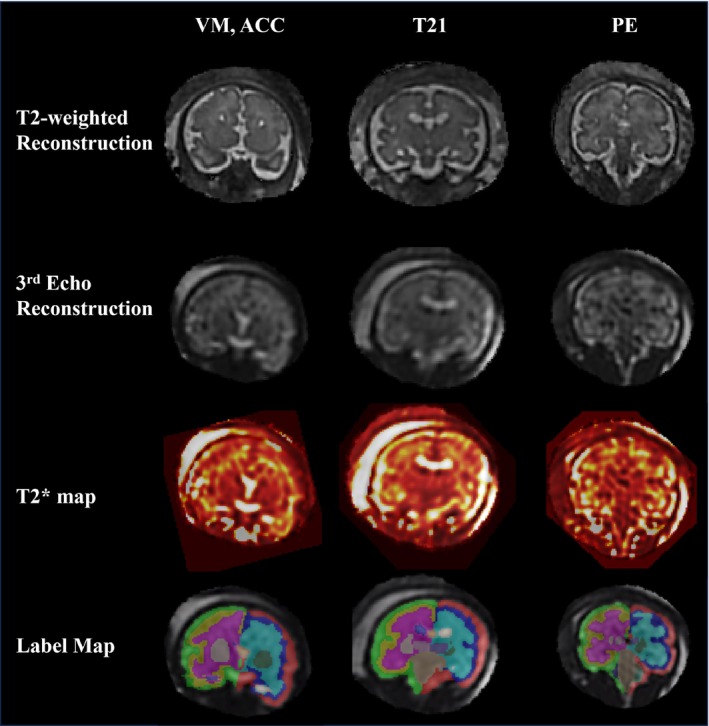
Methods: Dynamic multi-echo gradient-echo sequences were acquired in 135 cases at 0.55 T between 20 and 40 weeks' gestation. Automatic high-resolution reconstruction and segmentation tools were developed, resulting in T2* values of seven individual anatomical brain structures for each subject. These regional brain T2* values were analyzed throughout gestation.
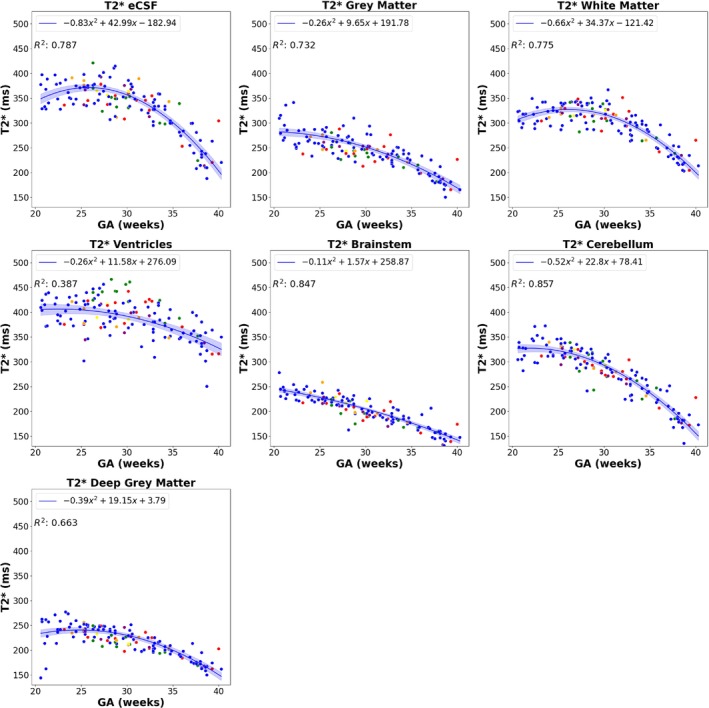
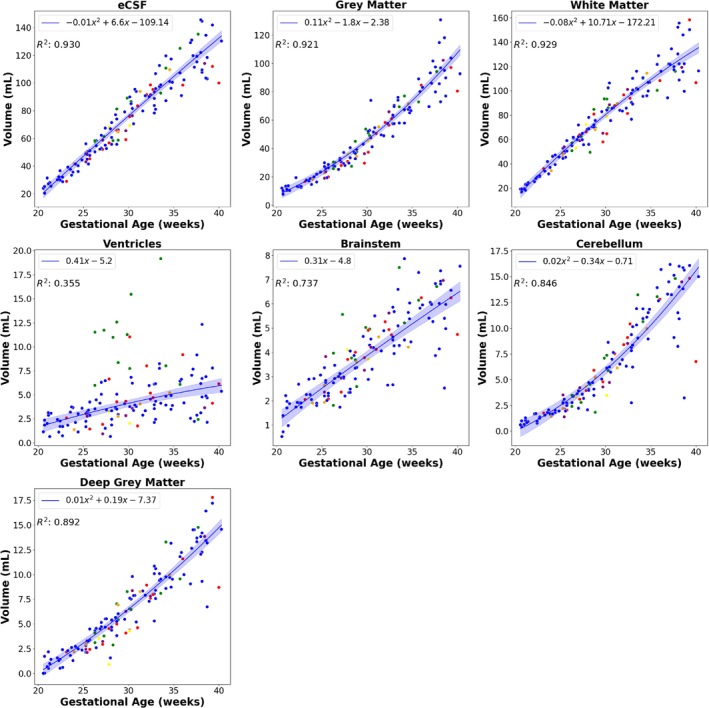
Results: All regional fetal brain T2* values decreased throughout gestation (p < 0.01). Each anatomical brain structure had varying ranges and decay rates, with the cerebellum and white matter displaying the highest (nonfluid structure) values, with the maximum values between 350 and 400 ms at about 20 weeks. The brainstem and deep gray matter had the lowest range of T2* values, reaching values of 250 ms early in gestation. The matched volumetric assessment of the different structures demonstrated expected growth, matching current literature.
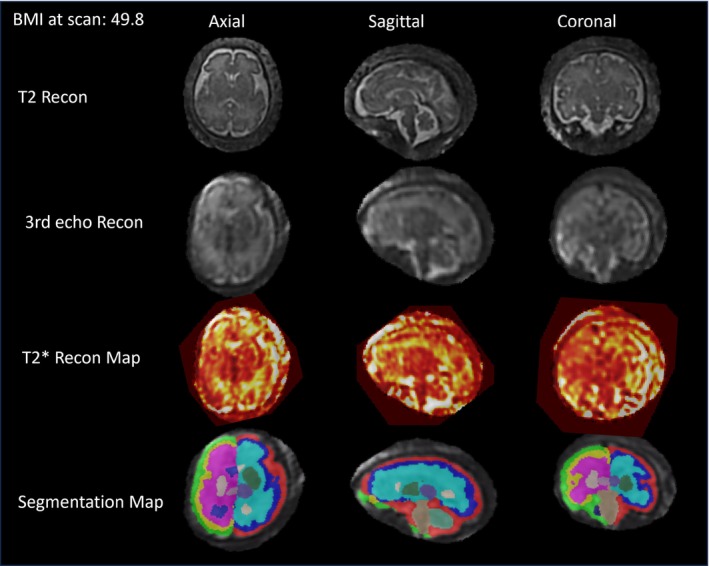
Conclusion: Low-field MRI allows for a detailed, regional T2* analysis of the fetal brain, with more inclusive norms to be developed due to its wider bore.
Keywords: T2* relaxometry; fetal brain development; low‐field MRI.
© 2024 The Author(s). Magnetic Resonance in Medicine published by Wiley Periodicals LLC on behalf of International Society for Magnetic Resonance in Medicine.
Figures
Similar articles
-
Real-time fetal brain and placental T2* mapping at 0.55T MRI.Magn Reson Med. 2025 Aug;94(2):615-624. doi: 10.1002/mrm.30497. Epub 2025 Mar 10. Magn Reson Med. 2025. PMID: 40065547 Free PMC article.
-
Fetal body organ T2* relaxometry at low field strength (FOREST).Med Image Anal. 2025 Jan;99:103352. doi: 10.1016/j.media.2024.103352. Epub 2024 Sep 19. Med Image Anal. 2025. PMID: 39326224
-
Characterizing T1 in the fetal brain and placenta over gestational age at 0.55T.Magn Reson Med. 2024 Nov;92(5):2101-2111. doi: 10.1002/mrm.30193. Epub 2024 Jul 5. Magn Reson Med. 2024. PMID: 38968093 Free PMC article.
-
Role of magnetic resonance imaging in fetuses with mild or moderate ventriculomegaly in the era of fetal neurosonography: systematic review and meta-analysis.Ultrasound Obstet Gynecol. 2019 Aug;54(2):164-171. doi: 10.1002/uog.20197. Epub 2019 Jul 11. Ultrasound Obstet Gynecol. 2019. PMID: 30549340
-
Fetal MRI Neuroradiology: Indications.Clin Perinatol. 2022 Sep;49(3):573-586. doi: 10.1016/j.clp.2022.05.001. Clin Perinatol. 2022. PMID: 36113923 Review.
Cited by
-
Real-time fetal brain and placental T2* mapping at 0.55T MRI.Magn Reson Med. 2025 Aug;94(2):615-624. doi: 10.1002/mrm.30497. Epub 2025 Mar 10. Magn Reson Med. 2025. PMID: 40065547 Free PMC article.
-
Scanner-based real-time three-dimensional brain + body slice-to-volume reconstruction for T2-weighted 0.55-T low-field fetal magnetic resonance imaging.Pediatr Radiol. 2025 Mar;55(3):556-569. doi: 10.1007/s00247-025-06165-x. Epub 2025 Jan 24. Pediatr Radiol. 2025. PMID: 39853394 Free PMC article.
References
-
- Payette K, Moehrlen U, Mazzone L, et al. Longitudinal analysis of fetal MRI in patients with prenatal spina bifida repair. In: Wang Q, Gomez A, Hutter J, et al., eds. Smart Ultrasound Imaging and Perinatal, Preterm and Paediatric Image Analysis. Lecture Notes in Computer Science. Springer International Publishing; 2019:161‐170. doi:10.1007/978-3-030-32875-7_18 - DOI
MeSH terms
Grants and funding
LinkOut - more resources
Full Text Sources
Medical
Miscellaneous
