

WALINET: A water and lipid identification convolutional neural network for nuisance signal removal in MR spectroscopic imaging
- PMID: 39737778
- PMCID: PMC11782715
- DOI: 10.1002/mrm.30402
WALINET: A water and lipid identification convolutional neural network for nuisance signal removal in MR spectroscopic imaging
Abstract
Purpose: Proton magnetic resonance spectroscopic imaging ( -MRSI) provides noninvasive spectral-spatial mapping of metabolism. However, long-standing problems in whole-brain -MRSI are spectral overlap of metabolite peaks with large lipid signal from scalp, and overwhelming water signal that distorts spectra. Fast and effective methods are needed for high-resolution -MRSI to accurately remove lipid and water signals while preserving the metabolite signal. The potential of supervised neural networks for this task remains unexplored, despite their success for other MRSI processing.
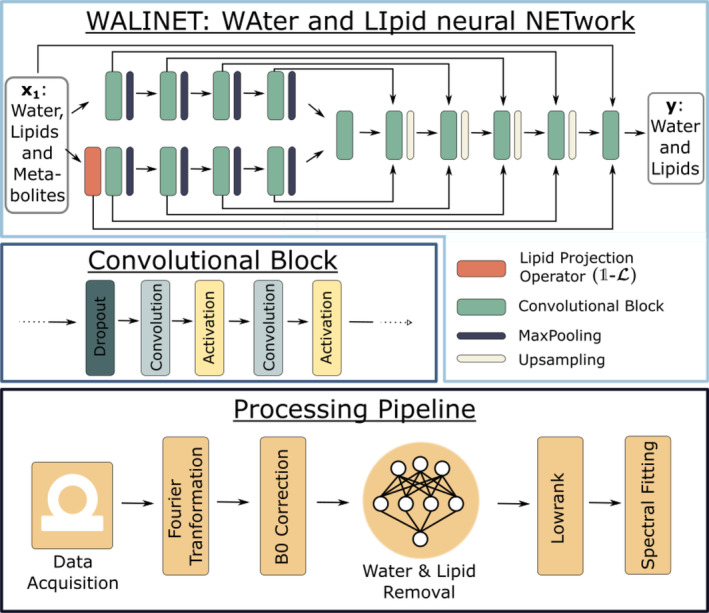
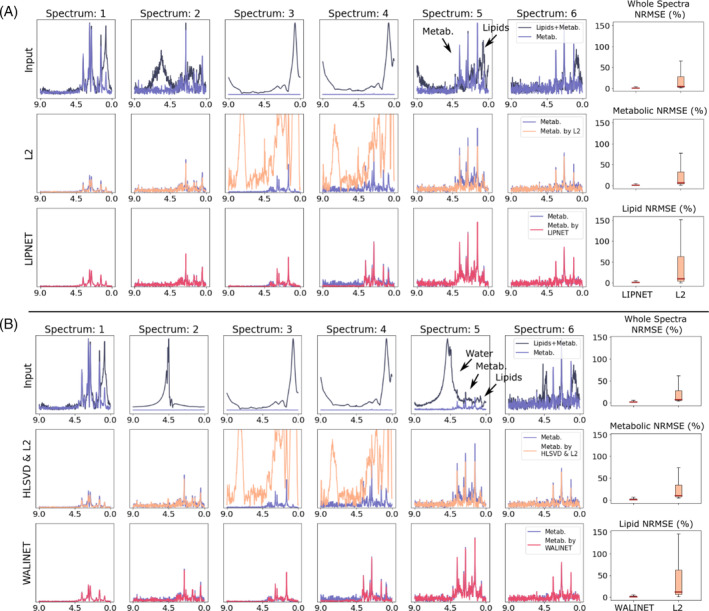
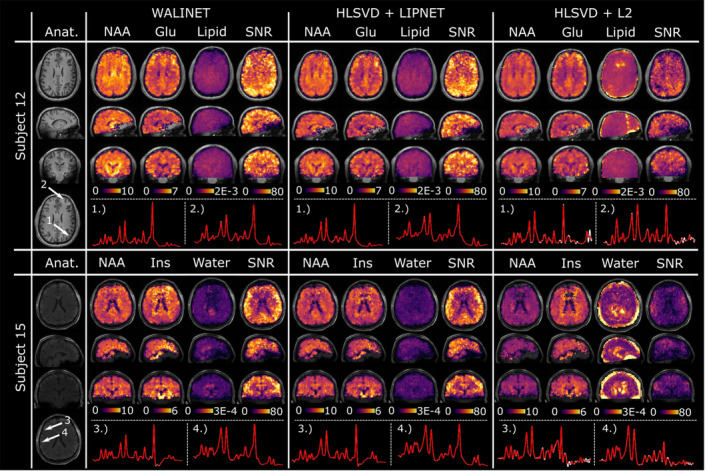
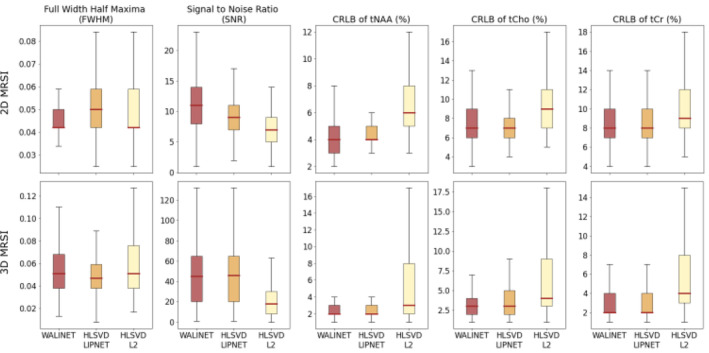
Methods: We introduce a deep learning method based on a modified Y-NET network for water and lipid removal in whole-brain -MRSI. The WALINET (WAter and LIpid neural NETwork) was compared with conventional methods such as the state-of-the-art lipid L2 regularization and Hankel-Lanczos singular value decomposition (HLSVD) water suppression. Methods were evaluated on simulated models and in vivo whole-brain MRSI using NMRSE, SNR, CRLB, and FWHM metrics.
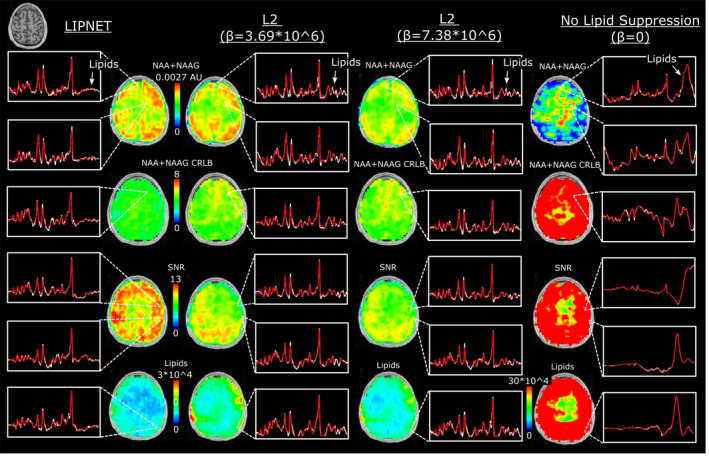
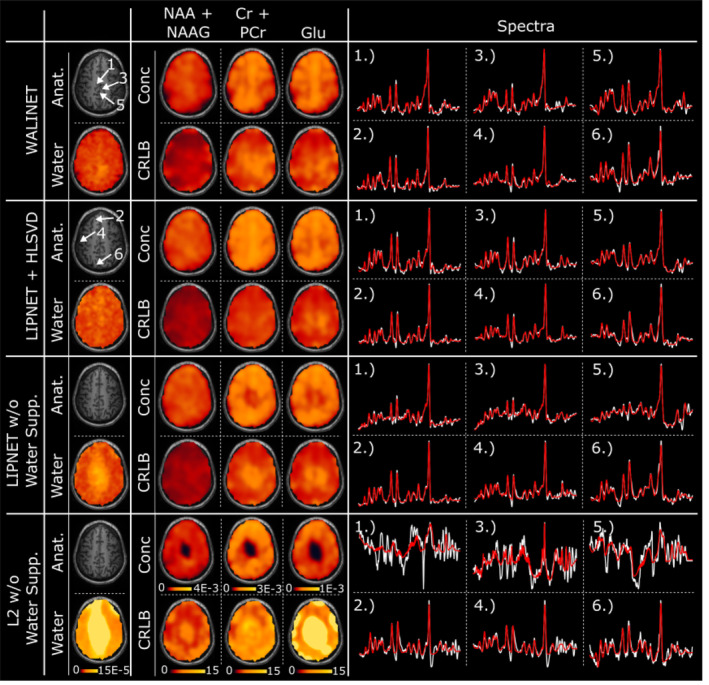
Results: WALINET is significantly faster and needs 8s for high-resolution whole-brain MRSI, compared with 42min for conventional HLSVD+L2. WALINET suppresses lipid and water in the brain by 25-45 and 34-53-fold, respectively. WALINET has better performance than HLSVD+L2, providing: (1) more lipid removal with 41% lower NRMSE; (2) better metabolite signal preservation with 71% lower NRMSE in simulated data; 155% higher SNR and 50% lower CRLB in in vivo data. Metabolic maps obtained by WALINET in healthy subjects and patients show better gray-/white-matter contrast with more visible structural details.
Conclusions: WALINET has superior performance for nuisance signal removal and metabolite quantification on whole-brain -MRSI compared with conventional state-of-the-art techniques. This represents a new application of deep learning for MRSI processing, with potential for automated high-throughput workflow.
Keywords: brain; metabolite quantification; mr spectroscopic imaging; ultrahigh‐field mr; water and lipid removal.
© 2024 The Author(s). Magnetic Resonance in Medicine published by Wiley Periodicals LLC on behalf of International Society for Magnetic Resonance in Medicine.
Figures
Similar articles
-
Deep-ER: Deep Learning ECCENTRIC Reconstruction for fast high-resolution neurometabolic imaging.Neuroimage. 2025 Apr 1;309:121045. doi: 10.1016/j.neuroimage.2025.121045. Epub 2025 Feb 1. Neuroimage. 2025. PMID: 39894238 Free PMC article.
-
Method for fast lipid reconstruction and removal processing in 1 H MRSI of the brain.Magn Reson Med. 2021 Dec;86(6):2930-2944. doi: 10.1002/mrm.28949. Epub 2021 Aug 2. Magn Reson Med. 2021. PMID: 34337788 Free PMC article.
-
Water removal in MR spectroscopic imaging with L2 regularization.Magn Reson Med. 2019 Oct;82(4):1278-1287. doi: 10.1002/mrm.27824. Epub 2019 May 31. Magn Reson Med. 2019. PMID: 31148254 Free PMC article.
-
Developments in proton MR spectroscopic imaging of prostate cancer.MAGMA. 2022 Aug;35(4):645-665. doi: 10.1007/s10334-022-01011-9. Epub 2022 Apr 20. MAGMA. 2022. PMID: 35445307 Free PMC article. Review.
-
Accelerated MR spectroscopic imaging-a review of current and emerging techniques.NMR Biomed. 2021 May;34(5):e4314. doi: 10.1002/nbm.4314. Epub 2020 May 12. NMR Biomed. 2021. PMID: 32399974 Free PMC article. Review.
Cited by
-
Deep-ER: Deep Learning ECCENTRIC Reconstruction for fast high-resolution neurometabolic imaging.Neuroimage. 2025 Apr 1;309:121045. doi: 10.1016/j.neuroimage.2025.121045. Epub 2025 Feb 1. Neuroimage. 2025. PMID: 39894238 Free PMC article.
References
-
- Kickingereder P, Andronesi OC. Radiomics, metabolic, and molecular MRI for brain tumors. Seminars in Neurology. Thieme Medical Publishers; 2018;32:40. - PubMed
Publication types
MeSH terms
Substances
Grants and funding
LinkOut - more resources
Full Text Sources
