. 2025 Mar;12(9):e2410992.
doi: 10.1002/advs.202410992. Epub 2024 Dec 31.

Haplotype-Resolved Genotyping and Association Analysis of 1,020 β-Thalassemia Patients by Targeted Long-Read Sequencing

Affiliations

Haplotype-Resolved Genotyping and Association Analysis of 1,020 β-Thalassemia Patients by Targeted Long-Read Sequencing

Yuhua Ye et al. Adv Sci (Weinh). 2025 Mar.

Abstract

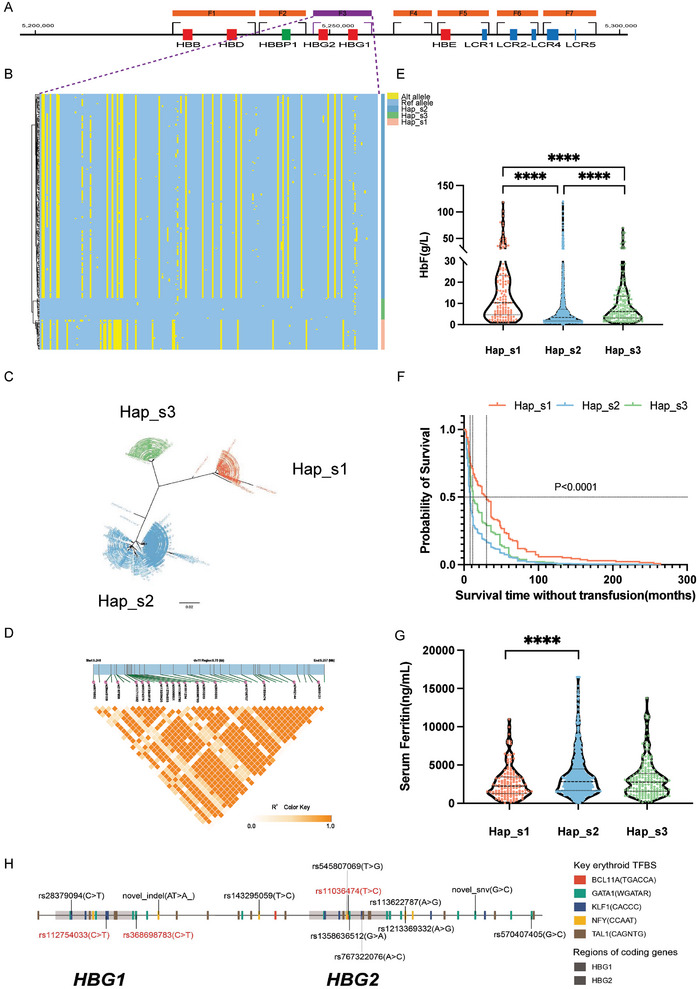
Despite the well-documented mutation spectra of β-thalassemia, the genetic variants and haplotypes of globin gene clusters modulating its clinical heterogeneity remain incompletely illustrated. Here, a targeted long-read sequencing (T-LRS) is demonstrated to capture 20 genes/loci in 1,020 β-thalassemia patients. This panel permits not only identification of thalassemia mutations at 100% of sensitivity and specificity, but also detection of rare structural variants (SVs) and single nucleotide variants (SNVs) in modifier genes/loci. The highly homologous regions of α-/β-globin gene clusters are then phased and 3 novel haplotypes in HBG1/HBG2 region are reported in this population of β-thalassemia patients. Furthermore, one of the haplotypes is associated with ameliorated symptoms of β-thalassemia. Similarly, 5 major haplotypes are identified in HBA1/HBA2 homologous region while one of them is found highly linked with deletional α-thalassemia mutations. Finally, rare mutations in erythroid transcription factors in DNMT1 and KLF1 associated with increased expression of fetal hemoglobin and reduced transfusion dependencies are identified. This study presents the largest T-LRS study for β-thalassemia patients to date, facilitating precise clinical diagnosis and haplotype phasing of globin gene clusters.

Keywords: fetal hemoglobin; thalassemia; third‐generation sequencing.


Conflict of interest statement

The authors declare no conflict of interest.

Figures

Figure 1
Figure 1
Design of the PCR primers for the T‐LRS panel. A,B) Primers designed in the α‐globin (A) and β‐globin (B) gene loci. The purple primers were included in reaction 1 (upgraded CATSA assay) to cover SNVs/indels in HBA1, HBA2, HBB, and HBD genes, as well as common deletions in the gene loci. The black primers were designed to cover other core genes and regulatory elements in the α‐globin (A) and β‐globin (B) gene loci. C) Primer pair included in reaction 3 for the HBS1LMYB amplicon to cover HBS1LMYB intergenic polymorphism. D) Primer pair included in reaction 2 for the BCL11A amplicon located in the intron 2 of BCL11A. E) Primer pair included in reaction 3 for the KLF1 amplicon to cover the full‐length gene. F) Four primer pairs included in reaction 4 for the four CHD4 amplicons to cover the core exons and the majority of introns for CHD4.
Figure 2
Figure 2
The overall flowchart of this study. The target region is composed of 8 globin genes (HBA1, HBA2, HBB, HBD, HBG1, HBG2, HBZ, HBE), 10 modifier genes (BCL11A, KLF1, GATA1, GATAD2A, ZBTB7A, DNMT1, CHD4, KLF3, KLF8, and SIRT1) and 3 cis‐elements (HS‐40 in α‐globin gene cluster, LCR in β‐globin gene cluster and the intergenic polymorphisms in MYB‐HBS1L). 100 samples with pre‐typed genotypes of thalassemia were recruited to test this panel with their detailed genotypes presented in Supplemental File S3. 1020 β‐thalassemia patients were then recruited for the evaluation of capability performance of this panel, from which the long‐sequencing read data were applied for variant detection, haplotypic phasing, and association studies.
Figure 3
Figure 3
Integrative Genomics Viewer (IGV) plots displaying the long CCS reads of T‐LRS for representative samples. A) IGV plots displaying the detection of variants in HBA2 (c.369C > G, c.377T > C, and c.427T > C) and HBA1 (c.84G > T, and c.364G > A). B) IGV plots displaying the detection of deletions (−α4.2 and −α3.7), duplications (ααα4.2 and ααα3.7), and structural rearrangements (HKαα) caused by unequal crossover in the α‐globin locus. The exact deletion regions of −α4.2 and −α3.7 were annotated according to IthaID 301 and 300, respectively. C) IGV plots displaying the detection of large deletions including –SEA, –THAI, and –FIL in the α‐globin locus. D) IGV plots displaying the detection of variants in HBB (c.52A > T, c.126_129del, c.165_177del, c.216_217insA, and c.316–197C > T) and HBD (c.−127T > C). E) IGV plots displaying the detection of large deletions including Taiwanese deletion, Hb Lepore, SEA‐HPFH, and Chinese Gγ + (Aγδβ)0 in the β‐globin locus. F) IGV plots displaying the detection the rs10128556 and rs2071348, as well as cis‐configuration of the two variants in HBBP1. G) IGV plot displaying the detection and cis‐configuration of reported modifying SNPs in HBS1LMYB intergenic region. H) IGV plot displaying the detection and cis‐configuration of reported modifying SNPs in intron 2 of BCL11A. I) IGV plot displaying the detection of the heterozygous variant KLF1: c.544T > C. J) IGV plot displaying the CCS reads of four CHD4 amplicons. LRS could determine the phasing inside one amplicon, but could not determine the phasing among different amplicons.
Figure 4
Figure 4
T‐LRS enabled precise variant calling and haplotype construction of the highly homologous regions in the α‐ and γ‐globin genes. A) Diagram showing the two 4 kb homologous units, design of primers, variant calling and haplotype construction based on heterozygous variants in the α‐globin genes. B) IGV plots displaying representative samples that had the variant c.369C > G in both HBA1 and HBA2 genes. C) Diagram showing the highly homologous regions, design of primers, variant calling and haplotype construction based on heterozygous variants in the γ‐globin genes. D) IGV plots displaying the detection of HBG1: c.−29G > A (blue box) and HBG2: g.−158C > T (orange box), as well as cis‐configuration of the two variants in γ‐globin gene loci. The blue box highlighted the conversion of HBG1 to HBG2 in the region encompassing promoter to intron 2. E) IGV plots displaying the 4.9 kb deletion between HBG1 and HBG2, as well as the breakpoints identified by T‐LRS.
Figure 5
Figure 5
The effects of rare missense mutations in KLF1 and DNMT1 on the clinical severity of β‐thalassemia patients. A–C) The differences in the levels of HbF, survival time without transfusion and serum ferritin among the β‐thalassemia patients with different genotypes of rs137852688 in KLF1. D–F) The differences in the levels of HbF, survival time without transfusion and serum ferritin among the β‐thalassemia patients with different genotypes of rs1381758934 in DNMT1. G,H) The impact of the missense mutations in KLF1 and DNMT1 on protein structures modeled by Swiss‐prot and visualized in Pymol. The abbreviation of protein domains presented in Figure 5G,H were listed as below: DMAP: DMAP_binding; FRD: Cytosine specific DNA methyltransferase replication foci domain; CXXC: CXXC zinc finger domain; BAH1: Bromo adjacent homology (BAH) domain; BAH2: Bromo adjacent homology (BAH) domain; MeTfrase: C‐5 cytosine methyltransferase; EKLF1: Erythroid krueppel‐like transcription factor, transactivation 1; EKLF2: Erythroid krueppel‐like transcription factor, transactivation 2; Znf1: Zinc finger C2H2‐type domain; Znf2: Zinc finger C2H2‐type domain; Znf3: Zinc finger C2H2‐type domain. The levels of p values for the evaluation of statistical differences between the two groups were marked by asterisk. “*” means p < 0.05; “**” means p < 0.01; “***” means p < 0.001; “****” means p < 0.0001.
Figure 6
Figure 6
The general haplotypes of HBG1/HBG2 regions and their phenotypic effects in the cohort of 1020 β‐thalassemia patients. (A) The diagram of seven fragments in the β‐globin gene cluster designed for long‐read sequencing in the T‐LRS panel. Among them, F3 covering the regions of HBG1 and HBG2 was highlighted by dotted purple lines to further show the unique haplotypes of the cohort in this fragment; (B) A heatmap displaying the haplotypes of the HBG1/HBG2 haplotypes identified from 1020 β‐thalassemia patients. A total of 249 SNVs were identified from the 1020 β‐thalassemia patients in this region. Each row represents one haplotype while the 249 grids in each row, marked in either blue or red, denote the allele information in corresponding position. The blue color stands for a reference allele in this locus while the red stands for alteration allele. A total of 209 unique haplotypes were identified and these haplotypes were clustered into 3 main groups as shown in this figure; (C) The overview of the tree clustering results of the redundant 2040 HBG1/HBG2 haplotypes in the patient population; (D) The LD block showing the linkage disequilibrium of the variants within the HBG1/HBG2 genomic regions. The deeper color in each cell indicated higher R2 values, which means higher linkage extent between the two variants of interest; (E‐G) The effects of the three major haplotypes in the β‐thalassemia patients on the expression levels of HbF (E), the transfusion‐free survival time (F) and the levels of serum ferritin (G); H) A diagram showing the SNVs in the HBG1‐HBG2 regions which potentially altered the transcription factor binding of 5 key erythroid regulators, namely KLF1, BCL11A, GATA1, NFY, TAL1. The consensus binding motifs of each TFs were shown on the right and their potential binding positions were highlighted in different colors on the horizontal bar standing for genomic region of HBG1 and HBG2. 13 SNVs marked on this bar, which were identified as statistically significant with the expression of HbF, were predicted to alter the transcription binding of one of the 5 specific regulators mentioned above.

Similar articles

References

    1. Muncie H. L. Jr., Campbell J., Am. Fam. Physician 2009, 80, 339. - PubMed
    1. Kattamis A., Kwiatkowski J. L., Aydinok Y., Lancet 2022, 399, 2310. - PubMed
    1. Cazzalo M., Blood 2022, 139, 2460. - PubMed
    1. Taher A. T., Saliba A. N., Hematology Am. Soc. Hematol. Educ. Program 2017, 2017, 265. - PMC - PubMed
    1. Muckenthaler M. U., Rivella S., Hentze M. W., Galy B., Cell 2017, 168, 344. - PMC - PubMed

LinkOut - more resources