. 2025 Feb;12(8):e2413389.
doi: 10.1002/advs.202413389. Epub 2024 Dec 31.

Ferritin-Based Supramolecular Assembly Drug Delivery System for Aminated Fullerene Derivatives to Enhance Tumor-Targeted Therapy

Affiliations

Ferritin-Based Supramolecular Assembly Drug Delivery System for Aminated Fullerene Derivatives to Enhance Tumor-Targeted Therapy

Baoli Zhang et al. Adv Sci (Weinh). 2025 Feb.

Abstract

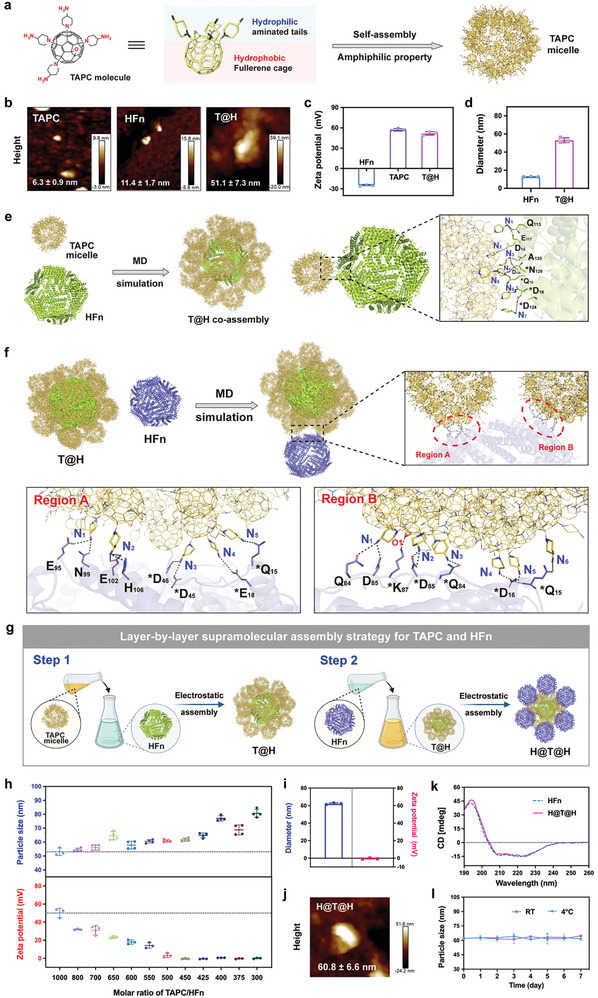
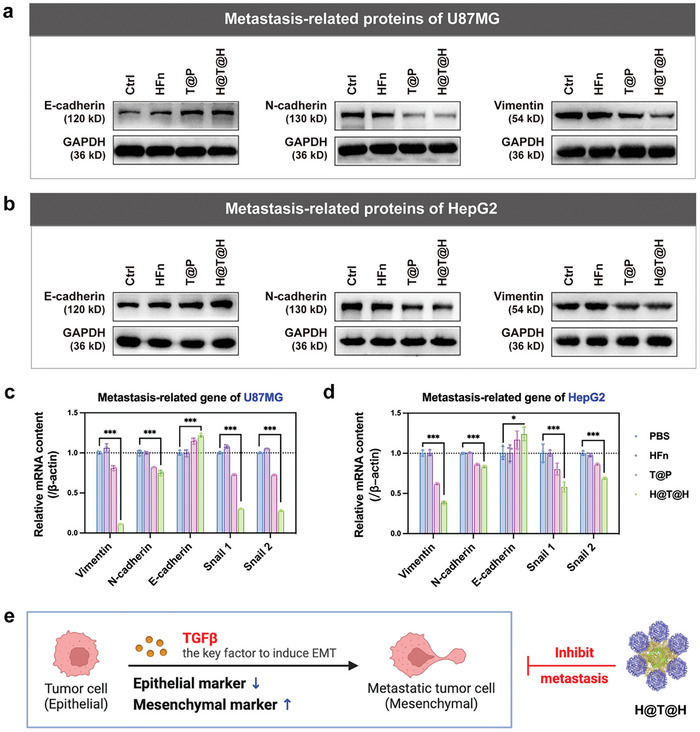
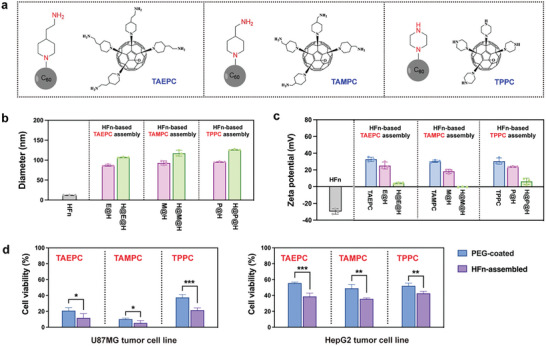
Owing to their attractive antitumor effects, aminated fullerene derivatives are emerging as promising therapeutic drugs for cancer. However, their in vivo applications are severely limited due to cation toxicity. To address this problem, human heavy chain ferritin (HFn), possessing natural biocompatibility is utilized, to develop a novel supramolecular assembly drug delivery system. Specifically, tetra[4-(amino)piperidin-1-yl]-C60 (TAPC) is selected as the representative aminated fullerene, and a layer-by-layer assembly strategy is designed to controllably assemble TAPC with the negatively charged HFn into a hierarchical coassembly (H@T@H) via electrostatic interactions and hydrogen bonds. In this ordered multilayer structure, the surface displayed HFn endows the inner TAPC with biocompatibility, tumor-targeting and blood-brain barrier crossing ability. Additionally, the electrostatic assembly mode enables the acid-responsive disassembly of H@T@H to release TAPC in lysosomes. In the orthotopic glioma mouse model, the HFn-assembled TAPC (H@T@H) shows higher brain accumulation and a stronger inhibitory effect on glioma than polyethylene glycol (PEG)-coated TAPC. Moreover, in an experimental metastasis mouse model, H@T@H have significant preventive and therapeutic effects on tumor metastasis. Encouragingly, the ferritin-based supramolecular assembly strategy has been proven to have broad applicability for various aminated fullerene derivatives, showing promising potential for tackling the in vivo delivery challenges of cationic drugs.

Keywords: aminated fullerene derivative; drug delivery system; ferritin; supramolecular assembly; tumor‐targeted therapy.


Conflict of interest statement

The authors declare no conflict of interest.

Figures

Figure 1
Figure 1
Schematic illustration of the ferritin‐based supramolecular assembly drug delivery system and its antitumor application. a) Construction of H@T@H via a simple two‐step method of LBL supramolecular assembly and the advantageous properties of the ordered multilayer structure. b) Relying on the outer layer of HFn, H@T@H can specifically recognize TfR1, the abnormally overexpressed receptor on tumor cells, to mediate endocytosis. After entering the cells, the acidic environment of lysosomes triggers the disassembly of H@T@H to release TAPC. c) H@T@H possesses tumor‐targeting and BBB‐crossing abilities and can effectively inhibit glioma progression and distant metastasis. The illustration was created with BioRender.com.
Figure 2
Figure 2
Investigation and evaluation of LBL supramolecular assembly between TAPC and HFn. a) Schematic diagram of the self‐assembly of amphiphilic TAPC molecules. b) Height signal maps of the HFn nanocage, TAPC micelle, and T@H coassembly were acquired from AFM. c) Characterization of the zeta potential (n = 4). d) Characterization of the particle size (n = 3). e) The final stable structure of the TAPC‐HFn coassembly obtained from the MD simulation (left). Analysis of the molecular binding modes between HFn nanocages and TAPC micelles (right). f) The final stable structure of the LBL assembly obtained from the MD simulation (above). Analysis of the molecular binding modes between HFn and T@H coassembly (below). As ferritin is a 24‐subunit protein, the two different subunits involved in the assembly are distinguished by asterisks. Abbreviations: Glutamic acid (Glu, E), Aspartic acid (Asp, D), Asparagine (Asn, N), Glutamine (Gln, Q), Alanine (Ala, A), Lysine (Lys, K), Histidine (His, H). g) Scheme of the two‐step method for LBL assembly of HFn‐TAPC. h) Investigating the changes in the particle size and zeta potential of the LBL assembly during the process of adding different amounts of HFn to T@H (n = 3–4). i) Hydrodynamic size and surface potential of H@T@H (n = 3). j) Height signal map of H@T@H acquired from AFM. k) CD spectra of HFn and H@T@H. l) Storage stability evaluation of H@T@H in solution. The H@T@H samples were placed at 4 ℃ or at room temperature (RT) for 7 days, and their particle sizes were detected by DLS (n = 3). All data are presented as mean ± SD.
Figure 3
Figure 3
Investigating the endocytosis behavior and intracellular acid‐responsive disassembly of H@T@H. a) Analysis of the TfR1 affinity of HFn and H@T@H (n = 3). Kd (the equilibrium dissociation constant: ligand concentration that binds to half the receptor sites at equilibrium) was calculated by GraphPad. b) CLSM images of the internalized H@T@H in U87MG cells pretreated with different endocytosis inhibitors, scale bar = 50 µm. c–e) Colocalization analysis of Cy5.5‐HFn (c) or Cy5‐TAPC (d) of H@T@H with acidic organelles (indicated by LysoTracker) via CLSM and the corresponding quantitative analysis of PCCs (e), n = 5. f–h) Colocalization analysis of Cy5.5‐HFn (f) or Cy5‐TAPC (g) of H@T@H with early endosomes (indicated by EEA1) via CLSM and the corresponding quantitative analysis of PCCs (h), n = 4–5. i–k) Colocalization analysis of Cy5.5‐HFn (i) or Cy5‐TAPC (j) of H@T@H with lysosomes (indicated by LAMP1) via CLSM and the corresponding quantitative analysis of PCCs (k), n = 5. Scale bar = 10 µm. All data are presented as mean ± SD.
Figure 4
Figure 4
In vitro evaluation of the antitumor activity of H@T@H. a) Comparison of the cytotoxicity of T@P and H@T@H to tumor cells (n = 4). A CCK‐8 assay was used to determine the viability of U87MG cells treated with different TAPC formulations for 48 h. b,c) Cell cycle distribution of U87MG cells treated with different TAPC formulations (b) and different TAPC concentrations of H@T@H (c) for 30 h, n = 3. d–g) WB analysis of pRB (d), CCND (e), CDK4 (f) and c‐Myc (g) protein expression in U87MG cells treated with different TAPC formulations and different TAPC concentrations of H@T@H for 48 h. h) RT‐qPCR evaluation of the G1‐S transition associated mRNA content in the U87MG cells treated with different TAPC formulations for 24 h (n = 3). i) Schematic diagram of the H@T@H‐mediated cell cycle G0/G1 arrest. All data are shown as mean ± SD. p‐values were calculated via one‐way ANOVA with Tukey's multiple comparisons test, *** p < 0.001, ns, not significant.
Figure 5
Figure 5
In vitro evaluation of the anti‐metastasis effect of H@T@H on various tumor cells. a,b) WB analysis of the expression of EMT‐associated proteins in U87MG (a) and HepG2 (b) cells treated with different TAPC formulations. c,d) RT‐qPCR analysis of the expression of metastasis‐associated mRNAs in U87MG (c) and HepG2 (d) cells treated with different TAPC formulations. Data are shown as mean ± SD (n = 3). p‐values were calculated via one‐way ANOVA with Tukey's multiple comparisons test, * p < 0.05, *** p < 0.001. e) Schematic diagram of the antitumor metastasis effect of H@T@H.
Figure 6
Figure 6
Evaluation of the in vivo distribution and antitumor efficacy of H@T@H in an orthotopic glioma model. a) Brain distribution of Cy5‐labeled T@P and H@T@H in orthotopic glioma‐bearing mice at different time points post‐administration. b) At 6 h after the administration of Cy5‐labeled T@P or H@T@H, the brain tissues of mice were dissected for ex vivo fluorescence imaging. c) Quantitative analysis of the accumulation of Cy5‐labeled T@P and H@T@H in the brains of mice. Data are shown as mean ± SD (n = 3). P‐values were calculated via unpaired two‐tailed Student's t‐test, * p < 0.05, ** p < 0.01, *** p < 0.001. d) Schematic diagram of the efficacy evaluation in the orthotopic glioma model. e) In vivo bioluminescence images of orthotopic glioma‐bearing mice in different treatment groups. f) Growth curves of U87MG‐Luc tumors in different treatment groups. Data are shown as mean ± SEM (n = 6). p‐values were calculated via one‐way ANOVA with Dunnett's multiple comparisons test by comparing the tumor luminescence of each group with that of the control (PBS group), * p < 0.05, ** p < 0.01, *** p < 0.001, ns: not significant. g) Body weight curves of mice in the different treatment groups. Data are shown as means ± SEM (n = 6). h) MRI of the brains in the different treated mice. i) Serum biochemical analysis of mice in different treatment groups. Data are shown as means ± SD (n = 4).
Figure 7
Figure 7
Evaluation of anti‐metastasis therapeutic efficacy. a) Schematic diagram of therapeutic efficacy evaluation in an experimental metastasis model of HepG2 cells. b) Representative photographs and panoramic scan images of H&E‐stained lung sections from mice subjected to different treatments. c) Number of lung metastatic nodules in each group. Data are shown as means ± SEM (n = 7). d) Body weight curves of the mice in each group. Data are shown as means ± SEM (n = 7). e–f) Secretion and activation of TGFβ in vivo. The serum concentrations of total TGFβ (e) and activated TGFβ (f) in each group were measured via ELISA. Data are shown as mean ± SD (n = 3). p‐values were calculated via one‐way ANOVA with Dunnett's multiple comparisons test, * p < 0.05, *** p < 0.001.
Figure 8
Figure 8
Investigation of the supramolecular assembly between HFn and different aminated fullerene derivatives. a) Molecular structures of different aminated fullerene derivatives, including TAEPC, TAMPC, and TPPC. b,c) Particle size (b) and zeta potential (c) of HFn‐based supramolecular assemblies with different aminated fullerenes (n = 3). d) Comparison of tumor cytotoxicity between the HFn‐assembled and PEG‐coated aminated fullerenes at the same concentration of TAPC. The viability of tumor cells was determined via a CCK‐8 assay after 24 h of different treatments. Data are shown as mean ± SD (n = 4). p‐values were calculated via unpaired two‐tailed Student's t‐test, * p < 0.05, ** p < 0.01, *** p < 0.001.

Similar articles

Cited by

References

    1. Fernandes N. B., Shenoy R. U. K., Kajampady M. K., CEM D. C., Shirodkar R. K., Kumar L., Verma R., Environ. Sci. Pollut. Res. Int. 2022, 29, 58607. - PMC - PubMed
    1. Injac R., Technol. Cancer Res. Treat. 2023, 22, 15330338231201515. - PMC - PubMed
    1. Chen Z., Ma L., Liu Y., Chen C., Theranostics. 2012, 2, 238. - PMC - PubMed
    1. Serda M., Malarz K., Mrozek‐Wilczkiewicz A., Wojtyniak M., Musioł R., Curley S. A., Sci. Rep. 2020, 10, 260. - PMC - PubMed
    1. Tang J., Chen Z., Sun B., Dong J., Liu J., Zhou H., Wang L., Bai R., Miao Q., Zhao Y., Chen C., Liu Y., Nanomedicine. 2016, 12, 945. - PubMed

LinkOut - more resources