. 2024 Dec 31:13:RP97654.
doi: 10.7554/eLife.97654.

Downregulation of semaphorin 4A in keratinocytes reflects the features of non-lesional psoriasis

Affiliations

Downregulation of semaphorin 4A in keratinocytes reflects the features of non-lesional psoriasis

Miki Kume et al. Elife. .

Abstract

Psoriasis is a multifactorial disorder mediated by IL-17-producing T cells, involving immune cells and skin-constituting cells. Semaphorin 4A (Sema4A), an immune semaphorin, is known to take part in T helper type 1/17 differentiation and activation. However, Sema4A is also crucial for maintaining peripheral tissue homeostasis and its involvement in skin remains unknown. Here, we revealed that while Sema4A expression was pronounced in psoriatic blood lymphocytes and monocytes, it was downregulated in the keratinocytes of both psoriatic lesions and non-lesions compared to controls. Imiquimod application induced more severe dermatitis in Sema4A knockout (KO) mice compared to wild-type (WT) mice. The naïve skin of Sema4A KO mice showed increased T cell infiltration and IL-17A expression along with thicker epidermis and distinct cytokeratin expression compared to WT mice, which are hallmarks of psoriatic non-lesions. Analysis of bone marrow chimeric mice suggested that Sema4A expression in keratinocytes plays a regulatory role in imiquimod-induced dermatitis. The epidermis of psoriatic non-lesion and Sema4A KO mice demonstrated mTOR complex 1 upregulation, and the application of mTOR inhibitors reversed the skewed expression of cytokeratins in Sema4A KO mice. Conclusively, Sema4A-mediated signaling cascades can be triggers for psoriasis and targets in the treatment and prevention of psoriasis.

Keywords: Sema4A; T cells; epidermis; human; immunology; inflammation; keratinocytes; mTOR signaling; mouse; psoriasis; resident memory T cells.


Conflict of interest statement

MK, HK, YM, AT, KY, YN, NO, MT, KT, TK, MW, AK, MF, RW No competing interests declared, SN, SM affiliated with Maruho Co. as an employee, but has declared no conflicts of interest related to this research

Figures

Figure 1.
Figure 1.. Epidermal Sema4A expression is downregulated in psoriasis.
(A) UMAP plots, generated from single-cell RNA-sequencing data (GSE220116), illustrate cell distributions from control (Ctl) and psoriatic lesion (L) samples (n=10 for Ctl, n=11 for L). (B) Subclustering of immune cells. (C) SEMA4A expression in keratinocytes, dendritic cells, and macrophages. ****padj<0.001. NS, not significant. Analyzed using Python and cellxgene VIP. (D) Representative immunohistochemistry and magnified views showing Sema4A expression in Ctl, psoriatic non-lesion (NL), and L. Scale bar = 50 μm. (E) Mean epidermal (Epi) Sema4A intensity in immunohistochemistry (n=10 per group). Each dot represents the average intensity from 5 unit areas per sample. (F) Relative SEMA4A expression in Epi (n=10 for Ctl, n=7 for L and NL) and dermis (Derm, n=6 per group). (G) Proportions of Sema4A-expressing cells in blood CD4 T cells (left), CD8 T cells (middle), and monocytes (right) from Ctl and psoriatic (Pso) patients (n=13 per group in CD4 and CD8, n=11 for Ctl and n=13 for Pso in monocytes). (H) Serum Sema4A levels in Ctl (n=20) and Pso (n=60). (E–H) *p<0.05, **p<0.01, ****p<0.0001. NS, not significant. The error bars represent the standard deviation.
Figure 1—figure supplement 1.
Figure 1—figure supplement 1.. Sema4A is downregulated in the keratinocytes of lesional psoriasis in the single-cell RNA-sequencing data.
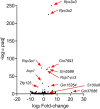
(A) Sample information for specimens from Ctl and psoriatic L (GSE220116). (B, C) Clusters of cells were identified by their expression patterns of signature genes. (D) The volcano plot displays changes in gene expression in psoriatic L compared to Ctl.
Figure 1—figure supplement 2.
Figure 1—figure supplement 2.. Gating strategy in flow cytometry.
Gating strategy for human Sema4A expression in blood cells. Large and small cells were distinguished using forward scatter (FCS) and side scatter (SSC) in a dot plot panel, with dead cells being excluded. Monocytes were defined within the live large cell population as CD11c positive. CD4 and CD8 T cells were identified within the live small cell population as CD3-positive CD4-positive and CD3-positive CD8-positive populations, respectively. The empty histogram represents the flow cytometry minus one control for Sema4A.
Figure 2.
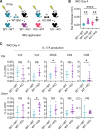
Figure 2.. Imiquimod (IMQ)-induced psoriasis-like dermatitis is augmented in Sema4A knockout (KO) mice.
(A) Experimental scheme. Wild-type (WT, green) mice and Sema4A KO (black) mice were treated with 10 mg/ear of 5% IMQ for 4 consecutive days. Samples for flow cytometry analysis were collected on day 4. (B) Ear thickness of WT mice and KO mice on day 4 (n=15 per group). (C) Relative expression of Il17a in epidermis (n=5 per group). (D, E) The percentages of Vγ3, Vγ2, Vγ2-Vγ3-γδ (DNγδ), CD4, and CD8 T cells (D) and those with IL-17A production (E) in CD3 fraction in the Epi (top) and Derm (bottom) of WT and KO ears (n=6 per group, each dot represents the average of 4 ear specimens). (F) The percentages of IL-17A-producing γδ, CD4, and CD8 T cells in CD3 fraction in skin-draining lymph nodes (dLN) (n=9 per group). (B–F) *p<0.05, **p<0.01, ****p<0.0001. NS, not significant. The error bars represent the standard deviation.
Figure 2—figure supplement 1.
Figure 2—figure supplement 1.. Gating strategy in flow cytometry.
Gating strategy for murine T cells infiltrating the epidermis and dermis. After excluding dead cells, TCRγδ-positive T cells were evaluated for the expression of Vγ2. TCRγδ-positive Vγ2-negative population was further assessed the expression of Vγ3. The CD3-positive TCRγδ-negative population was evaluated for the expression of CD4 and CD8. Each population was analyzed for cytokine production. The empty histogram represents the isotype control for IL-17A.
Figure 2—figure supplement 2.
Figure 2—figure supplement 2.. IL-23-mediated psoriasis-like dermatitis is augmented in Sema4A knockout (KO) mice.
(A) An experimental scheme involved intradermally injecting 20 μL of phosphate-buffered saline containing 500 ng of recombinant mouse IL-23 into both ears of wild-type (WT) mice and KO mice for 4 consecutive days. Samples for following analysis were collected on day 4. (B, C) Ear thickness (B) and Epi and Derm thickness (C) of WT mice and KO mice on day 4 (n=12 per group). (D, E) The percentages of Vγ3, Vγ2, DNγδ, CD4, and CD8 T cells (D) and those with IL-17A production (E) in CD3 fraction in the Epi (top) and Derm (bottom) of WT and KO ears (n=5 per group). Each dot represents the average of 4 ear specimens. (B–E) *p<0.05, **p<0.01. NS, not significant. The error bars represent the standard deviation.
Figure 3.
Figure 3.. Sema4A in keratinocytes may play a role in preventing murine psoriasis-like dermatitis.
(A) Experimental scheme for establishing BM chimeric mice. (B) Imiquimod (IMQ) day 4 ear thickness in the mice with the indicated genotypes (n=14 for WT→WT, n=13 for WT→KO, n=9 for KO→WT, n=9 for KO→KO). (C) The percentages of IL-17A-producing Vγ3, Vγ2, DNγδ, CD4, and CD8 T cells in CD3 fraction from IMQ day 4 Epi (top) and Derm (bottom) of the ears from WT→ WT mice and WT→ KO mice (n=6 per group). Each dot represents the average of 4 ear specimens. (B, C) *p<0.05, **p<0.01, ****p<0.0001. NS, not significant. The error bars represent the standard deviation.
Figure 3—figure supplement 1.
Figure 3—figure supplement 1.. T cells’ fractions infiltrating in the chimeric mice ear.
(A) Sema4a expression in the Epi of WT→ WT mice and WT→ KO mice (n=8 for WT→ WT, n=7 for WT→ KO). (B) The percentages of Vγ3, Vγ2, DNγδ, CD4, and CD8 T cells in CD3 fraction from imiquimod (IMQ) day 4 Epi (top) and Derm (bottom) of the ears from WT→ WT mice and WT→ KO mice (n=6 per group). Each dot represents the average of 4 ear specimens. (A, B) *p<0.05, ***p<0.001. NS, not significant. The error bars represent the standard deviation.
Figure 4.
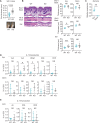
Figure 4.. Naïve Sema4A knockout (KO) epidermis is thicker than wild-type (WT) epidermis with increased γδ T17 infiltration.
(A) Ear thickness of WT mice and KO mice at week (Wk) 8 (n=15 per group) and representative images. (B) Left: representative hematoxylin and eosin staining of day 0 back and Wk 8 back and ear. Scale bar = 50 μm. Right: Epi and Derm thickness in day 0 back (n=5) and Wk 8 back (n=5) and ear (n=8). (C) Relative Sema4a expression in WT Epi and Derm (n=5 per group). (D) The percentages of the IL-17A-producing Vγ3, Vγ2, DNγδ, CD4, and CD8 T cells in CD3 fraction (n=4 per group) in Epi (top) and Derm (bottom). Each dot represents the average of 4 ear specimens. (E) The graphs showing the percentages of IL-17A-producing γδ, CD4, and CD8 T cells in CD3 fraction from draining LN (dLN) of WT mice and Sema4A KO mice (n=6 per group). (A–E) *p<0.05, **p<0.01, ****p<0.0001. NS, not significant. The error bars represent the standard deviation.
Figure 4—figure supplement 1.
Figure 4—figure supplement 1.. Naive Sema4A knockout (KO) skin shows upregulation of psoriasis-related genes and an increase in resident memory T cells.
(A) Relative expression of psoriasis-associated genes in Epi (top) and Derm (bottom) of wild-type (WT) mice and KO mice (n=5 per group, #: not detected). (B) Representative dot plots showing CD69 and CD103 expression in the indicated T cell fractions from whole skin. The graphs show T cell counts per ear (top) and those with resident memory phenotype (bottom) (n=7 per group). Each dot represents the average of 4 ear specimens. (A, B) *p<0.05, **p<0.01. NS, not significant. The error bars represent the standard deviation.
Figure 4—figure supplement 2.
Figure 4—figure supplement 2.. Expression of IFNγ and IL-4 is comparable between naive wild-type (WT) and Sema4A knockout (KO) skin.
(A) The percentages of Vγ3, Vγ2, DNγδ, CD4, and CD8 T cells in CD3 fraction from naive WT and KO mice. (B, C) The graphs presenting the percentages of IFNγ (B) and IL-4 (C) -producing Vγ2, DNγδ, CD4, and CD8 T cells in CD3 fraction in the Epi (top) and Derm (bottom) of naive WT mice and KO mice (n=4 per group). (A–C) Each dot represents the average of 4 ear specimens. *p<0.05. NS, not significant. The error bars represent the standard deviation.
Figure 4—figure supplement 3.
Figure 4—figure supplement 3.. Comparable T17 differentiation potential under Th17-skewing conditions between wild-type (WT) mice and Sema4A knockout (KO) mice.
Splenic T cells were cultured for 2 weeks, followed by flow cytometry analysis. The accumulated data display the percentages of IL-17A-producing (right) and IFNγ-producing (left) γδ, CD4, and CD8 T cells within CD3 fraction under various conditions: IL-23-dependent Th17-skewing condition (top), IL-23 only Th17-skewing condition (middle), and IL-23-independent Th17-skewing condition (bottom). NS, not significant. The error bars represent the standard deviation.
Figure 5.
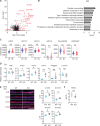
Figure 5.. Sema4A knockout (KO) skin shares the features of human psoriatic non-lesions (NL).
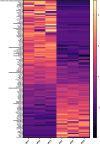
(A, B) The volcano plot (A) and Gene Ontology (GO) analysis (B), generated from RNA-sequencing data (GSE121212) using RaNAseq, display changes in gene expression in psoriatic NL compared to Ctl. (C) The difference in the expression of epidermal differentiation markers between Ctl and NL (n=38 for Ctl, n=27 for NL) was calculated with the transcripts per million values. **padj<0.01. NS, not significant. The error bars represent the standard deviation. (D) Relative gene expression of epidermal differentiation markers between wk 8 Epi of wild-type (WT) mice and KO mice (n=5 for Krt14 and Krt16, n=8 for Krt5, Krt10, Filaggrin, and Loricrin). (E) Left: Representative immunofluorescence pictures of Krt5, Krt10, Krt14, and Krt16 (red) overlapped with DAPI. Scale bar = 50 μm. Right: Accumulated graphs showing the numbers of Krt5, Krt10, Krt14, and Krt16 positive cells per 100 μm width (n=5 per group) of wk 8 ear (right). Each dot represents the average from 5 unit areas per sample. (F) Transepidermal water loss (TEWL) in back skin of WT mice and KO mice at wk 8 (n=5 per group). (D–F) *p<0.05, **p<0.01. NS, not significant. The error bars represent the standard deviation.
Figure 5—figure supplement 1.
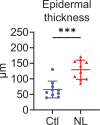
Figure 5—figure supplement 1.. The epidermis of psoriatic non-lesion is thicker than that of control skin.
Epidermal thickness of Ctl and psoriatic non-lesions (NL) (n=10 per group). ***p<0.001. The error bars represent the standard deviation.
Figure 5—figure supplement 2.
Figure 5—figure supplement 2.. Upregulation of cytokeratin expression related to psoriasis is not detected at birth in Sema4A knockout (KO) mice.
Representative immunofluorescence pictures of Krt5, Krt10, Krt14, and Krt16 (red) overlapped with DAPI, and the accumulated graphs showing the numbers of Krt5, Krt10, Krt14, and Krt16 positive cells per 100 μm width (n=5 per group) in the epidermis of day 0 back. Scale bar = 50 μm. Each dot represents the average from 5 unit areas per sample. NS, not significant. The error bars represent the standard deviation.
Figure 6.
Figure 6.. mTOR signaling is upregulated in the epidermis of psoriatic non-lesions (NL) and Sema4A knockout (KO) mice.
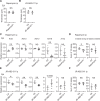
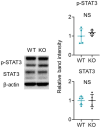
(A) Representative results of immunohistochemistry displaying cells positive for phospho-S6 (p-S6) (Ser235/236), S6, phospho-Akt (p-Akt) (Ser473), and Akt in Ctl, NL, and L. The graphs of accumulated data show the mean intensity of p-S6 and S6 in the upper and lower epidermal layers (n=9 per group). Scale bar = 100 μm. Each dot represents the average mean intensity from 5 unit areas per sample. (B) The mean intensity of p-S6 (Ser235/236) and p-Akt (Ser473), detected by immunohistochemistry in the epidermis of wild-type (WT) mice and KO mice, were analyzed. Scale bar = 50 μm. Each dot represents the average intensity from 5 unit areas per sample (n=8 per group). (C, D) Immunoblotting of p-S6 (Ser235/236), S6, p-Akt (Ser473), and Akt in tissue lysates from epidermis without treatment (C) and with imiquimod (IMQ) treatment for consecutive 4 days (D) (n=5 per group, except for p-Akt and Akt in C, for which n=4). (A–D) *p<0.05, **p<0.01. NS, not significant. The error bars represent the standard deviation.
Figure 7.
Figure 7.. Inhibitors of mTOR signaling modulate the expression of cytokeratins in Sema4A knockout (KO) mice.
(A, B) Epidermal thickness of Sema4A KO mice treated intraperitoneally with vehicle (Ctl) or rapamycin (A), and Ctl or JR-AB2-011 (B) (n=5 per group). (C, D) Relative expression of keratinocyte differentiation markers and Il17a in Sema4A KO Epi (C), and the number of T cells in Epi and Derm under Ctl or rapamycin (D) (n=5 per group). (E, F) Relative expression of keratinocyte differentiation markers and Il17a in Sema4A KO Epi (E), and the number of T cells in Epi and Derm under Ctl or JR-AB2-011 (F) (n=5 per group). (D and F) Each dot represents the sum of numbers from 10 unit areas across 3 specimens. (A–F) *p<0.05, **p<0.01. NS, not significant. The error bars represent the standard deviation.
Figure 7—figure supplement 1.
Figure 7—figure supplement 1.. Topical application of rapamycin gel yields partially similar results to intraperitoneal treatment.
(A) Comparison of Epi thickness between vehicle (Ctl) gel-treated right ears and rapamycin gel-treated left ears of Sema4A knockout (KO) mice (n=10 per group). (B) Relative expression of keratinocyte differentiation markers and Il17a in Sema4A KO Epi under Ctl gel or rapamycin gel treatments (n=5 per group). (C) The number of T cells in the Epi (left) and Derm (right), under Ctl gel or rapamycin gel treatments (n=5 per group). Each dot represents the sum of numbers from 10 unit areas across 3 specimens. (A–C) *p<0.05, **p<0.01. NS, not significant. The error bars represent the standard deviation.
Figure 7—figure supplement 2.
Figure 7—figure supplement 2.. Rapamycin treatment reduced the epidermal swelling observed in imiquimod (IMQ)-treated Sema4A knockout (KO) mice.
(A) Experimental scheme. (B) The Epi thickness on day 18 (n=10 for Ctl, n=12 for rapamycin). (C) Relative expression of keratinocyte differentiation markers and Il17a in Sema4A KO Epi (n=10 for Ctl, n=12 for rapamycin). (D) The number of T cells in the Epi (left) and Derm (right), under Ctl or rapamycin and IMQ treatments (n=10 for Ctl, n=12 for rapamycin). Each dot represents the sum of numbers from 10 unit areas across 3 specimens. (A–C) *p<0.05, **p<0.01. NS, not significant. The error bars represent the standard deviation.
Author response image 1.
Author response image 2.
Author response image 3.
Author response image 4.

Update of

  • doi: 10.1101/2024.04.02.587777
  • doi: 10.7554/eLife.97654.1
  • doi: 10.7554/eLife.97654.2

References

    1. Arasa J, Terencio MC, Andrés RM, Marín-Castejón A, Valcuende-Cavero F, Payá M, Montesinos MC. Defective induction of COX-2 expression by psoriatic fibroblasts promotes pro-inflammatory activation of macrophages. Frontiers in Immunology. 2019;10:536. doi: 10.3389/fimmu.2019.00536. - DOI - PMC - PubMed
    1. Asrani K, Sood A, Torres A, Georgess D, Phatak P, Kaur H, Dubin A, Talbot CC, Jr, Elhelu L, Ewald AJ, Xiao B, Worley P, Lotan TL. mTORC1 loss impairs epidermal adhesion via TGF-β/Rho kinase activation. The Journal of Clinical Investigation. 2017;127:4001–4017. doi: 10.1172/JCI92893. - DOI - PMC - PubMed
    1. Buerger C. Epidermal mTORC1 signaling contributes to the pathogenesis of psoriasis and could serve as a therapeutic target. Frontiers in Immunology. 2018;9:2786. doi: 10.3389/fimmu.2018.02786. - DOI - PMC - PubMed
    1. Bürger C, Shirsath N, Lang V, Diehl S, Kaufmann R, Weigert A, Han Y-Y, Ringel C, Wolf P. Blocking mTOR signalling with rapamycin ameliorates imiquimod-induced psoriasis in mice. Acta Dermato-Venereologica. 2017;97:1087–1094. doi: 10.2340/00015555-2724. - DOI - PubMed
    1. Carvalheiro T, Affandi AJ, Malvar-Fernández B, Dullemond I, Cossu M, Ottria A, Mertens JS, Giovannone B, Bonte-Mineur F, Kok MR, Marut W, Reedquist KA, Radstake TR, García S. Induction of inflammation and fibrosis by semaphorin 4A in systemic sclerosis. Arthritis & Rheumatology. 2019;71:1711–1722. doi: 10.1002/art.40915. - DOI - PMC - PubMed

Associated data