. 2025 Feb;12(8):e2411943.
doi: 10.1002/advs.202411943. Epub 2024 Dec 31.

Aldehyde Dehydrogenase 2 Lactylation Aggravates Mitochondrial Dysfunction by Disrupting PHB2 Mediated Mitophagy in Acute Kidney Injury

Affiliations

Aldehyde Dehydrogenase 2 Lactylation Aggravates Mitochondrial Dysfunction by Disrupting PHB2 Mediated Mitophagy in Acute Kidney Injury

Jiaying Li et al. Adv Sci (Weinh). 2025 Feb.

Abstract

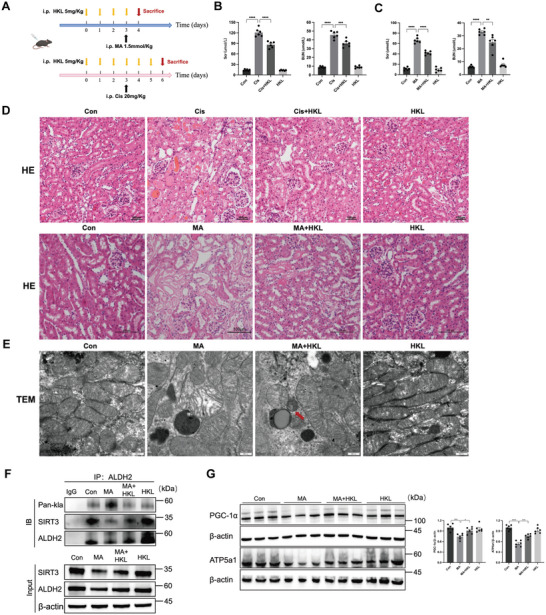
Mitochondrial dysfunction is a crucial event in acute kidney injury (AKI), leading to a metabolic shift toward glycolysis and increased lactate production. Lactylation, a posttranslational modification derived from lactate, plays a significant role in various cellular processes, yet its implications in AKI remain underexplored. Here, a marked increase in lactate levels and pan-Kla levels are observed in kidney tissue from AKI patients and mice, with pronounced lactylation activity in injured proximal tubular cells identified by single-cell RNA sequencing. The lactylation of aldehyde dehydrogenase 2 (ALDH2) is identified at lysine 52 (K52la), revealing that ALDH2 lactylation exacerbates tubular injury and mitochondrial dysfunction. Conversely, the ALDH2 K52R mutation alleviates these injuries in HK-2 cells and adeno-associated virus-infected kidney tissues in mice. Furthermore, ALDH2 lactylation can be modulated by upregulating SIRT3 in vivo and in vitro, which reduces ALDH2 lactylation, mitigating tubular injury and mitochondrial dysfunction. Mechanistically, immunoprecipitation-mass spectrometry analysis demonstrates an interaction between ALDH2 and prohibitin 2 (PHB2), a crucial mitophagy receptor. ALDH2 lactylation promotes the ubiquitination-proteasomal degradation of PHB2 to inhibit mitophagy and worsen mitochondrial dysfunction. These findings highlight the critical role of endogenous lactate in AKI and propose ALDH2 lactylation as a potential therapeutic target.

Keywords: ALHD2; acute kidney injury; lactylation; mitochondrial function; mitophagy.


Conflict of interest statement

The authors declare no conflict of interest.

Figures

Figure 1
Figure 1
Correlation between elevated lactate levels and renal function decline in AKI patients and mice. A,B) The serum and urinary lactate levels were measured in control and AKI patients (n = 12). C) Correlation analysis between GFR and serum lactate levels in AKI patients. D) Schematic diagram of the cisplatin and MA‐AKI mice model. E) Serum creatinine (Scr) and urea nitrogen (BUN) levels in the Con, Cis‐AKI and MA‐AKI groups (n = 6). F,G) The gene set enrichment analysis (GSEA) and heatmap for differentially expressed genes (DEGs) from mRNA sequencing in Con and MA groups. H) The protein expression of aerobic glycolysis‐related enzymes (HK2, PFKFB3, and PKM2) was measured by Western blotting (n = 6). I) The lactate levels in serum, urine, and kidney tissues were measured in the Con, Cis‐AKI and MA‐AKI groups (n = 6). J) Correlation analysis between urinary lactate concentration and Scr in AKI mice. Unpaired student's t‐test, one‐way ANOVA and linear regression were used for the analysis. * P < 0.05, ** P < 0.01, *** P < 0.001, **** P < 0.0001. (AKI, acute kidney injury; Con, control; Cis‐AKI, cisplatin‐induced AKI; MA‐AKI, maleic acid‐induced AKI).
Figure 2
Figure 2
Inhibition of lactate production mitigated cisplatin and MA‐induced renal injury and mitochondrial dysfunction. A,B) Schematic diagram illustrating the mechanisms of inhibition of lactate production by 2‐DG and oxamate in vivo, and the experimental design of drug treatment for cisplatin‐ and MA‐AKI mice. C) Scr and BUN levels in 2‐DG and oxamate‐treated AKI mice (n = 6). D) Images of hematoxylin‐eosin (HE) staining (n = 6). Scale bars, 100µm. E) The expression of mitochondria‐related proteins (PGC‐1α, ATP5a1, and ALDH2) was measured by Western blotting (n = 6). F) The lactate levels in serum and urine were measured in oxamate‐pretreated MA‐AKI mice (n = 6). G) The levels of pan‐lactylation (Pan‐Kla) were measured by Western blotting (n = 6). One‐way ANOVA was used for the analysis. * P < 0.05, ** P < 0.01, *** P < 0.001, **** P < 0.0001. (Con, control; MA, maleic acid; 2‐DG, 2‐Deoxy‐D‐glucose; Oxa, oxamate; MA‐AKI, maleic acid‐induced AKI).
Figure 3
Figure 3
Association between renal lactylation and proximal tubular injury in MA‐AKI mice. A) UMAP plot visualization for all cell types of single‐cell sequencing. B,C) Glycolysis activity in different cell types and groups. D) UMAP plot visualization for PTCs clusters. E,F) Lactylation activity in different PTCs and groups. G,H) Levels and quantifications of Pan‐Kla in renal biopsy specimens from individuals with AKI and control participants detected by IHC staining. Scale bars, 100 µm (upper panels) and 50 µm (lower panels). Unpaired student's t‐test was used for the analysis. **** P < 0.0001. (Con, control; MA, maleic acid; MA‐AKI, maleic acid‐induced AKI; PTCs, proximal tubule cells).
Figure 4
Figure 4
The lactylation of ALDH2 in AKI was crucial in regulating mitochondrial function. A,B) ALDH2 lactylation was increased in MA and lactate‐stimulated HK‐2 cells. C) Illustration of possible lactylation sites of ALDH2 analyzed via immunoprecipitation (IP)‐mass spectrometry (MS) analysis. D) The sequences around ALDH2 K52 were conserved from different mammalian species. Conserved lysine residues were marked in red. E) ALDH2 lactylation and acetylation levels in different groups were measured by Western blotting (n = 3). F) Cycloheximide (CHX) chase assay for the half‐time life of ALDH2 in HK‐2 cells treated with CHX (100 µg ml−1) for the indicated time points (n = 3). G) ALDH2 activity was measured in the WT and K52R groups with equal amounts of protein (n = 3). H) The expression of mitochondria‐related proteins (PGC‐1α and ATP5a1) was measured by Western blotting (n = 3). I) Measurement of mitochondrial oxygen consumption ratio (OCR) in different groups (n = 9–11 for each group). Unpaired student's t‐test and two‐way ANOVA were used for the analysis. * P < 0.05, ** P < 0.01, *** P < 0.001, **** P < 0.0001. (Con, control; MA, maleic acid; LA, lactate; WT, wild type; CHX, cycloheximide; OCR, oxygen consumption ratio; Oligo, oligomycin; ROT+AA, rotenone/antimycin A).
Figure 5
Figure 5
The effect of AAV‐ALDH2‐K54R on ALDH2 lactylation, renal injury, and mitochondrial dysfunction in MA‐induced AKI mice. Mice were initially injected with AAV9‐ALDH2‐EGFP or AAV9‐ALDH2‐K54R‐EGFP into the renal pelvis, followed 28 days later by a single MA injection. A) The flowchart of mice modeling. B) Fluorescence images of AAV‐EGFP in cryopreserved kidney tissue sections were used to assess AAV infectivity. Scale bars, 100µm. C) Serum creatinine (Scr) and urea nitrogen (BUN) levels in different groups (n = 6). D) Images of hematoxylin‐eosin (HE) staining (n = 6). Scale bars, 100µm. E) Representative transmission electron microscopy (TEM) micrographs of mouse renal tubular epithelial cell mitochondria in each group. Scale bars, 0 .5µm. F) The levels of pan‐lactylation (Pan‐Kla) protein were measured by Western blotting (n = 3). G) The expression of ALDH2 and NGAL was measured by Western blotting (n = 6). H) The expression of mitochondria‐related proteins (PGC‐1α and ATP5a1) was measured by Western blotting (n = 6). Two‐way ANOVA was used for the analysis. * P < 0.05, ** P < 0.01, *** P < 0.001, **** P < 0.0001. (Con, control; MA, maleic acid; AAV, adeno‐associated viruses; NC, normal control).
Figure 6
Figure 6
SIRT3 served as a lactylation eraser and affected the lactylation of ALDH2. A) The levels of pan‐lactylation (Pan‐Kla) protein and SIRT3 in MA and lactate‐stimulated HK‐2 cells (n = 3). B) Co‐immunoprecipitation assay showed the interaction of ALDH2 with SIRT3 (not Sirt1) in HK‐2 cells (n = 3). Input immunoblotted is shown as a control. C) Immunofluorescent analysis of the location of ALDH2 and SIRT3 in HK‐2 cells (n = 3). D) The level of ALDH2 lactylation was measured by Western blotting in SIRT3‐overexpressing HK‐2 cells (n = 3). E) The expression of mitochondria‐related proteins (PGC‐1α and ATP5a1) was measured by Western blotting in SIRT3‐overexpressing HK‐2 cells (n = 3). F) Measurement of mitochondrial oxygen consumption ratio (OCR) in SIRT3‐overexpressing HK‐2 cells (n = 8). One‐way and two‐way ANOVA were used for the analysis. * P < 0.05, ** P < 0.01, *** P < 0.001, **** P < 0.0001. (Con, control; MA, maleic acid; LA, lactate; NC, normal control; OE, overexpression; OCR, oxygen consumption ratio; Oligo, oligomycin; ROT+AA, rotenone/antimycin A).
Figure 7
Figure 7
SIRT3 activation attenuated renal injury and mitochondrial dysfunction in cisplatin and MA‐induced AKI. A) Honokiol (SIRT3 activator, 5 mg k−1g) was injected intraperitoneally (i.p.) for three days before the injection of ciplatin and MA. B,C) Serum creatinine (Scr) and urea nitrogen (BUN) levels in cisplatin‐ and MA‐AKI mice (n = 6). D) Images of hematoxylin‐eosin (HE) staining (n = 6). Scale bars, 100µm. E) Representative transmission electron microscopy (TEM) micrographs of mouse renal tubular epithelial cell mitochondria in each group. The red arrow showed autophagosomes. Scale bars, 0 .5µm. F) The level of ALDH2 lactylation was measured by Western blotting (n = 6). G) The expression of mitochondria‐related proteins (PGC‐1α and ATP5a1) was measured by Western blotting (n = 6). One‐way ANOVA was used for the analysis. * P < 0.05, ** P < 0.01, *** P < 0.001, **** P < 0.0001. (Con, control; MA, maleic acid; HKL, honokiol).
Figure 8
Figure 8
ALDH2 K52 lactylation reduced ALDH2‐PHB2 interaction and inhibited mitophagy. A) Schematic diagram illustrating the immunoprecipitation (IP) ‐mass spectrometry (MS) analysis for the detecting of proteins interacting with ALDH2. B) Co‐immunoprecipitation assay showed the interaction of ALDH2 with PHB2 in HK‐2 cells (n = 3). Input immunoblotted is shown as a control. C) Immunofluorescent analysis of the location of ALDH2 and PHB2 in HK‐2 cells (n = 3). D) In HK‐2 cells transfected with ALDH2‐WT and ALDH2‐K52R plasmids, the expression of ALDH2 and PHB2 was measured by Western blotting (n = 3). E) Cycloheximide (CHX) chase assay for PHB2 in HK‐2 cells treated with CHX (100 µg ml−1) for the indicated time points (n = 3). F) The expression of PHB2 in HK‐2 cells treated with 10µM CQ or 10µM MG132 for 6 h (n = 3). G) Co‐immunoprecipitation assay for the ubiquitination of PHB2 in HEK‐293T cells transfected with HA‐tagged ubiquitin, ALDH2‐WT, and ALDH2‐K52R plasmids (n = 3). H) The localization of LC3B and mitochondria was analyzed by immunofluorescence staining in different groups. Scale bars, 10µm. I) The expression of mitophagy‐related proteins (Pink1, Parkin, LC3B and P62) was measured by Western blotting (n = 3). Unpaired student's t‐test and two‐way ANOVA were used for the analysis. * P < 0.05, ** P < 0.01, *** P < 0.001, **** P < 0.0001. (Con, control; MA, maleic acid; CQ, chloroquine; DMSO, dimethyl sulfoxide; CHX, cycloheximide; Ub, ubiquitination).

References

    1. Hoste E. A. J., Kellum J. A., Selby N. M., Zarbock A., Palevsky P. M., Bagshaw S. M., Goldstein S. L., Cerdá J., Chawla L. S., Nat. Rev. Nephrol. 2018, 14, 607. - PubMed
    1. Zhang X., Agborbesong E., Li X., Int. J. Mol. Sci. 2021, 22, 11253. - PMC - PubMed
    1. Liu J., Min J., Lu J., Zhong L., Luo H., Ren. Fail. 2024, 46, 2374451. - PMC - PubMed
    1. Zhang D., Tang Z., Huang H., Zhou G., Cui C., Weng Y., Liu W., Kim S., Lee S., Perez‐Neut M., Ding J., Czyz D., Hu R., Ye Z., He M., Zheng Y. G., Shuman H. A., Dai L., Ren B., Roeder R. G., Becker L., Zhao Y., Nature 2019, 574, 575. - PMC - PubMed
    1. Li L., Sun S., Wu Y., Lu J., He J., Chen K., Chan W.‐Y., Liu X., Sci. Bull. 2023, 68, 2510. - PubMed

LinkOut - more resources