. 2024 Dec 30;14(1):507.
doi: 10.1038/s41398-024-03212-3.

Reconfiguration of brain network dynamics in bipolar disorder: a hidden Markov model approach

Affiliations

Reconfiguration of brain network dynamics in bipolar disorder: a hidden Markov model approach

Xi Zhang et al. Transl Psychiatry. .

Abstract

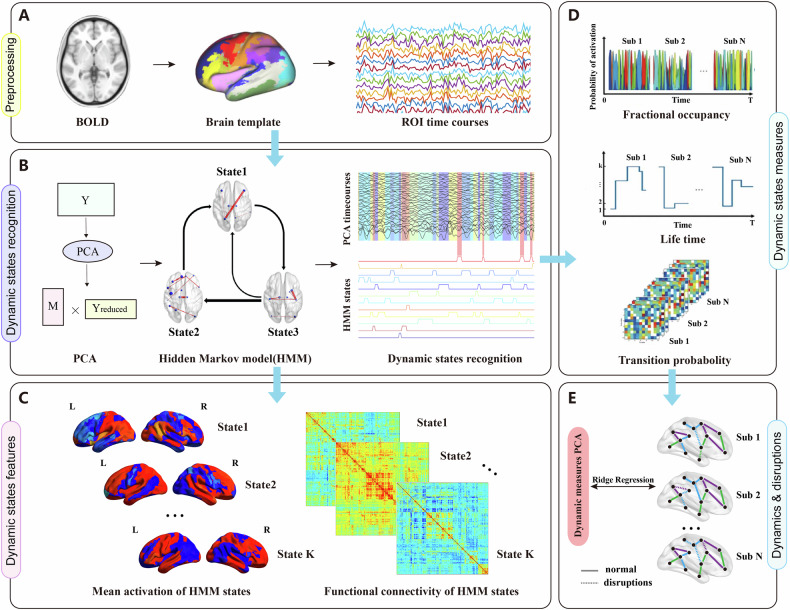
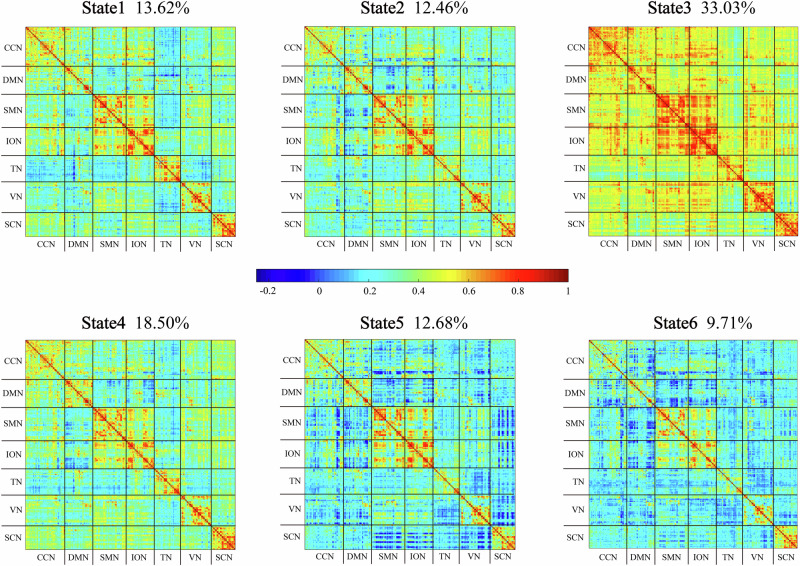
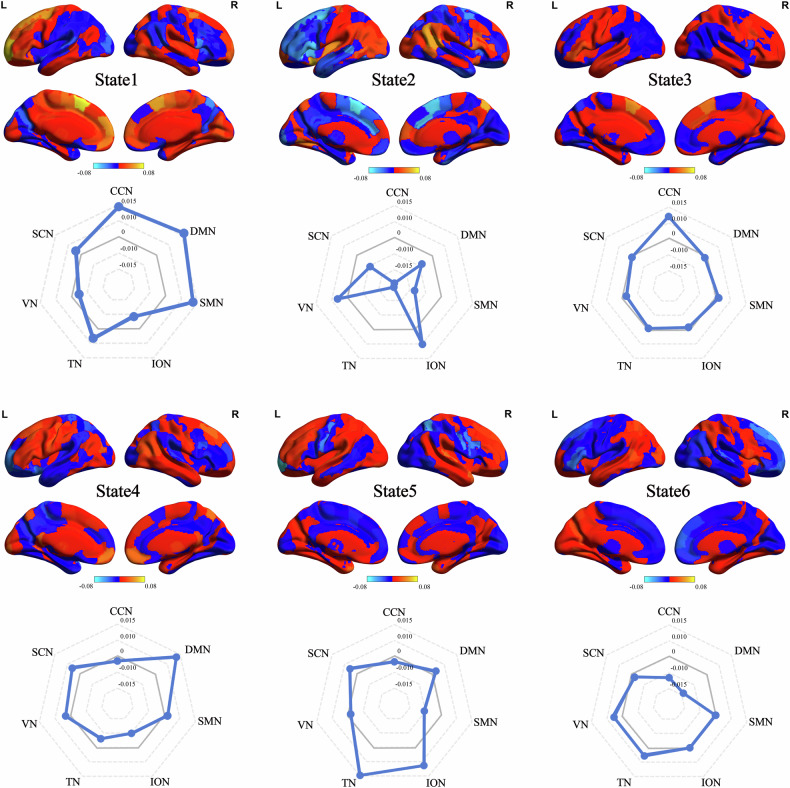
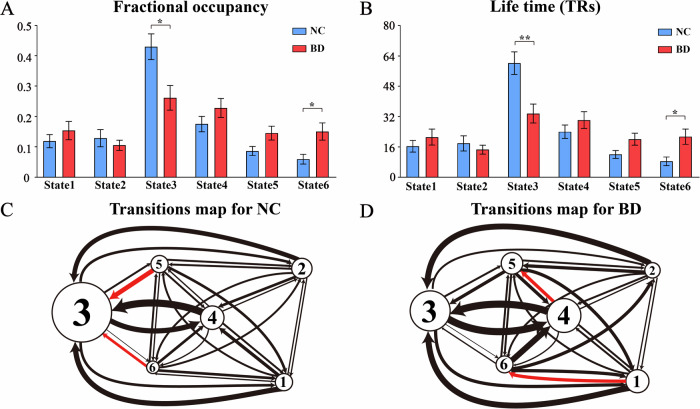
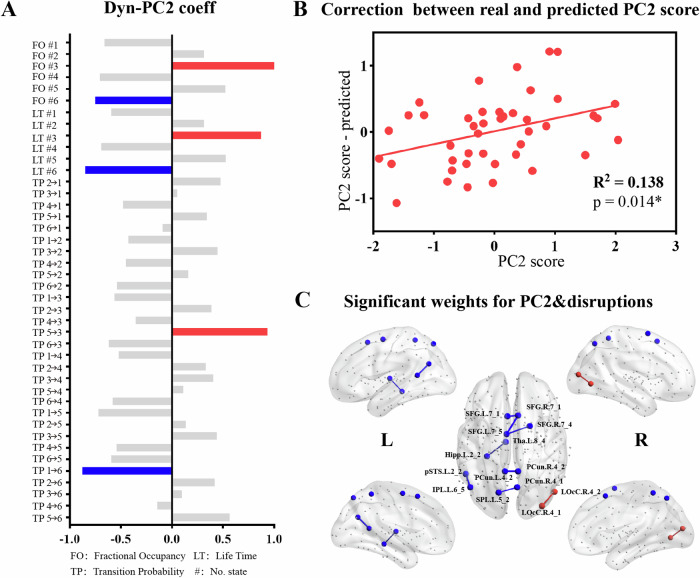
Bipolar disorder (BD) is a neuropsychiatric disorder characterized by severe disturbance and fluctuation in mood. Dynamic functional connectivity (dFC) has the potential to more accurately capture the evolving processes of emotion and cognition in BD. Nevertheless, prior investigations of dFC typically centered on larger time scales, limiting the sensitivity to transient changes. This study employed hidden Markov model (HMM) analysis to delve deeper into the moment-to-moment temporal patterns of brain activity in BD. We utilized resting-state functional magnetic resonance imaging (rs-fMRI) data from 43 BD patients and 51 controls to evaluate the altered dynamic spatiotemporal architecture of the whole-brain network and identify unique activation patterns in BD. Additionally, we investigated the relationship between altered brain dynamics and structural disruption through the ridge regression (RR) algorithm. The results demonstrated that BD spent less time in a hyperconnected state with higher network efficiency and lower segregation. Conversely, BD spent more time in anticorrelated states featuring overall negative correlations, particularly among pairs of default mode network (DMN) and sensorimotor network (SMN), DMN and insular-opercular ventral attention networks (ION), subcortical network (SCN) and SMN, as well as SCN and ION. Interestingly, the hypoactivation of the cognitive control network in BD may be associated with the structural disruption primarily situated in the frontal and parietal lobes. This study investigated the dynamic mechanisms of brain network dysfunction in BD and offered fresh perspectives for exploring the physiological foundation of altered brain dynamics.


Conflict of interest statement

Competing interests: The authors declare no competing interests. Ethics approval and consent to participate: The neuroimaging dataset used in this study was approved by the Institutional Review Boards at UCLA and the Los Angeles County Department of Mental Health. All participants provided written informed consent.

Figures

Fig. 1
Fig. 1. Schematic overview of the study.
A ROI time courses were extracted from the BOLD signals within each of the 246 cortical and subcortical areas for each participant. B The data were concatenated across participants including BD and NC groups and the dimensionality was reduced using PCA (principal component analysis). The HMM was run on the PCA-reduced timecourses, resulting in K number of states. C Each HMM state was characterized by a multivariate Gaussian distribution comprising a covariance matrix and a mean distribution and then were back-projected to the BN template space, yielding state-specific mean activation map and functional connectivity matrix. D Three dynamic states measures including the fractional occupancy, life time, and transition probability were evaluated. E The PCA analysis were performed over all the dynamical measures mentioned above. The projection of the BD patients’ dynamical measures onto the PCs space, and the structural disruptions were used as input for a ridge regression algorithm.
Fig. 2
Fig. 2. State-specific functional connectivity patterns.
The six states occurred in all participants regardless of group during the resting state scan. Individual ROIs are grouped by seven intrinsic networks including the cognitive control network (CCN), default mode network network (DMN), sensorimotor network (SMN), insular-opercular ventral attention or salience network(ION), temporal network (TN), visual network (VN) and subcortical network (SCN).
Fig. 3
Fig. 3. State-specific mean activation maps in ROI and intrinsic network level.
Red, orange, and yellow areas indicate regions that have above-average activation levels(increased activation) for a particular state, while green and blue areas indicate regions with below-average activation(decreased activation) in the cerebral cortex map. Dark gray represents the score boundary of 0 in the radar map.
Fig. 4
Fig. 4. State-specific whole-brain topology properties.
A Graph representations of the top 10% of positive correlations for all six states (overall across all states). Vertices are color-coded according to brain intrinsic network. B Graph topology measures including global efficiency, local efficiency and modularity for each of the 6 states.
Fig. 5
Fig. 5. Differences in whole-brain network dynamics between BD and NC groups.
A The significant differences in fractional occupancy (FO) of each state. B The significant differences in life time (LT) of each state. *p < 0.05, **p < 0.01(FDR-corrected). Transition probability (TP) maps between states of C NC and D BD groups. State node sizes are proportional to the fractional occupancy of each state. Red arrows indicate a relatively high transition probability as compared to the other group (p < 0.05 FDR-corrected).
Fig. 6
Fig. 6. Relationship between dynamic principal components (Dyn-PCs) and structural disruptions.
Only Dyn-PC2 are significantly described by ridge regression (RR) models. A The coefficients of Dyn-PC2 in dynamical features including fractional occupancy(FO), life time(LT) and transition probability(TP). Red represents loading positively significantly on the dynamic measures while blue represents loading negatively. B The scatter plot between real and estimated dynamic values of the RR algorithm. R2 is the amount of variance explained by each model, and p is the model significance. C The significant disruption weights which projected into the brain, where thicker lines represent higher. Blue color indicates negative weight and red color indicates positive.

Similar articles

Cited by

References

    1. Rowland TA, Marwaha S. Epidemiology and risk factors for bipolar disorder. Ther. Adv. Psychopharmacol. 2018;8:251–69. - PMC - PubMed
    1. Perry A, Roberts G, Mitchell PB, Breakspear M. Connectomics of bipolar disorder: a critical review, and evidence for dynamic instabilities within interoceptive networks. Mol. Psychiatry. 2019;24:1296–318. - PMC - PubMed
    1. Yoon S, Kim TD, Kim J, Lyoo IK. Altered functional activity in bipolar disorder: A comprehensive review from a large-scale network perspective. Brain Behav. 2021;11:e01953. - PMC - PubMed
    1. Zhao L, Wang Y, Jia Y, Zhong S, Sun Y, Qi Z, et al. Altered interhemispheric functional connectivity in remitted bipolar disorder: A Resting State fMRI Study. Sci. Rep. 2017;7:4698. - PMC - PubMed
    1. Wang Y, Wang J, Jia Y, Zhong S, Zhong M, Sun Y, et al. Topologically convergent and divergent functional connectivity patterns in unmedicated unipolar depression and bipolar disorder. Transl. Psychiatry. 2017;7:e1165. - PMC - PubMed