. 2024 Dec 30;15(1):10764.
doi: 10.1038/s41467-024-54458-w.

Antibodies to the RBD of SARS-CoV-2 spike mediate productive infection of primary human macrophages

Affiliations

Antibodies to the RBD of SARS-CoV-2 spike mediate productive infection of primary human macrophages

Suzanne Pickering et al. Nat Commun. .

Abstract

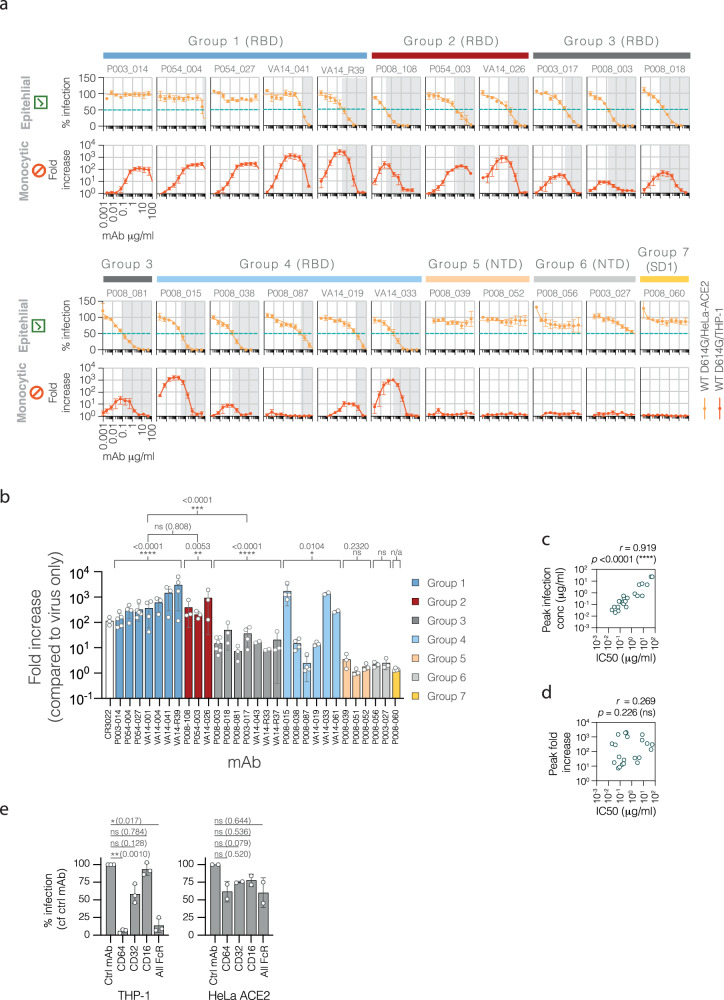
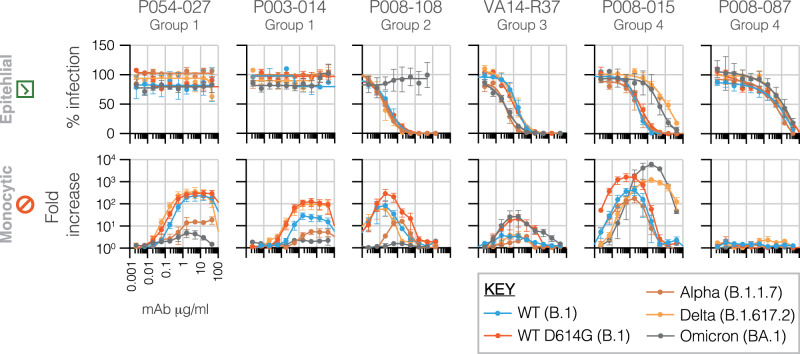
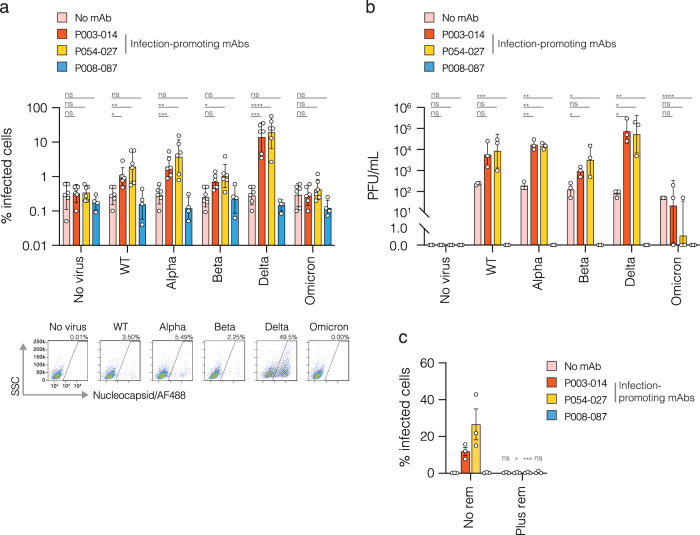
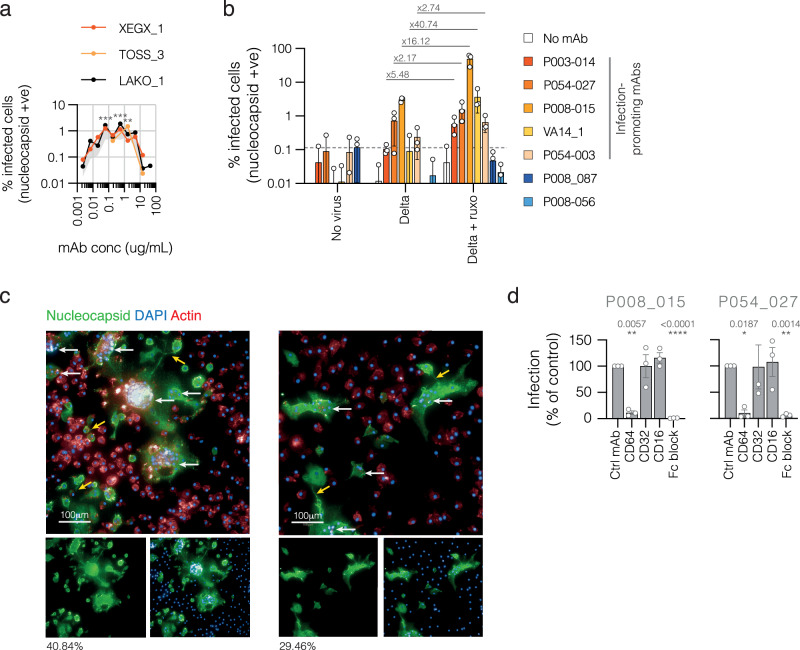
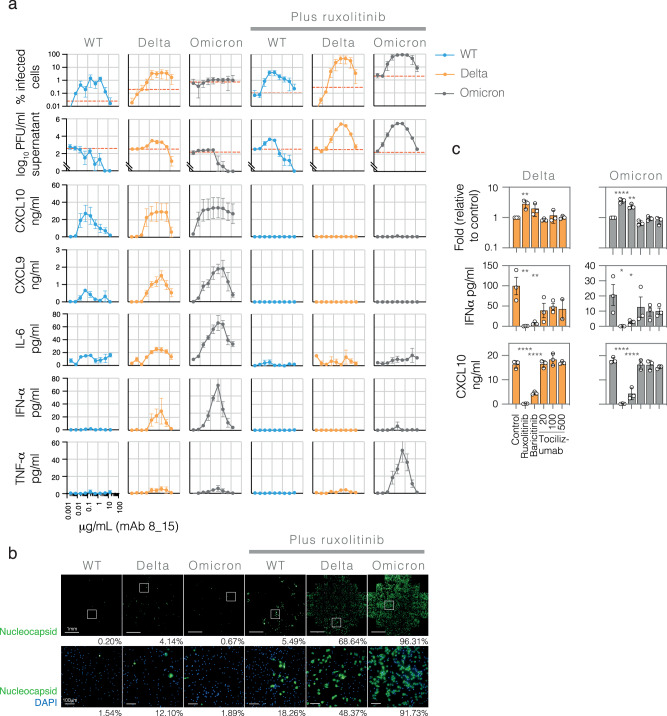
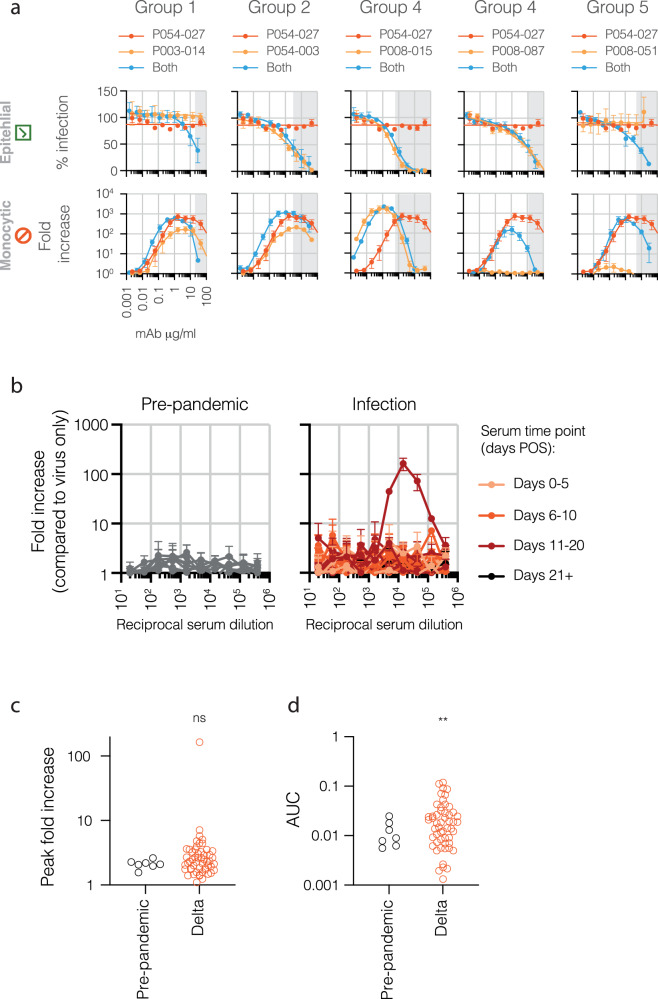
The role of myeloid cells in the pathogenesis of SARS-CoV-2 is well established, in particular as drivers of cytokine production and systemic inflammation characteristic of severe COVID-19. However, the potential for myeloid cells to act as bona fide targets of productive SARS-CoV-2 infection, and the specifics of entry, remain unclear. Using a panel of anti-SARS-CoV-2 monoclonal antibodies (mAbs) we performed a detailed assessment of antibody-mediated infection of monocytes/macrophages. mAbs with the most consistent potential to mediate infection were those targeting a conserved region of the receptor binding domain (RBD; group 1/class 4). Infection was closely related to the neutralising concentration of the mAbs, with peak infection occurring below the IC50, while pre-treating cells with remdesivir or FcγRI-blocking antibodies inhibited infection. Studies performed in primary macrophages demonstrated high-level and productive infection, with infected macrophages appearing multinucleated and syncytial. Infection was not seen in the absence of antibody with the same quantity of virus. Addition of ruxolitinib significantly increased infection, indicating restraint of infection through innate immune mechanisms rather than entry. High-level production of pro-inflammatory cytokines directly correlated with macrophage infection levels. We hypothesise that infection via antibody-FcR interactions could contribute to pathogenesis in primary infection, systemic virus spread or persistent infection.


Conflict of interest statement

Competing interests: The authors declare no competing interests.

Figures

Fig. 1
Fig. 1. Monoclonal antibodies with defined binding specificities to the SARS-CoV-2 spike RBD can mediate infection of monocytes.
a Assays were performed in parallel on SARS-CoV-2-permissive epithelial cells (HeLa-ACE2, indicated by green tick) and non-permissive monocytic cells (THP-1, indicated by red no entry symbol). Pseudoviruses with wildtype D614G SARS-CoV-2 spikes were preincubated with mAbs before addition to cells, with RLU measured 48 h later. % infection and fold increase were calculated relative to infection levels in the absence of antibody. Grey shaded areas indicate mAb concentrations at which greater than 50% neutralisation occured. Representative examples from seven spike binding specificity groups are shown (RBD groups 1–4, NTD groups 5 and 6, SD1 group 7). Means are from three independent experiments, error bars ±SEM. b Summary of infection-promoting potential of 28 mAbs, displayed as peak infection (fold increase relative to no mAb) in THP-1 assays. Bars are coloured according to spike binding specificity. Peak infection level of SARS-CoV-1 mediated by mAb CR3022 is shown for comparison (white bar). Means are from at least two independent experiments, error bars ±SD. Results for each binding specificity group were compared to theoretical mean of 1 (no infection) using two-tailed one sample t-tests. Results from group 1 were compared with other groups using two-tailed Welch’s t-tests: >0.1 (ns), <0.1 (*), <0.01 (**), <0.001 (***), <0.0001 (****). c The mAb concentration at which peak infection of THP-1 monocytes occurred and (d) the peak magnitude of THP-1 infection (measured by fold increase in the presence vs absence of antibody) were compared with IC50 values for all neutralising RBD-specific mAbs that mediated THP-1 infection (n = 22). r and p values were determined by two-tailed Spearman correlation, >0.1 (ns), <0.1 (*), <0.01 (**), <0.001 (***), <0.0001 (****). e FcγR blocking experiments were performed by pre-incubating THP-1 cells with function-blocking mAbs for FcγRI (CD64), FcγRII (CD32) or FcγRIII (CD16), or isotype control mAb, then measuring infection mediated by mAb P003_014. Parallel HeLa-ACE2 assays were performed as controls. Means are from three (THP-1) or two (HeLa ACE2 control cells) independent experiments, error bars ±SD. Infection levels in the presence of FcR blocking mAb were compared to control mAb for each condition using two-way ANOVA with mixed effects analyses: >0.1 (ns), <0.1 (*), <0.01 (**), <0.001 (***), <0.0001 (****).
Fig. 2
Fig. 2. SARS-CoV-2 RBD-specific mAbs promote infection of several VOCs.
Representative mAbs from each of the four RBD binding groups shown in A were tested in parallel HeLa-ACE2 and THP-1 assays, as for A, using pseudoviruses with spikes from wildtype (WT) SARS-CoV-2 (B.1), wildtype with the D614G mutation (WT D614G; B.1) and variants of concern alpha (B.1.1.7), delta (B.1.617.2) and omicron (B.1.1.529). Means are derived from three independent experiments, error bars ±SEM.
Fig. 3
Fig. 3. SARS-CoV-2 RBD-specific mAbs promote productive infection of monocytes.
a Five major variants of infectious SARS-CoV-2 – wildtype (WT; B.1), alpha (B.1.1.7), beta (B.1.351), delta (B.1.617.2) and omicron (B.1.1.529.1) – were compared for the ability to infect monocytes. Viruses were preincubated with infection-promoting mAbs P003_014, P054_027 or non-infection-promoting control mAb P008_087 at 6 μg/ml prior to addition to THP-1 cells at an MOI of 1. 72 hours later cells were intracellularly stained for SARS-CoV-2 nucleocapsid and % infected cells measured by flow cytometry. Control cultures containing no virus or no mAb were included in all experiments. Dotted line shows the highest mean value obtained in the absence of virus (0.28%), thus representing background cut-off. Means were derived from 6 independent experiments for no mAb, P003_014 and P054_027 and 4 independent experiments for the control mAb P008_087, with error bars representing ±SD. Two-way ANOVA with Tukey’s multiple comparison was used to determine whether infection was significant in the presence vs absence of mAb for each virus. >0.1 (ns), <0.1 (*), <0.01 (**), <0.001 (***), <0.0001 (****). Representative flow cytometry plots showing % nucleocapsid positive cells in the presence of P054_027 mAb are shown below each variant and no virus control. b Cell culture supernatants from the THP-1 infections shown in (a) were assayed for the presence of infectious virus by Vero.E6.TMPRSS2 plaque assay. Mean PFU/mL were calculated from three independent experiments, error bars ±SD. To enable values of zero to be shown on the same graph, the bottom portion of the y-axis has been converted to linear. Two-way ANOVA was used to compare virus quantities measured in the cell culture supernatant in the presence of each mAb vs no mAb for each variant. >0.1 (ns), <0.1 (*), <0.01 (**), <0.001 (***), <0.0001 (****). c THP-1 cells were pre-treated with remdesivir (10 μM) then infected as in (a) with delta virus at an MOI of 1, pre-incubated with mAbs P003_014, P054_027 or P008_087 or no mAb. 72 hours later cells were intracellularly stained for SARS-CoV-2 nucleocapsid and % infected cells measured by flow cytometry. Means from three independent experiments, error bars ±SEM. Two-way ANOVA was used to compare infection levels with and without remdesivir for each condition. >0.1 (ns), <0.1 (*), <0.01 (**), <0.001 (***), <0.0001 (****).
Fig. 4
Fig. 4. Longitudinal studies of mAb-mediated SARS-CoV-2 infection in monocytes.
Wildtype (WT;B.1), alpha (B.1.1.7) or delta (B.1.617.2) viruses were pre-incubated with infection-promoting mAbs P003_014, P054_027 or non-infection-promoting control mAb P008_087 at 3 μg/ml prior to addition to THP-1 cells at an MOI of 1. Time points were taken at 1, 2, 3, 4 and 7 days post-infection for the determination of % infected cells by flow cytometry (upper panel) and at the time of infection (day 0) and 1, 2, 3, 4 and 7 days post-infection for the determination of infectious virus in the supernatant by plaque assay (lower panel). Results are presented as means from three independent experiments, error bars ±SD. Two-way ANOVA with Tukey’s multiple comparison was used to determine whether infection was significant in the presence of P054_027 mAb vs no mAb for each virus and each time point. >0.1 (ns), <0.1 (*), <0.01 (**), <0.001 (***), <0.0001 (****). Representative flow cytometry plots are shown for cells infected with no virus (control), WT (B.1), alpha (B.1.1.7) and delta (B.1.617.2) virus in the presence of P054_027 mAb on day 3 post-infection.
Fig. 5
Fig. 5. Infection of iPSC- and primary monocyte-derived macrophages by SARS-CoV-2.
a iPSC-derived macrophages were infected with delta virus (B.1.617.2) at an MOI of 1 for 48 hours following pre-incubation with increasing concentrations of infection-promoting mAb P008_015. Cells were intracellularly stained for SARS-CoV-2 nucleocapsid, DAPI and actin, and % infected cells determined by high-content imaging. Results are shown for three iPSC genotypes (XEGX_1, TOSS_3 and LAKO_1). Grey-shaded area represents SEM of all three genotypes. Concentrations of mAb at which the mean % infected cells is significantly greater than virus with no mAb were determined by one-way ANOVA: p = 0.0002 at 0.06 μg/ml, 0.0001 at 0.56 μg/ml and 0.0078 at 1.67 μg/ml (>0.1 (ns), <0.1 (*), <0.01 (**), <0.001 (***)). b Primary human monocyte-derived macrophages were infected with delta virus at an MOI of 1 following pre-incubation with five infection-promoting mAbs (P003_014, P054_027, P008_015, VA14_001 and P054_003) or two non-infection-promoting mAbs (P008_087 and P008_056) at a concentration of 1 μg/ml, or no mAb as a control, for 48 hours before intracellular staining for SARS-CoV-2 nucleocapsid. All mAbs were also tested in the absence of virus. % infected cells were determined by high-content imaging. Dotted line shows the highest mean value obtained in the absence of virus, thus representing background cut-off. Results are shown as means from three donors, with coloured bars representing the mean and individual data points shown as circles. Error bars ±SD. Fold increase in % infected cells in the presence vs absence of ruxolitinib is shown for each mAb. c Detailed images of infected macrophages. Green, SARS-CoV-2 nucleocapsid; red, actin; blue, DAPI. Scale bar 100 μm. Examples of multinucleate structures are indicated by white horizontal arrows; examples of filipodia are indicated by yellow angled arrows. d FcγR blocking experiments were performed by pre-incubating macrophages from three different donors with function-blocking mAbs for FcγRI (CD64), FcγRII (CD32) or FcγRIII (CD16), or isotype control mAb, then measuring delta virus infection mediated by mAb P008_015 (left graph) and P054_027 (right graph). % infection was normalised to infection in the presence of control mAb for each donor, then means were derived from normalised infection levels for three different donors, error bars ±SEM. Infection levels in the presence of FcR blocking mAb were compared to control mAb for each condition using two-way ANOVA with mixed effects analyses: >0.1 (ns), <0.1 (*), <0.01 (**), <0.001 (***), <0.0001 (****).
Fig. 6
Fig. 6. Infection of primary monocyte-derived macrophages by SARS-CoV-2 leads to pro-inflammatory cytokine production.
a Primary human monocyte-derived macrophages were infected with wildtype (WT;B.1), delta (B.1.617.2) or omicron (B.1.1.529.1) virus at an MOI of 1 following pre-incubation with increasing concentrations of infection-promoting mAb P008-015. Virus-only and mAb-only controls were included in all experiments. 48 hours after infection cells were intracellularly stained for SARS-CoV-2 nucleocapsid, DAPI and actin, and % infected cells determined by high content imaging. Supernatant was removed for the determination of infectious virus (PFU/ml) by plaque assay and the production of five pro-inflammatory cytokines (CXCL9, −10, IL-6, IFNα and TNFα) measured by cytometric bead array (CBA). Additional images from these experiments are shown in Supplementary Fig. 3 and cytokine measurements for IFNγ, IL-1β, IL-10 and IL-12 are shown in Supplementary Fig. 4. Y-axis scales are the same for all graphs in the same row, and x-axis scales are the same for all graphs, marked as grids. Means were derived from independent experiments performed on three different donors, error bars ±SD. Dashed red lines on the % infected cells graphs indicate the mean level of signal detected in the absence of antibody (i.e. background staining for each experiment). Dashed red lines on the PFU/ml graphs indicate the level of virus detected in the absence of antibody (i.e. residual input virus). b Images of infected macrophages are shown for the peak infection of each condition shown in (a), directly below each graph. Images in the top row show overviews of the whole imaged well (from a 96-well plate), scale bar 1 mm, for SARS-CoV-2 nucleocapsid only, green; images in the bottom row show the highlighted fields of view indicated by white boxes as a representative example, scale bar 100 μm, for SARS-CoV-2 nucleocapsid, green, and DAPI, blue. % infection for each individual well or field of view is shown below each image. c Infection of primary human macrophages with delta and omicron viruses was performed as for (a) at a single concentration of P008_015 mAb (2 μg/ml for delta infections and 0.5 μg/ml for omicron), in the presence of ruxolitinib (10 μM), baricitinib (1 μM) or 3 different concentrations of tociluzumab (20, 100 and 500 ng/ml). % infection was normalised to control infections (no treatment) for each donor, then means were derived from normalised infection levels for three different donors, error bars ±SD. IFNα and CXCL10 cytokine concentrations in cell culture supernatants were measured as for (a). Means were derived from independent experiments performed on three different donors, error bars ±SD. For all experiments, each condition was compared to control using one-way ANOVA: >0.1 (ns), <0.1 (*), <0.01 (**), <0.001 (***), <0.0001 (****).
Fig. 7
Fig. 7. Polyclonality and in vivo relevance.
a mAb mix experiments examining the effect of neutralising, non-neutralising and non-enhancing mAbs on infection-mediating mAbs. Assays were performed in parallel on SARS-CoV-2-permissive epithelial cells (HeLa-ACE2, indicated by green tick) and non-permissive monocytic cells (THP-1, indicated by red ‘no entry’ symbol). HIV-1-based pseudoviruses bearing SARS-CoV-2 spikes (wave 1 D614G) were preincubated with increasing concentrations of monoclonal antibodies before incubation with cells for 48 hours. Infection is measured by luciferase assay, with % infection and fold increase calculated relative to infection levels in the absence of antibody (in the case of THP-1 cells this is background RLU). Scales on all HeLa-ACE2 and all THP-1 graphs are identical, indicated by grey grid lines. Grey-shaded areas indicate mAb concentrations for mAb mixes at which greater than 50% neutralisation occurs. Overall IgG concentration in the mAb mixes is the same as the individual mAbs, effectively halving the individual mAb concentrations. Means are derived from three independent experiments, error bars ±SEM. b Serum samples from uninfected individuals (pre-pandemic negative n = 7), and from acute infection during the delta wave in the UK (n = 53) were tested in THP-1 assays with delta spike-pseudotypes. Means are derived from two independent experiments, error bars ±SD. Dot plots summarise peak fold increase (c) or normalised AUC (d) of each serum sample for the different cohorts against delta-pseudotyped viruses. Two-tailed Welch’s t-test was used to determine differences between the cohorts. For comparison of peak fold increase, p = 0.247 (ns); for comparison of normalised AUC p = 0.0023 (**).

Similar articles

References

    1. Wiersinga, W. J. et al. Pathophysiology, Transmission, Diagnosis, and Treatment of Coronavirus Disease 2019 (COVID-19): A Review. JAMA324, 782–793 (2020). - PubMed
    1. Merad, M. et al. The immunology and immunopathology of COVID-19. Science375, 1122–1127 (2022). - PubMed
    1. Laing, A. G. et al. A dynamic COVID-19 immune signature includes associations with poor prognosis. Nat. Med.26, 1623–1635 (2020). - PubMed
    1. Del Valle, D. M. et al. An inflammatory cytokine signature predicts COVID-19 severity and survival. Nat. Med.26, 1636–1643 (2020). - PMC - PubMed
    1. Su, C. Y. et al. Circulating proteins to predict COVID-19 severity. Sci. Rep.13, 6236 (2023). - PMC - PubMed

Publication types

MeSH terms