. 2024 Dec 30;15(1):10725.
doi: 10.1038/s41467-024-54737-6.

Rapid nongenomic estrogen signaling controls alcohol drinking behavior in mice

Affiliations

Rapid nongenomic estrogen signaling controls alcohol drinking behavior in mice

Lia J Zallar et al. Nat Commun. .

Abstract

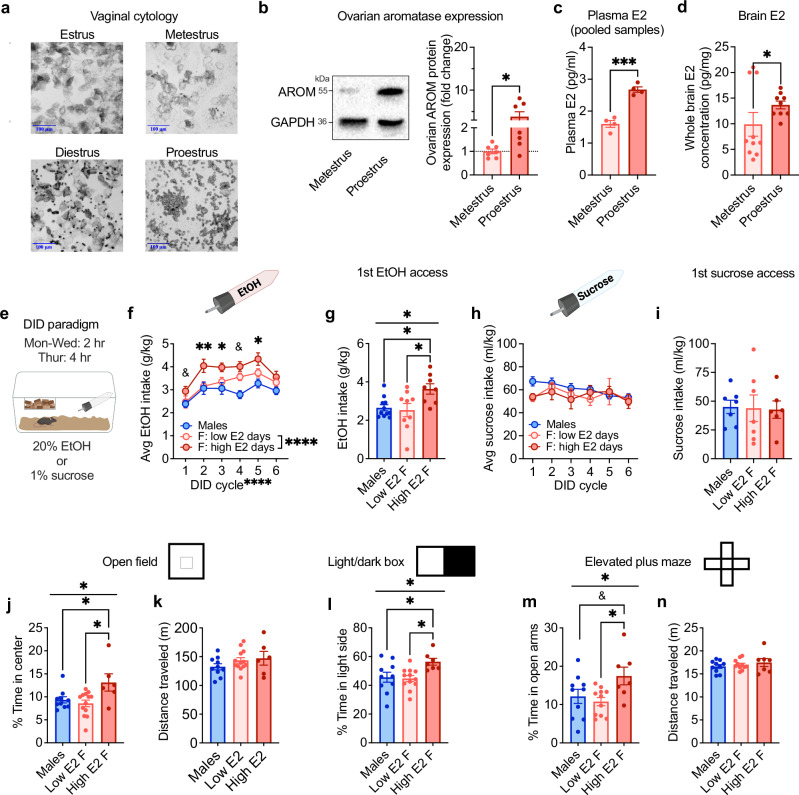
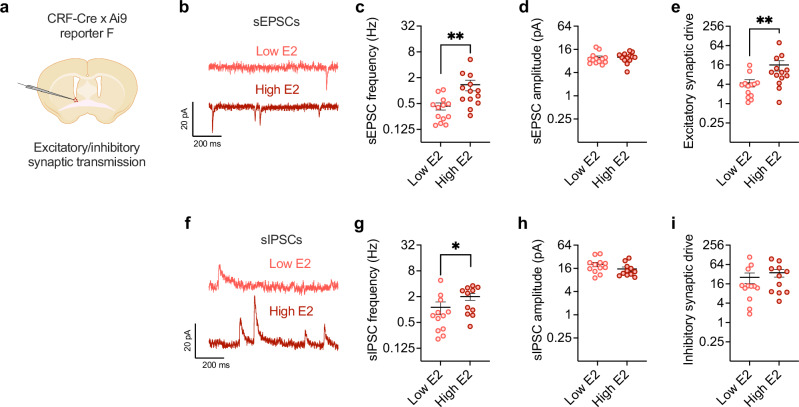
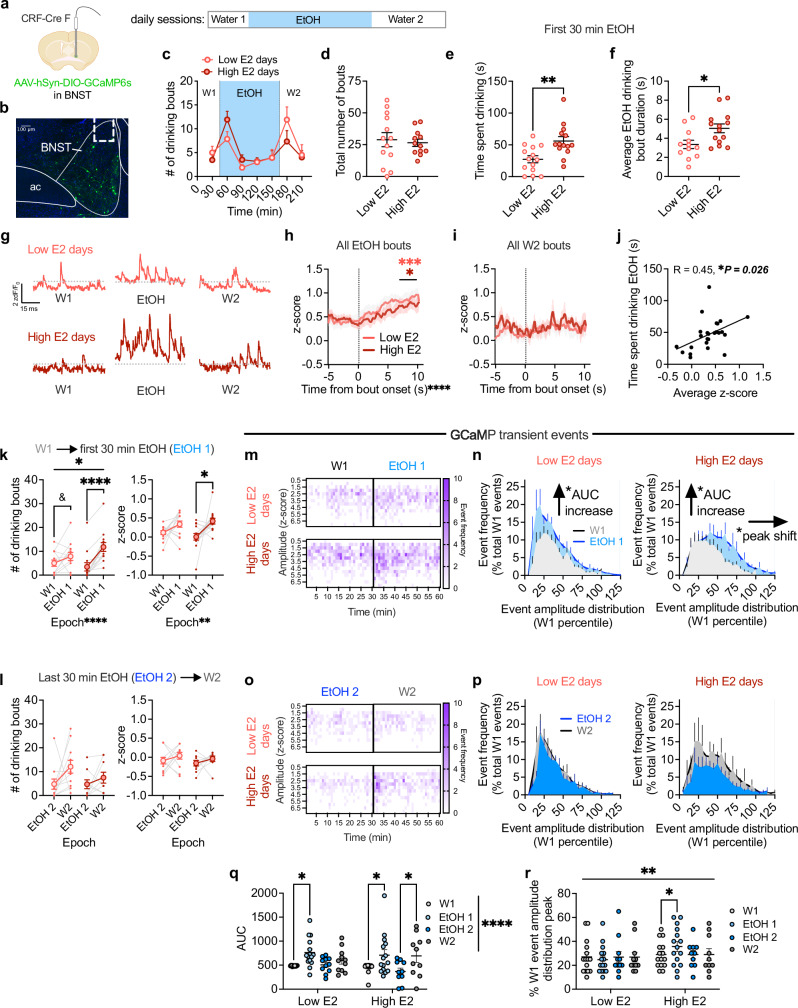
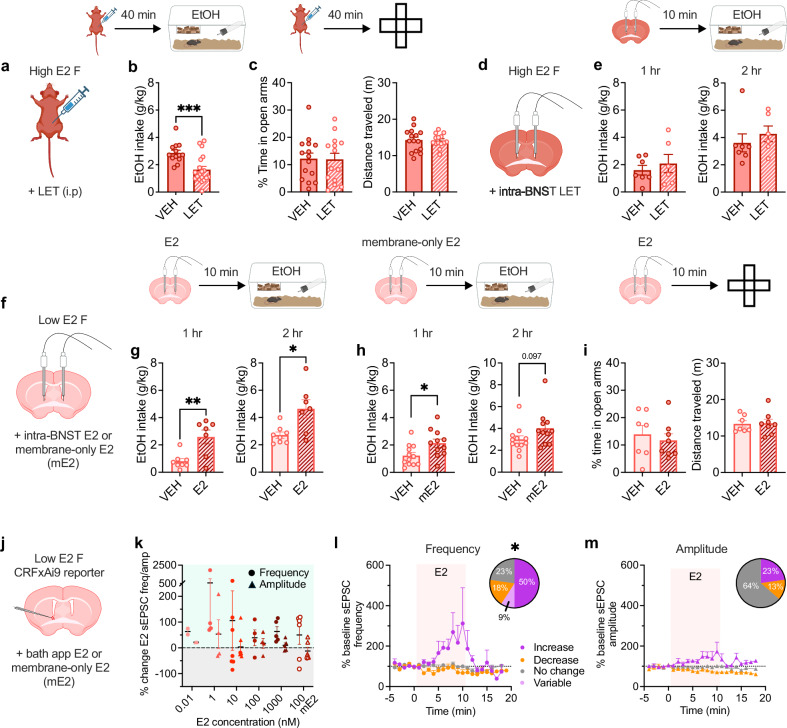
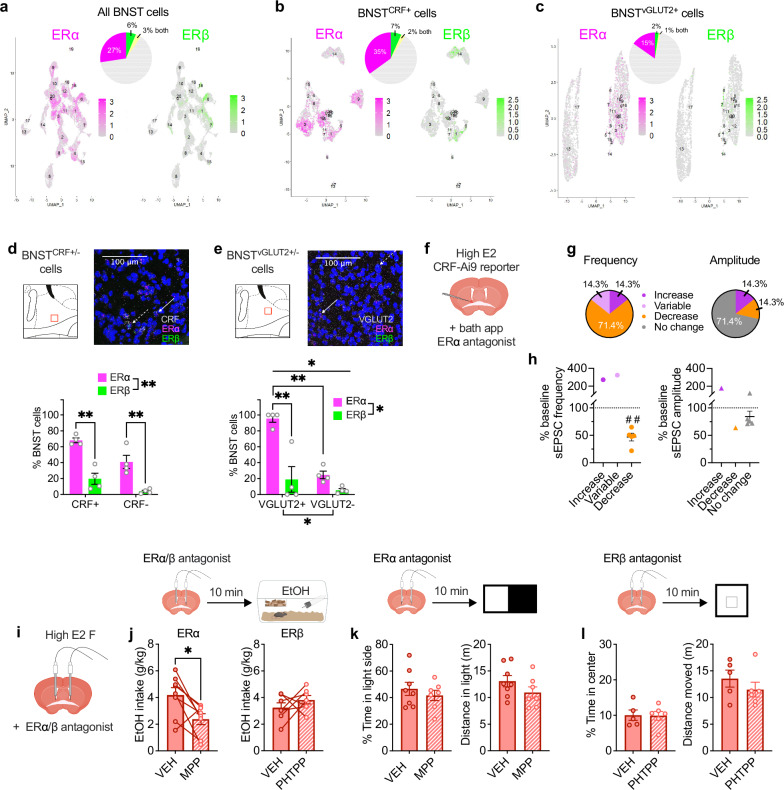
Ovarian-derived estrogen can signal non-canonically at membrane-associated receptors in the brain to rapidly regulate neuronal function. Early alcohol drinking confers greater risk for alcohol use disorder in women than men, and binge alcohol drinking is correlated with high estrogen levels, but a causal role for estrogen in driving alcohol drinking has not been established. We found that female mice displayed greater binge alcohol drinking and reduced avoidance when estrogen was high during the estrous cycle than when it was low. The pro-drinking, but not anxiolytic, effect of high endogenous estrogen occurred via rapid signaling at membrane-associated estrogen receptor alpha in the bed nucleus of the stria terminalis, which promoted synaptic excitation of corticotropin-releasing factor neurons and facilitated their activity during alcohol drinking. Thus, this study demonstrates a rapid, nongenomic signaling mechanism for ovarian-derived estrogen in the brain controlling behavior in gonadally intact females.


Conflict of interest statement

Competing interests: The authors declare no competing interests.

Figures

Fig. 1
Fig. 1. Binge alcohol drinking and avoidance behavior fluctuate with E2 status across the estrous cycle.
a Representative images of vaginal epithelial cells across the estrous cycle. b Ovarian aromatase (AROM) protein expression in female mice categorized as proestrus compared to metestrus status females (N’s = metestrus 7, proestrus 7). c Plasma E2 concentrations in proestrus and metestrus status females (N’s = metestrus 4, proestrus 4; each N represents a pooled sample from five mice). d Whole-brain E2 concentrations in proestrus and metestrus status females (N’s = metestrus 10, proestrus 9). e Drinking in the Dark (DID) binge drinking paradigm (Biorender license: VB27JLIIQ2). f Average 2-h consumption of EtOH across cycles of DID (N’s = 27 F, 7 M; Biorender license: RP27GVXCTW). g First EtOH access (N’s = high E2 8, low E2 9, M 11). h Average 2-h consumption of sucrose across cycles of DID (N’s = 15 F, 15 M; Biorender license: DD27GVXH5F). i First sucrose access consumption (N’s = high E2 6, low E2 7, M 7). j % Time spent in the center of the open field (OF; N’s = high E2 6, low E2 13, M 10). k Distance traveled in the OF (N’s = high E2 6, low E2 13, M 10). l % Time on the light side of the light:dark box (LDB; N’s = high E2 7, low E2 12, M 10). m % Time in open arms of the elevated plus maze (EPM; N’s = high E2 7, low E2 11, M 10). n Distance traveled in the EPM (N’s = high E2 7, low E2 11, M 10). *P < 0.05, **P < 0.01, ***P < 0.001, ****P < 0.0001, &P < 0.10 for unpaired t-tests, mixed effects analysis main effects, one way ANOVA main effects of group, and post hoc t-tests paired t-tests with H-S corrections between high and low E2 days in f and post hoc unpaired t-tests with H-S corrections for other panels, as indicated. Data are presented as mean values +/−SEM. Detailed statistics provided in Supplemental Table 1. Source data are provided as a Source Data file.
Fig. 2
Fig. 2. BNSTCRF neurons are sensitive to ovarian estrogen status.
Spontaneous synaptic transmission in BNSTCRF neurons as measured in slice electrophysiology recordings from intact CRF-CrexAi9 reporter females in low vs. high ovarian E2 states, with schematic in a (Biorender license: QD27GVXM7M). b Representative traces of spontaneous excitatory postsynaptic currents (sEPSCs). c The frequency of sEPSCs in BNSTCRF neurons from high and low ovarian E2 status females (N’s = 6 low E2, 13 cells; 7 high E2, 13 cells; d and e are the same cells). d sEPSC amplitude in high and low ovarian E2 status female BNSTCRF neurons. e) Excitatory synaptic drive onto BNSTCRF neurons (frequency x amplitude) high and low ovarian E2 status females. f Representative traces of spontaneous inhibitory postsynaptic currents (sIPSCs). sIPSC frequency in BNSTCRF neurons high and low ovarian E2 status females (g), amplitude (h), and synaptic drive (i; N’s = 6 low E2, 12 cells; 7 high E2, 11 cells). *P < 0.05, **P < 0.01 for unpaired t-tests between low E2 and. high E2 groups. Data are presented as mean values +/−SEM. Detailed statistics provided in Supplemental Table 1. Source data are provided as a Source Data file.
Fig. 3
Fig. 3. Ovarian E2 state modulates the activity of BNSTCRF neurons during motivated alcohol drinking.
Fiber photometry recordings of GCamP6s in BNSTCRF neurons, with schematic of unilateral viral injection and optical fiber cannula placement (a; Biorender license: QP27GVY1EL) and representative image of GCaMP expression/fiber placement (b; ac: anterior commissure). c Modified EtOH DID timeline with water access given before (W1) and after (W2) the 2-h EtOH access period, and drinking bouts time course on high and low E2 days. d Total drinking bouts across the session (EtOH + W2; N’s=5 for all sub figures, 13 low E2, 12 high E2). Total time spent displaying motivated EtOH drinking (time in bout; e; 14 low E2, 14 high E2) and average EtOH bout duration (f; 12 low E2, 14 high E2). g Representative traces of GCaMP signal from one mouse on a low E2 and high E2 day. GCaMP signal during high and low E2 days 10 seconds following bout onset for EtOH (h) and water (i; 13 low E2, 15 high E2 for both). j Correlation between GCaMP signal and time spent motivated drinking during the first 30 min of EtOH (25 days). k The number of drinking bouts (13 low E2, 13 high E2) and average GCaMP signal (14 low E2, 14 high E2) during the first 30 min of EtOH (EtOH 1) compared to W1. l Bout number (11 low E2, 9 high E2) and GCaMP signal (11 low E2, 9 high E2) in the first 30 min of W2 compared to the last 30 min of EtOH (EtOH 2) on high and low E2 days. m Representative heat map of the frequency of GCaMP transient events across amplitude bins for a single mouse across W1 and EtOH 1 on low vs. high E2 days. n Frequency distribution of event amplitudes normalized to the amplitude distribution for W1 within each day during W1 and EtOH 1 epochs. o Representative heat map of the frequency of GCaMP events across amplitude bins across EtOH 2 and W2 for the same mouse as in l. p Frequency distribution of event amplitudes normalized to the amplitude distribution for W1 during EtOH 2 and W2. q Area under the curve (AUC) of GCaMP event distributions shown in n and p (W1 and EtOH 1: 15 low E2, 15 high E2; EtOH 2 and W2: 11 low E2, 10 high E2). r The peak of the event amplitude distributions shown in n and p (same N’s depicted in q). *P < 0.05, **P < 0.01, ***P < 0.001, ****P < 0.0001, &P < 0.10 for unpaired t-tests, 2xANOVA main effects and interactions and their post hoc paired t-tests with H-S corrections, and Pearson’s correlation. Data are presented as mean values +/−SEM. Detailed statistics are provided in Supplemental Table 1. Source data are provided as a Source Data file.
Fig. 4
Fig. 4. Rapid E2 signaling in the BNST recapitulates the pro-drinking but not anxiolytic effects of ovarian E2 and modulates BNSTCRF neurons.
a Systemic E2 synthesis inhibition in high ovarian E2 mice using the aromatase inhibitor letrozole (LET, 10 mg/kg; Biorender license: UM27GVZ81B). b Effects of LET administration on EtOH consumption (N’s = 13 saline VEH, 19 LET; Biorender license: VB27JLIIQ2). c Effects of LET administration on elevated plus maze (EPM) % time spent in the open arms (left) or distance traveled (right; N’s = 15 VEH, 14 LET). d Intra-BNST infusion of LET (1 μg in 200 nl/side) in high E2 status females. e Effects of intra-BNST LET on EtOH consumption (N’s = 7 VEH, 6 LET). f Intra-BNST infusion of E2 (20 pg in 200 nl/side) or membrane-impermeable E2 (mE2, 55 pg in 200 nl/side) in low E2 status females (Biorender license: BF27GVZGF6). g Effects of intra-BNST E2 on EtOH consumption (N’s = 8 VEH, 7 E2). h Effects of intra-BNST mE2 on EtOH consumption (N’s = 12 VEH, 11 mE2). i Effects of intra-BNST E2 on EPM % time spent in the open arms (left) or distance traveled (right; N’s = 7 VEH, 8 E2). j Effects of bath application of E2/mE2 on excitatory synaptic transmission in BNSTCRF neurons during slice electrophysiology recordings in low ovarian E2 status female CRF-CrexAi9 reporters (Biorender license: JF27GVZUJE). k Spontaneous excitatory postsynaptic currents (sEPSCs) maximum delta from % baseline during E2/mE2 wash on (E2 nM: 0.01: N = 2, 2 cells; 1: N = 4, 4 cells; 10: N = 5, 7 cells; 100: N = 4, 4 cells; 1000: N = 3, 5 cells; 100 nM mE2: N = 3, 6 cells; l and m are the same cells). l Time course of BNSTCRF neurons that displayed increase/decrease/no change in sEPSC frequency and amplitude (m) % change from baseline during E2 application and proportion of responding categories (pie charts). *P < 0.05, **P < 0.01, ***P < 0.001 for unpaired t-tests between VEH vs. LET treatment and VEH vs E2/mE2 treatment; Fisher’s exact test frequency vs amplitude; post hoc t-tests with H-S corrections as indicated. Data are presented as mean values +/−SEM. Detailed statistics are provided in Supplementary Table 1. Source data are provided as a Source Data file.
Fig. 5
Fig. 5. ERα is robustly expressed in the BNST and mediates rapid E2 modulation of binge drinking but not avoidance behavior.
ac Analysis of single nucleus RNA sequencing (snRNA-seq) of female mouse BNST nuclei (total cells: 38,806; GEO: GSE126836). a BNST cells expressing estrogen receptor α (ERα; Esr1) and estrogen receptor β (ERβ; Esr2) and both. b Crh-expressing BNST cells (BNSTCRF) expressing ERα, ERβ, and both. c Slc17a6-expressing BNST cells (BNSTVGLUT2) expressing ERα, ERβ, and both. d, e RNAscope fluorescence in situ hybridization (FISH) probing for ERα (Esr1), ERβ (Esr2), CRF (Crh), and VGLUT2 (Slc17a6) in the BNST in females, with red boxes indicating the location of confocal z-stack images taken; representative images pseudocolored for visibility. d ERα and ERβ expression in CRF+ and CRF- cells (N’s = 4). Dashed arrow: cell expressing CRF/ERα/ERβ; solid arrow: cell expressing CRF/ERα. e ERα and ERβ expression in VGLUT2+ cells (N’s = 4). Dashed arrow: cell expressing VGLUT2/ERα/ERβ; solid arrow: cell expressing VGLUT2/ERα. f Bath application of the ERα antagonist methyl-piperidino-pyrazole (MPP) on BNSTCRF neurons during slice electrophysiology recordings in high ovarian E2 female CRF-CrexAi9 reporters (Biorender license: NF27GVWGQV). g, h Effects of bath application of MPP (3 μM) on spontaneous excitatory postsynaptic current (sEPSC) frequency and amplitude (N’s = 4, 7 cells). i Depiction of strategy to site-deliver MPP (10 μM/200 nl/side), the ERβ antagonist 4-[2-phenyl-5,7-bis(trifluoromethyl)pyrazolo[1,5-a]pyrimidin-3-yl]phenol (PHTPP; 10 μM/200 nl/side), or saline (VEH) to the BNST in high E2 females (Biorender license: ZS27GW07FP). j Effects of intra-BNST MPP (N’s=8, 8 VEH, 8 MPP) or PHTPP (N’s = 7, 7 VEH, 7 PHTPP) on binge EtOH consumption (Biorender license: VB27JLIIQ2). k Effects of intra-BNST MPP on avoidance behavior in the light:dark box (LDB; N’s = 8 VEH, 7 MPP). l Effects of intra-BNST PHTPP on avoidance behavior in the open field (OF; N’s = 5 VEH, 6 PHTPP). *P < 0.05, **P < 0.01, ***P < 0.001 for 2xANOVA main effects and interactions between receptors; paired t-tests between VEH vs. ER antagonist treatment prior to DID; unpaired t-tests between VEH vs. ER antagonist treatment prior to avoidance assays; post hoc t-tests with H-S corrections as indicated. ##<0.01; one sample t-test. Data are presented as mean values +/−SEM. Detailed statistics are provided in Supplementary Table 1. Source data are provided as a Source Data file.

Update of

References

    1. Galea, L. A. M., Frick, K. M., Hampson, E., Sohrabji, F. & Choleris, E. Why estrogens matter for behavior and brain health. Neurosci. Biobehav. Rev.76, 363–379 (2017). - PMC - PubMed
    1. Simpson, E. R. Sources of estrogen and their importance. J. Steroid Biochem. Mol. Biol.86, 225–230 (2003). - PubMed
    1. Findlay, J. K., Liew, S. H., Simpson, E. R. & Korach, K. S. Estrogen signaling in the regulation of female reproductive functions. Handb. Exp. Pharmacol., 198, 29–35 (2010). - PMC - PubMed
    1. Taxier, L. R., Gross, K. S. & Frick, K. M. Oestradiol as a neuromodulator of learning and memory. Nat. Rev. Neurosci.21, 535–550 (2020). - PMC - PubMed
    1. Frick, K. M. & Kim, J. Mechanisms underlying the rapid effects of estradiol and progesterone on hippocampal memory consolidation in female rodents. Horm. Behav.104, 100–110 (2018). - PMC - PubMed

Publication types

LinkOut - more resources