. 2024 Dec 30;15(1):10747.
doi: 10.1038/s41467-024-54817-7.

NET formation-mediated in situ protein delivery to the inflamed central nervous system

Affiliations

NET formation-mediated in situ protein delivery to the inflamed central nervous system

Yina Wu et al. Nat Commun. .

Erratum in

Abstract

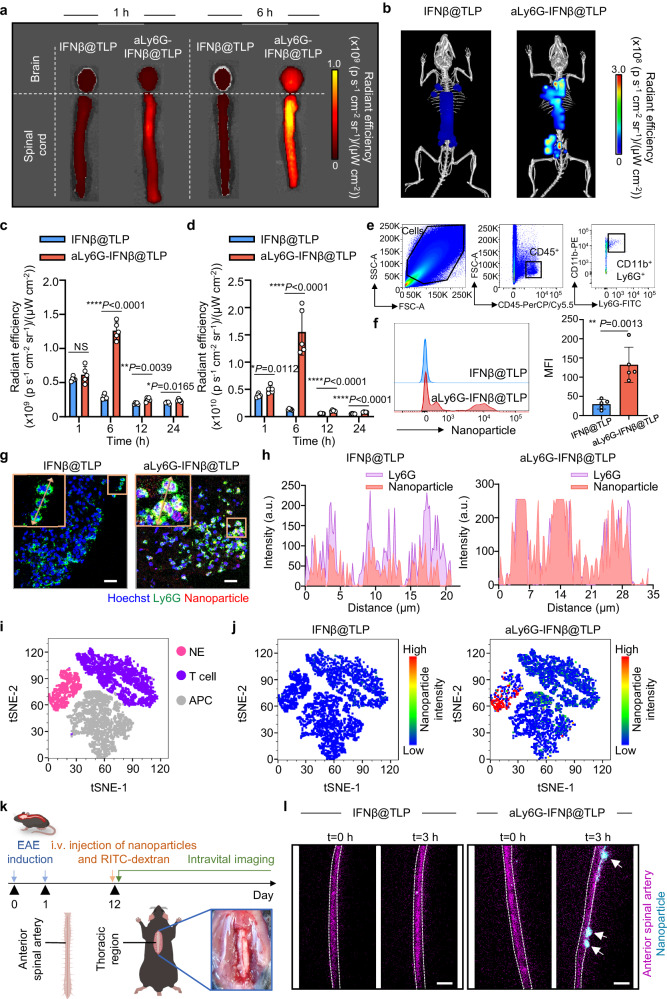
Delivering protein drugs to the central nervous system (CNS) is challenging due to the blood-brain and blood-spinal cord barrier. Here we show that neutrophils, which naturally migrate through these barriers to inflamed CNS sites and release neutrophil extracellular traps (NETs), can be leveraged for therapeutic delivery. Tannic acid nanoparticles tethered with anti-Ly6G antibody and interferon-β (aLy6G-IFNβ@TLP) are constructed for targeted neutrophil delivery. These nanoparticles protect interferon-β from reactive oxygen species and preferentially accumulate in neutrophils over other immune cells. Upon encountering inflammation, neutrophils release the nanoparticles during NET formation. In the female mouse model of experimental autoimmune encephalomyelitis, intravenous administration of aLy6G-IFNβ@TLP reduce disease progression and restore motor function. Although this study focuses on IFNβ and autoimmune encephalomyelitis, the concept of hitchhiking neutrophils for CNS delivery and employing NET formation for inflamed site-specific nanoparticle release can be further applied for delivery of other protein drugs in the treatment of neurodegenerative diseases.


Conflict of interest statement

Competing interests: The authors declare no competing interests.

Figures

Fig. 1
Fig. 1. Schematic illustration of NET formation-mediated cytokine delivery to the inflamed CNS.
a Schematic illustration of various nanoparticles tested in this study. TLP is a tannic acid core nanoparticle coated with lipid membranes. TLP was modified with IFNβ, anti-Ly6G antibody, or with both IFNβ and anti-Ly6G antibody, resulting in IFNβ@TLP, aLy6G@TLP, and aLy6G-IFNβ@TLP, respectively. For comparison, lipid nanoparticles modified with IFNβ and anti-Ly6G antibody, termed aLy6G-IFNβ@LP, were constructed. b Schematic illustration of NET formation-mediated IFNβ delivery to the inflamed CNS for ameliorating the experimental autoimmune encephalomyelitis (EAE). By binding to Ly6G on NEs, aLy6G-IFNβ@TLP can cross the BBB via NE hitchhiking and reach to the inflamed CNS. Upon activation by inflammatory factors, NET formation results in the release of aLy6G-IFNβ@TLP. Consequently, aLy6G-IFNβ@TLP can deliver IFNβ into the inflamed CNS, generating remyelination and immunomodulation effects against EAE.
Fig. 2
Fig. 2. Physicochemical and biological characteristics of nanoparticles.
a Preparation scheme of aLy6G-IFNβ@TLP. b EDS-SEM images of aLy6G-IFNβ@TLP. Scale bar: 50 nm. The experiment was repeated twice independently with similar results and the representative data is shown. c Particle size distribution of aLy6G-IFNβ@TLP measured by dynamic light scattering. d Zeta potential of aLy6G-IFNβ@TLP. e SDS-PAGE analysis of aLy6G conjugation on various formulations. The experiment was repeated twice independently with similar results and the representative data is shown. f Flow cytometry analysis of aLy6G conjugation on various formulations. g ROS scavenging effect of aLy6G-IFNβ@TLP. h Dose-dependent superoxide anion scavenging activity of aLy6G-IFNβ@TLP, assessed by nitro blue tetrazolium assay. i Dose-dependent hydroxyl radical scavenging activity of aLy6G-IFNβ@TLP, evaluated by terephthalic acid assay. j, k Dose-dependent superoxide anion scavenging activity (j) and hydroxyl radical scavenging activity (k) of aLy6G-IFNβ@LP. l Quantification of IC50 for superoxide anion scavenging activity (n = 3 independent samples per group). m Quantification of IC50 for hydroxyl radical scavenging activity (n = 3 independent samples per group). n Evaluation of intracellular ROS generation of NEs after PMA stimulation and nanoparticle treatment by chemiluminescence assay (n = 5 biologically independent samples per group). o Area under the curve (AUC) of chemiluminescence (n = 5 biologically independent samples per group). Statistical significance was analyzed using one-way ANOVA with Tukey’s multiple comparisons test. PaLy6G-IFNβ@TLP-Control < 0.0001, PaLy6G-IFNβ@TLP-aLy6G-IFNβ@LP < 0.0001. p Mean fluorescence intensity (MFI) of intracellular ROS upon PMA stimulation evaluated by flow cytometry (n = 5 biologically independent samples per group). Statistical significance was analyzed using one-way ANOVA with Tukey’s multiple comparisons test. PaLy6G-IFNβ@TLP-Control < 0.0001, PaLy6G-IFNβ@TLP-aLy6G-IFNβ@LP < 0.0001. q Underlying mechanism of denaturation and protection of IFNβ in aLy6G-IFNβ@LP and aLy6G-IFNβ@TLP under ROS-rich environment. r Determination of IFNβ stability released from aLy6G-IFNβ@LP and aLy6G-IFNβ@TLP in the absence and presence of H2O2 (n = 5 independent samples per group). Statistical significance was analyzed using unpaired two-sided t-test. At H2O2 0 μM, NS, not significant. At H2O2 10 μM, PaLy6G-IFNβ@TLP-aLy6G-IFNβ@LP < 0.0001. Data are presented as mean ± s.d. Source data are provided as a Source Data file. RFU, relative fluorescence unit. a.u., arbitrary units.
Fig. 3
Fig. 3. In vitro NE binding and NET formation-mediated release of nanoparticles.
a Schematic illustration of the in vitro BBB model for assessing NE binding and penetration ability of aLy6G-IFNβ@TLP across the endothelial monolayer. b Evaluation of NE binding capability of different formulations using flow cytometry. c Visualization of internalization of Fe-labeled nanoparticles in NEs using TEM. Scale bar: 2 μm. Scale bar of expanded images: 0.5 μm. The experiment was repeated twice independently with similar results and the representative data is shown. d Schematic illustration of nanoparticle-bound NEs migration across the endothelial monolayer in the presence of fMLP. e Migration of NEs and nanoparticle-treated NEs across the endothelial monolayer in the presence of fMLP (n = 5 biologically independent samples per group). Statistical significance was analyzed using one-way ANOVA with Tukey’s multiple comparisons test. NS, not significant. f Confocal images of nanoparticle-bound NEs in the filtrate. Scale bar: 20 μm. The experiment was repeated twice independently with similar results and the representative data is shown. g Confocal images of NET formation-mediated nanoparticle release after incubation with PMA for 4 h. Scale bar, 10 μm. The experiment was repeated twice independently with similar results and the representative data is shown. h Evaluation of colocalization of MPO with nanoparticles in the NET. i Pearson’s correlation coefficient of MPO with nanoparticles in the NETs (n = 5 biologically independent samples per group). Statistical significance was analyzed using one-way ANOVA with Tukey’s multiple comparisons test. PaLy6G-IFNβ@TLP-Control < 0.0001, PaLy6G-IFNβ@TLP-IFNβ@TLP < 0.0001. j Visualization of Fe-labeled aLy6G-IFNβ@TLP release during the process of NET formation by EDS-SEM. Scale bar: 2 μm. Scale bar of expanded images: 1 μm. The experiment was repeated twice independently with similar results and the representative data is shown. k TEM images of NET formation-induced aLy6G-IFNβ@TLP release in the NET. Scale bar: 2 μm for left panels, 0.5 μm for right panels. The experiment was repeated twice independently with similar results and the representative data is shown. l Experimental design for monitoring the process of PMA-induced NET formation and nanoparticle release. m Release of aLy6G-IFNβ@TLP and their colocalization with Hoechst were observed over time. NEs nuclei were stained with Hoechst 33342, and aLy6G-IFNβ@TLP were labeled with Cy5. Scale bar: 5 μm. The experiment was repeated twice independently with similar results and the representative data is shown. n The underlying mechanism of IFNβ release in the inflamed CNS. o Cumulative IFNβ release from aLy6G-IFNβ@TLP in PBS or FBS solution (n = 3 independent samples per group). Statistical significance was analyzed using unpaired two-sided t-test. PFBS-PBS = 0.0001. Data are presented as mean ± s.d. Source data are provided as a Source Data file.
Fig. 4
Fig. 4. Distribution of nanoparticles to the inflamed CNS.
a Ex vivo fluorescence imaging of brain and spinal cord in EAE mice following intravenous administration of IFNβ@TLP and aLy6G-IFNβ@TLP over time. b Whole-body molecular imaging of EAE mice at 6 h post-injection of IFNβ@TLP and aLy6G-IFNβ@TLP. Quantification of nanoparticle fluorescence in the brain (c) and spinal cord (d) of EAE mice after intravenous injection of different formulations over time (n = 5 biologically independent samples per group). Statistical significance was analyzed using unpaired two-sided t-test. For brain samples: 1 h, NS, not significant; 6 h, PaLy6G-IFNβ@TLP-IFNβ@TLP < 0.0001; 12 h, PaLy6G-IFNβ@TLP-IFNβ@TLP = 0.0039; 24 h, PaLy6G-IFNβ@TLP-IFNβ@TLP = 0.0165. For spinal cord samples: 1 h, PaLy6G-IFNβ@TLP-IFNβ@TLP = 0.0112; 6 h, PaLy6G-IFNβ@TLP-IFNβ@TLP < 0.0001; 12 h, PaLy6G-IFNβ@TLP-IFNβ@TLP < 0.0001; 24 h, PaLy6G-IFNβ@TLP-IFNβ@TLP < 0.0001. e Gating strategy for NEs in the spinal cord, stained with PerCP/Cy5.5-conjugated CD45, FITC-conjugated Ly6G, and PE-conjugated CD11b antibodies. f Representative flow cytometry histogram (left) and quantification (right) of MFI of nanoparticles taken up by NEs in the spinal cord 6 h post-administration (n = 5 biologically independent samples per group). Statistical significance was analyzed using unpaired two-sided t-test. PaLy6G-IFNβ@TLP-IFNβ@TLP = 0.0013. g Fluorescence images of the spinal cord after intravenous injection of nanoparticles for 6 h. Scale bar: 20 μm. The experiment was repeated twice independently with similar results and the representative data is shown. h Colocalization analysis of Ly6G-expressing cells and nanoparticles in the spinal cord. i t-SNE plot of single cells, color-coded according to the identified cell types. j t-SNE plots of nanoparticles taken up by T cells, APC, and NEs in the spinal cord, color-coded according to nanoparticle fluorescence intensity. k Experimental schedule for intravital imaging of spinal cord-infiltrated nanoparticles in EAE mice. l Intravital microscopy images of aLy6G-IFNβ@TLP-bound NEs migration into the spinal cord. Scale bar: 50 μm. The experiment was repeated twice independently with similar results and the representative data is shown. Data are presented as mean ± s.d. Source data are provided as a Source Data file.
Fig. 5
Fig. 5. Therapeutic effect of nanoparticles on EAE.
a Schematic illustration of the treatment schedule in the EAE mouse model. Mice were intravenously administered various nanoparticle formulations three times, with three days between each administration, starting from day 12 after EAE immunization. Therapeutic efficacy of various formulations assessed by changes in body weight (b) and clinical score (c) (n = 5 biologically independent samples per group). Statistical significance was analyzed using one-way ANOVA with Tukey’s multiple comparisons test. For body weight, PaLy6G-IFNβ@TLP-PBS < 0.0001, PaLy6G-IFNβ@TLP-IFNβ = 0.0011, PaLy6G-IFNβ@TLP-IFNβ@TLP = 0.0063, PaLy6G-IFNβ@TLP-aLy6G@TLP = 0.0082, PaLy6G-IFNβ@TLP-aLy6G-IFNβ@LP = 0.01. For clinical score, PaLy6G-IFNβ@TLP-PBS < 0.0001, PaLy6G-IFNβ@TLP-IFNβ = 0.0009, PaLy6G-IFNβ@TLP-IFNβ@TLP = 0.0009, PaLy6G-IFNβ@TLP-aLy6G@TLP < 0.0001, PaLy6G-IFNβ@TLP-aLy6G-IFNβ@LP = 0.002. Analysis of IL-17 (d), TNF-α (e), IFN-γ (f), and IL-6 (g) production levels of splenocytes after stimulation with MOG35-55 for 72 h at the end of the in vivo experiments (n = 5 biologically independent samples per group). Statistical significance was analyzed using one-way ANOVA with Tukey’s multiple comparisons test. For IL-17, PaLy6G-IFNβ@TLP-PBS < 0.0001, PaLy6G-IFNβ@TLP-IFNβ = 0.0001, PaLy6G-IFNβ@TLP-IFNβ@TLP < 0.0001, PaLy6G-IFNβ@TLP-aLy6G@TLP < 0.0001, PaLy6G-IFNβ@TLP-aLy6G-IFNβ@LP < 0.0001. For TNF-α, PaLy6G-IFNβ@TLP-PBS = 0.0057, PaLy6G-IFNβ@TLP-IFNβ = 0.0046, PaLy6G-IFNβ@TLP-IFNβ@TLP = 0.009, PaLy6G-IFNβ@TLP-aLy6G@TLP = 0.0049, PaLy6G-IFNβ@TLP-aLy6G-IFNβ@LP = 0.0153. For IFN-γ, PaLy6G-IFNβ@TLP-PBS = 0.0001, PaLy6G-IFNβ@TLP-IFNβ < 0.0001, PaLy6G-IFNβ@TLP-IFNβ@TLP = 0.0002, PaLy6G-IFNβ@TLP-aLy6G@TLP < 0.0001, PaLy6G-IFNβ@TLP-aLy6G-IFNβ@LP = 0.0002. For IL-6, PaLy6G-IFNβ@TLP-PBS = 0.0058, PaLy6G-IFNβ@TLP-IFNβ = 0.0042, PaLy6G-IFNβ@TLP-IFNβ@TLP = 0.0049, PaLy6G-IFNβ@TLP-aLy6G@TLP = 0.0018, PaLy6G-IFNβ@TLP-aLy6G-IFNβ@LP = 0.006. Determination of IFN-γ (h) and IL-17 (i) levels in the plasma at the end of the in vivo experiments (n = 5 biologically independent samples per group). Statistical significance was analyzed using one-way ANOVA with Tukey’s multiple comparisons test. For plasma IFN-γ, PaLy6G-IFNβ@TLP-PBS < 0.0001, PaLy6G-IFNβ@TLP-IFNβ < 0.0001, PaLy6G-IFNβ@TLP-IFNβ@TLP < 0.0001, PaLy6G-IFNβ@TLP-aLy6G@TLP < 0.0001, PaLy6G-IFNβ@TLP-aLy6G-IFNβ@LP < 0.0001. For plasma IL-17, PaLy6G-IFNβ@TLP-PBS < 0.0001, PaLy6G-IFNβ@TLP-IFNβ < 0.0001, PaLy6G-IFNβ@TLP-IFNβ@TLP = 0.0002, PaLy6G-IFNβ@TLP-aLy6G@TLP = 0.0003, PaLy6G-IFNβ@TLP-aLy6G-IFNβ@LP = 0.0002. j Analysis of mRNA expression levels in the spinal cord associated with the progression of EAE (n = 3 biologically independent samples per group). Data are presented as mean ± s.d. Source data are provided as a Source Data file.
Fig. 6
Fig. 6. Recovery of the CNS inflammation by nanoparticles.
Various nanoparticle formulations were intravenously administered 12 days after EAE immunization, repeating every three days for a total of three administrations. Spinal cord was collected and analyzed at 28 days post-immunization. a Representative flow cytometry data of Th1 in the spinal cord. b Relative quantification of Th1 in the spinal cord (n = 5 biologically independent samples per group). Statistical significance was analyzed using one-way ANOVA with Tukey’s multiple comparisons test. PaLy6G-IFNβ@TLP-PBS < 0.0001, PaLy6G-IFNβ@TLP-IFNβ < 0.0001, PaLy6G-IFNβ@TLP-IFNβ@TLP < 0.0001, PaLy6G-IFNβ@TLP-aLy6G@TLP < 0.0001, PaLy6G-IFNβ@TLP-aLy6G-IFNβ@LP < 0.0001. c Representative flow cytometry data of Th17 in the spinal cord. d Relative quantification of Th17 in the spinal cord (n = 5 biologically independent samples per group). Statistical significance was analyzed using one-way ANOVA with Tukey’s multiple comparisons test. PaLy6G-IFNβ@TLP-PBS < 0.0001, PaLy6G-IFNβ@TLP-IFNβ < 0.0001, PaLy6G-IFNβ@TLP-IFNβ@TLP < 0.0001, PaLy6G-IFNβ@TLP-aLy6G@TLP < 0.0001, PaLy6G-IFNβ@TLP-aLy6G-IFNβ@LP < 0.0001. Quantification of infiltrated helper T cells (CD45+CD3+CD4+) (e), cytotoxic T cells (CD45+CD3+CD8+) (f), DCs (CD45+CD11c+MHCII+) (g), and macrophages (CD45+CD11b+F4/80+) (h) in the spinal cord (n = 5 biologically independent samples per group). Statistical significance was analyzed using one-way ANOVA with Tukey’s multiple comparisons test. For helper T cells, PaLy6G-IFNβ@TLP-PBS = 0.0016, PaLy6G-IFNβ@TLP-IFNβ = 0.0021, PaLy6G-IFNβ@TLP-IFNβ@TLP = 0.0002, PaLy6G-IFNβ@TLP-aLy6G@TLP = 0.0005, PaLy6G-IFNβ@TLP-aLy6G-IFNβ@LP = 0.0004. For cytotoxic T cells, PaLy6G-IFNβ@TLP-PBS < 0.0001, PaLy6G-IFNβ@TLP-IFNβ = 0.0009, PaLy6G-IFNβ@TLP-IFNβ@TLP = 0.0014, PaLy6G-IFNβ@TLP-aLy6G@TLP = 0.0012, PaLy6G-IFNβ@TLP-aLy6G-IFNβ@LP = 0.0025. For DCs, PaLy6G-IFNβ@TLP-PBS = 0.0102, PaLy6G-IFNβ@TLP-IFNβ = 0.0226, PaLy6G-IFNβ@TLP-IFNβ@TLP = 0.0042, PaLy6G-IFNβ@TLP-aLy6G@TLP = 0.0043, PaLy6G-IFNβ@TLP-aLy6G-IFNβ@LP = 0.0175. For macrophages, PaLy6G-IFNβ@TLP-PBS = 0.0008, PaLy6G-IFNβ@TLP-IFNβ = 0.0003, PaLy6G-IFNβ@TLP-IFNβ@TLP = 0.0014, PaLy6G-IFNβ@TLP-aLy6G@TLP = 0.0003, PaLy6G-IFNβ@TLP-aLy6G-IFNβ@LP = 0.0015. i Representative CD45 staining in the spinal cord of EAE mice. Scale bar: 250 μm. Scale bar of expanded microscopic image: 125 μm. j Quantification of CD45-positive cells in three selected fields per sample from immunofluorescence images (n = 3 biologically independent samples per group). Statistical significance was analyzed using one-way ANOVA with Tukey’s multiple comparisons test. PaLy6G-IFNβ@TLP-PBS < 0.0001, PaLy6G-IFNβ@TLP-IFNβ@TLP < 0.0001, PaLy6G-IFNβ@TLP-aLy6G-IFNβ@LP = 0.0002. k Representative LFB staining of spinal cord revealing areas of myelination. Scale bar: 250 μm. Scale bar of expanded microscopic image: 125 μm. l Quantification of myelinated area from LFB staining images (n = 5 biologically independent samples per group). Statistical significance was analyzed using one-way ANOVA with Tukey’s multiple comparisons test. PaLy6G-IFNβ@TLP-PBS < 0.0001, PaLy6G-IFNβ@TLP-IFNβ@TLP < 0.0001, PaLy6G-IFNβ@TLP-aLy6G-IFNβ@LP < 0.0001. Data are presented as mean ± s.d. Source data are provided as a Source Data file.

References

    1. Ransohoff, R. M. & Engelhardt, B. The anatomical and cellular basis of immune surveillance in the central nervous system. Nat. Rev. Immunol.12, 623–635 (2012). - PubMed
    1. Wu, D. et al. The blood-brain barrier: structure, regulation, and drug delivery. Signal Transduct. Target Ther.8, 217 (2023). - PMC - PubMed
    1. Gasca-Salas, C. et al. Blood-brain barrier opening with focused ultrasound in Parkinson’s disease dementia. Nat. Commun.12, 779 (2021). - PMC - PubMed
    1. Chu, C. et al. Hyperosmolar blood-brain barrier opening using intra-arterial injection of hyperosmotic mannitol in mice under real-time MRI guidance. Nat. Protoc.17, 76–94 (2022). - PMC - PubMed
    1. Terstappen, G. C., Meyer, A. H., Bell, R. D. & Zhang, W. Strategies for delivering therapeutics across the blood-brain barrier. Nat. Rev. Drug Discov.20, 362–383 (2021). - PubMed

Publication types

MeSH terms

LinkOut - more resources