. 2024 Dec 30;15(1):10740.
doi: 10.1038/s41467-024-54512-7.

Cancer-specific innate and adaptive immune rewiring drives resistance to PD-1 blockade in classic Hodgkin lymphoma

Affiliations

Cancer-specific innate and adaptive immune rewiring drives resistance to PD-1 blockade in classic Hodgkin lymphoma

Julia Paczkowska et al. Nat Commun. .

Abstract

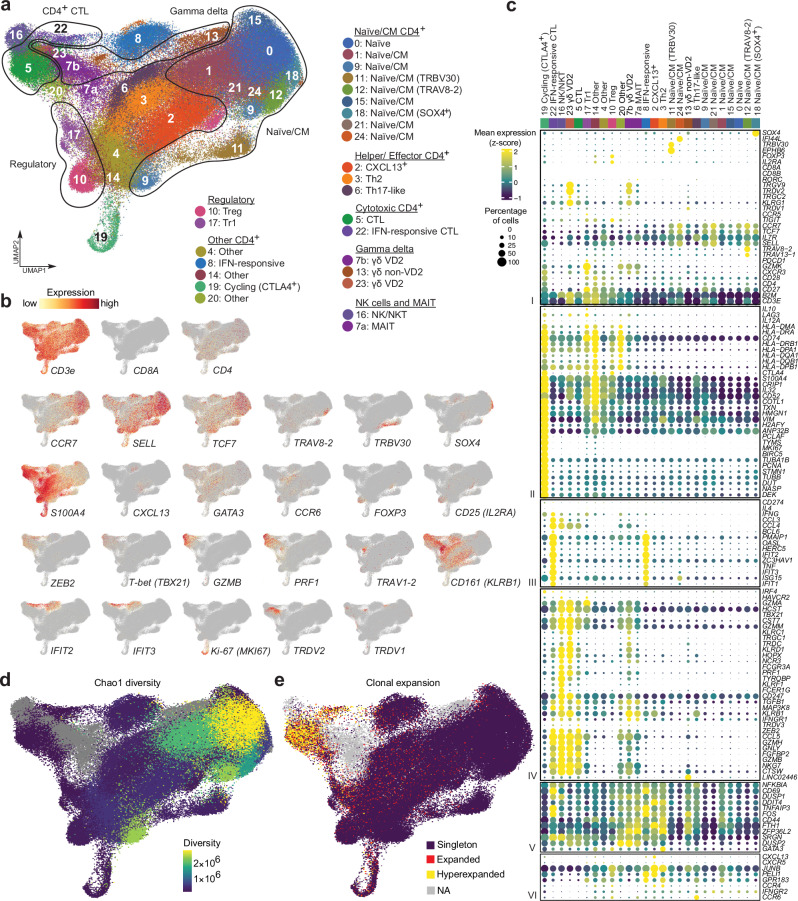
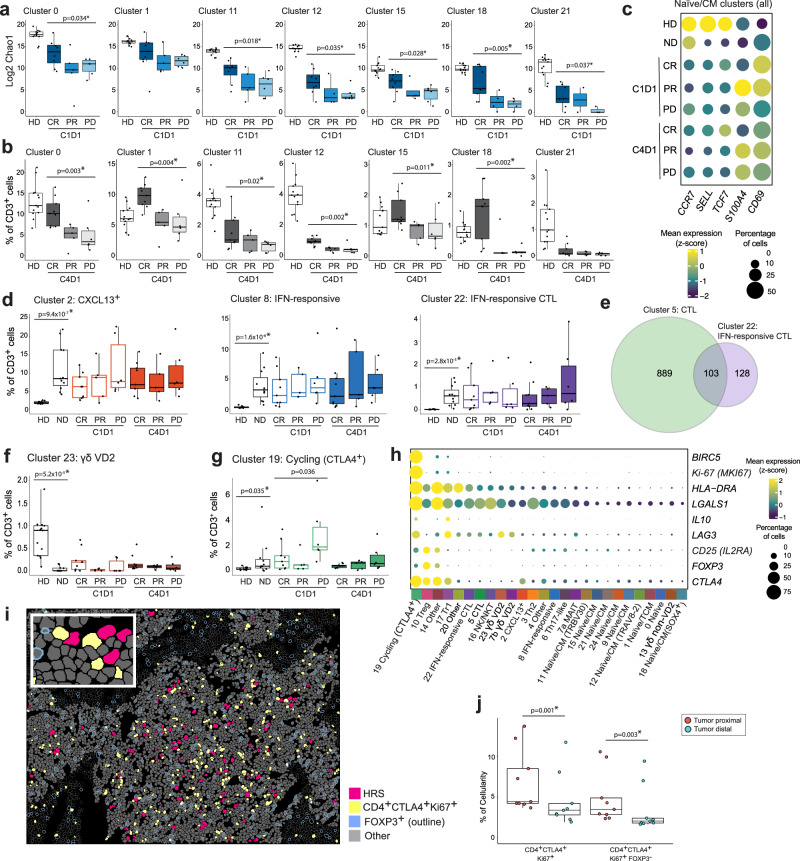
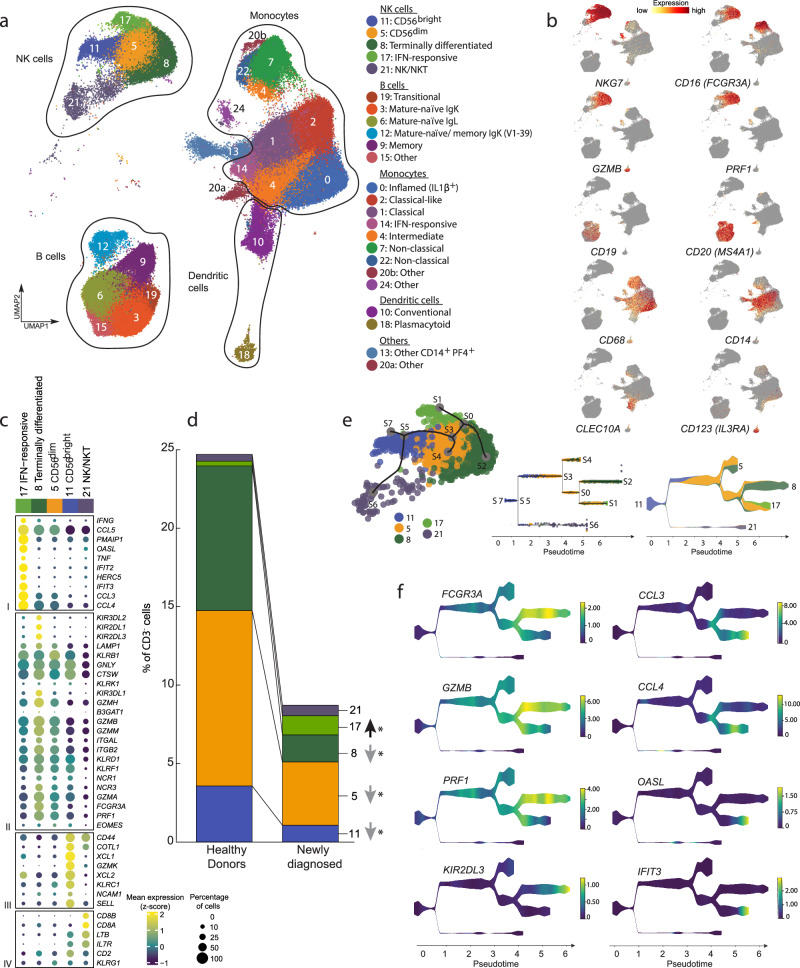
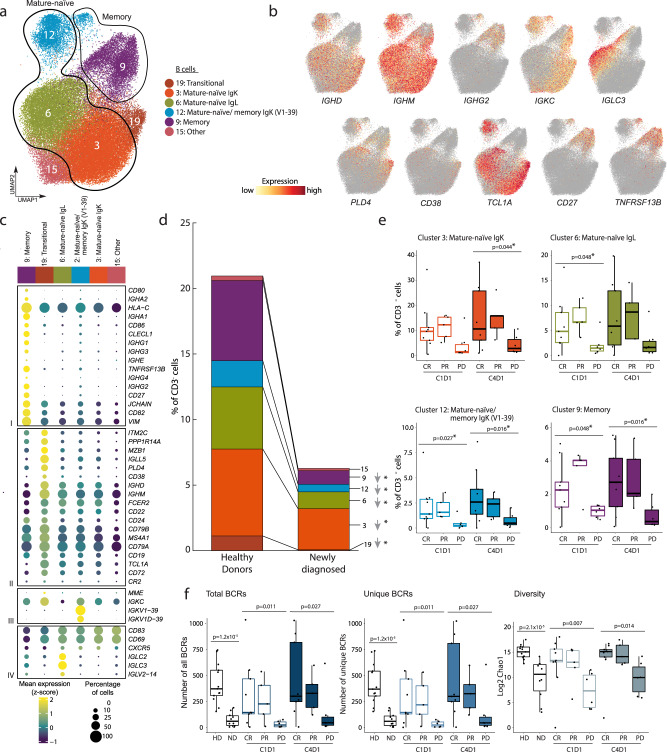
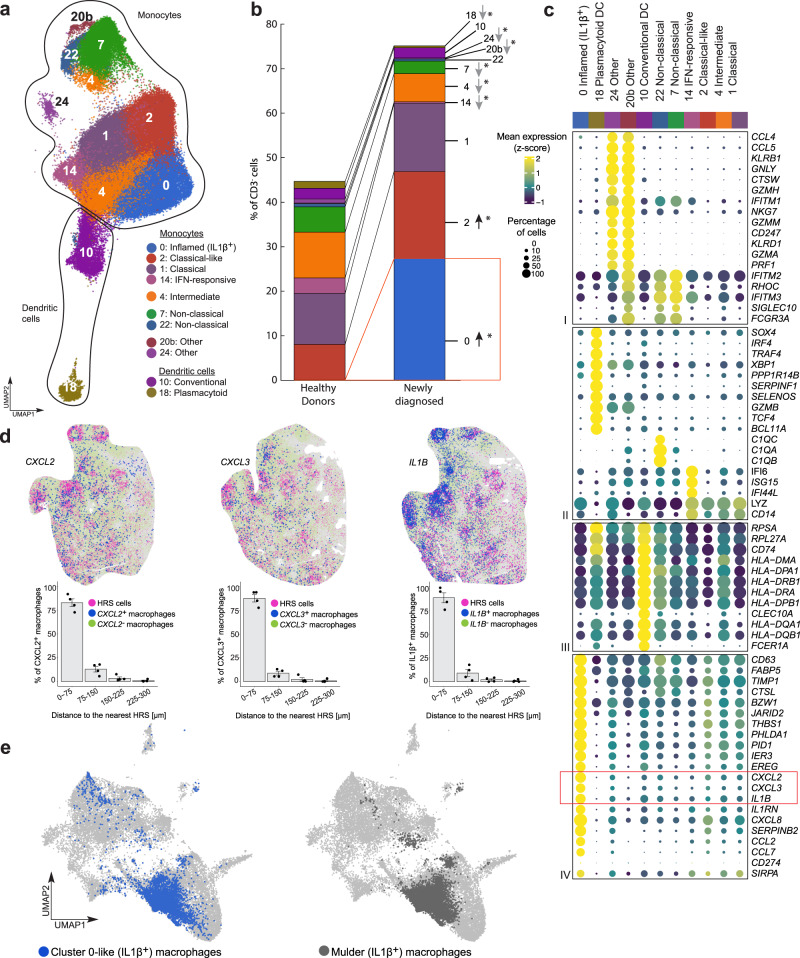
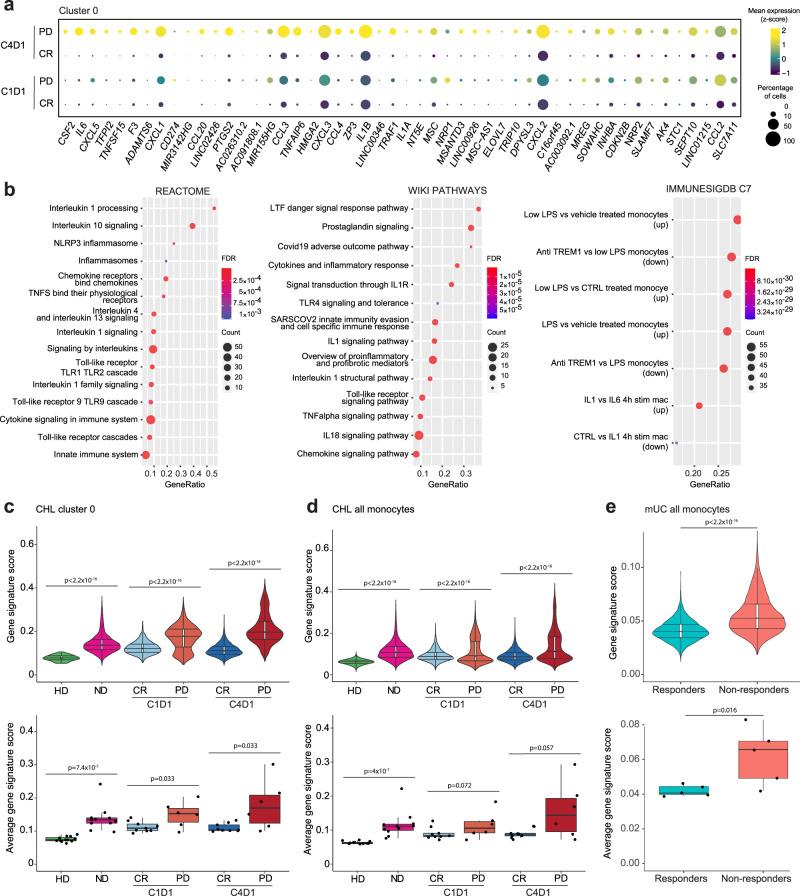
Hodgkin Reed-Sternberg (HRS) cells of classic Hodgkin lymphoma (cHL), like many solid tumors, elicit ineffective immune responses. However, patients with cHL are highly responsive to PD-1 blockade, which largely depends on HRS cell-specific retention of MHC class II and implicates CD4+ T cells and additional MHC class I-independent immune effectors. Here, we utilize single-cell RNA sequencing and spatial analysis to define shared circulating and microenvironmental features of the immune response to PD-1 blockade in cHL. Compared with non-responders, responding patients have more circulating CD4+ naïve and central memory T cells and B cells, as well as more diverse CD4+ T cell and B cell receptor repertoires. Importantly, a population of circulating and tumor-infiltrating IL1β+ monocytes/macrophages is detectable in patients with cHL but not healthy donors, and a proinflammatory, tumor-promoting signature of these circulating IL1β+ monocytes is associated with resistance to PD-1 blockade in cHL. Altogether, our findings reveal extensive immune rewiring and complementary roles of CD4+ T cells, B cells and IL1β+ monocytes in the response to PD-1 blockade and suggest that these features can be captured with a peripheral blood test.


Conflict of interest statement

Competing interests: M.T. is a full-time employee of Astra Zeneca. K.L. is a full-time employee of PathAI. F.Z.C. is a full-time employee of AstraZeneca. J.O. is a full-time employee of Bristol Myers Squibb. P.A. consults for Merck, Bristol Myers Squibb, A.D.C. Therapeutics, GenMab, Enterome, Genentech/Roche, ATB Therapeutics, Foresight Diagnostics, AstraZeneca, MSD, Tessa Therapeutics, Regeneron, Xencor, and receives institutional research funding from Merck, Bristol Myers Squibb, Genentech/Roche, KITE/Gilead, Adaptive Biotechnologies, IGM, AstraZeneca, MSD, Aamed Therapeutics and honoraria from Merck. S.J.R. receives institutional research funding from Bristol Myers Squibb, KITE/Gilead and is an advisory board member of Immunitas Therapeutics. X.S.L. is the founder and CEO of GV20 Therapeutics, LLC. M.A.S. has received research funding from Bristol Myers Squibb, AstraZeneca, Bayer Abbvie, Genentech and Novartis and has served on advisory boards for Bristol Myers Squibb and AstraZeneca. The remaining authors declare no competing financial interests. No authors have non-financial competing interests.

Figures

Fig. 1
Fig. 1. Analysis of circulating CD3+CD8- (CD4+ enriched) immune cell populations in healthy donors (HD), patients with newly diagnosed (ND) and relapsed/refractory (R/R) cHL.
a Annotated Uniform Manifold Approximation and Projection (UMAP) of CD3+CD8- single-cell expression profiles (n = 172,274 cells). Each cluster is labeled with a distinct color and unique number. b Feature plots of selected cell lineage and differentiation markers. c Dot plot with relative expression of selected genes in CD3+CD8- clusters following bidirectional clustering. Displayed genes were curated from the top differentially expressed genes that defined clusters using a two-sided Wilcoxon rank sum test, adjusted for multiple comparisons (adj p < 0.05, fold change > 1.75) and supplemented with relevant markers based on a priori knowledge. The size of the dot indicates the percentage of marker-expressing cells in each cluster and the z-score reflects mean marker expression across the clusters. d TCR repertoire diversity, as determined by Chao1 diversity index, obtained from single-cell TCR-seq data (n = 126,159 cells) for each T cell cluster and overlaid onto the UMAP. e TCR clonotypes expansion levels overlaid onto the UMAP (n = 126,159 cells), “Singleton” 1 clone, “Expanded” 2–5 clones, “Hyperexpanded” >5 clones. d, e Gamma delta T cell clusters (Cluster 7b, 13 and 23), MAIT (Cluster 7a) and NKT cells (Cluster 16) were not analyzed and are shown in gray.
Fig. 2
Fig. 2. Comparative analyses of CD3+CD8- (CD4+ enriched) clusters in healthy donors (HD), patients with newly diagnosed (ND) and relapsed/ refractory (R/R) cHL.
a TCR repertoire diversity, as determined by Chao1 diversity index, in CD4+ naïve/CM T cell clusters from HD (n = 13) and patients with R/R cHL at baseline [C1D1] stratified by the best overall response (BOR) to PD-1 blockade. CR Complete response, PR partial response, PD progressive disease. Number of patients with Chao1 diversity data per cluster: Cluster 0, HD (n = 13), CR (n = 8), PR (n = 5), PD (n = 6); Cluster 1, HD (n = 13), CR (n = 9), PR (n = 5), PD (n = 6); Cluster 11, HD (n = 13), CR (n = 8), PR (n = 5), PD (n = 6); Cluster 12, HD (n = 13), CR (n = 8), PR (n = 4), PD (n = 6); Cluster 15, HD (n = 13), CR (n = 8), PR (n = 4), PD (n = 6); Cluster 18, HD (n = 13), CR (n = 9), PR (n = 4), PD (n = 4); Cluster 21, HD (n = 13), CR (n = 7), PR (n = 2), PD (n = 3). b Relative abundance of CD4+ naïve/CM T cell clusters in HD (n = 13) and patients with R/R cHL on treatment [C4D1] (n = 20) stratified by BOR to PD-1 blockade, CR (n = 9), PR (n = 5), PD (n = 6). c Dot plot with relative expression of selected genes associated with T cell naïveté and activation in all CD4+ naïve/CM clusters (Cluster 0, 1, 9, 11, 12, 15, 18, 21, 24) in HD (n = 13), patients with ND cHL (n = 11) and patients with R/R cHL at baseline [C1D1] (n = 20) and C4D1 (n = 20), stratified by BOR. The size of the dot indicates the percentage of marker-expressing cells and the z-score reflects mean marker expression across cohorts. d Relative abundance of cHL-specific T cell populations. e Venn diagram illustrating the shared clonotypes between CD4+ CTLs (Cluster 5, n = 992 clonotypes) and IFN-responsive CD4+ CTLs (Cluster 22, n = 231 clonotypes) in patients with cHL. f, g Relative abundance of gamma delta VD2 T cells (Cluster 23) and cycling CTLA4+ T cells (Cluster 19). d, f, g HD (n = 13), ND (n = 11), C1D1 and C4D1: CR (n = 9), PR (n = 5), PD (n = 6). h Dot plot illustrating the mean expression (color) and percentage of cells (dot size) expressing genes that positively identified cycling CTLA4+ T cells (Cluster 19) in comparison to the additional CD3+CD8 clusters. i Cell segmentation and phenotype map for a representative multiplex IF image of ND cHL (magenta, HRS cells; yellow, CD4+CTLA4+Ki67+ cells; blue outline, FOXP3+ cells; gray-fill, Other cells less than 75 μm from HRS cells; gray-outline, Other cells greater than or equal to 75 μm from HRS cells). The experiment was performed in 9 ND cHL samples. j Relative abundance of CD4+CTLA4+Ki67+ and CD4+CTLA4+Ki67+FOXP3 cells in relation to HRS cells (red dots, less than 75 μm from HRS cells; blue dots, greater than or equal to 75 μm from the HRS cells) in patients with ND cHL (n = 9). The indicated nominal p values were calculated by using a two-sided paired T-test and adjusted for multiple comparisons using the Benjamini-Hochberg method; p values that remained significant are noted (*). a, b, d, f, g Differences between HDs and patients with ND cHL were assessed by a two-sided Wilcoxon rank-sum test. The one-sided Cuzick trend test was used to compare patients with R/R cHL by BOR (CRs, PRs and PDs). Nominal p values that were significant (p < 0.05) are listed and those that remained significant after Benjamini–Hochberg correction FDR < 0.1 are noted (*). a, b, d, f, g, j All box plots generated in R display the 25th and 75th percentiles (lower and upper hinges), median values, and whiskers. The whiskers extend from the hinges to the largest/smallest values within 1.5 times the interquartile range (IQR) from the hinge. Data points beyond the end of the whiskers are plotted individually. Source data are provided as a Source Data file.
Fig. 3
Fig. 3. Analysis of circulating CD3 immune cell populations in healthy donors (HD), patients with newly diagnosed (ND) and relapsed/refractory (R/R) cHL and detailed analysis of NK cell subsets.
a Annotated UMAP of CD3 single-cell expression profiles (n = 229,670 cells) by cell type. Each cluster is labeled with a distinct color and unique number, beginning with the most abundant cluster (Cluster 0). b Feature plots of selected cell lineage and differentiation markers. c Dot plot with relative expression of selected genes in NK cell clusters. Displayed genes were curated from the top differentially expressed genes that defined clusters using a two-sided Wilcoxon rank sum test, adjusted for multiple comparisons (adj p < 0.05, fold change > 1.75) and supplemented with relevant markers based on a priori knowledge. The size of the dot indicates the percentage of marker-expressing cells in each cluster and the z-score reflects mean marker expression across the clusters. d Relative abundance of NK cell clusters in HD (n = 13) and patients with ND cHL (n = 11). Differences between HD and patients with ND cHL were assessed by a two-sided Wilcoxon rank sum test. P values that remained significant after Benjamini–Hochberg correction FDR < 0.1 are noted (*). e Lineage trajectory analysis of NK cell populations (n = 40,844 cells) by STREAM overlaid on UMAP (left panel); Subway map plot (middle panel) showing all individual NK cells; Stream plot (right panel) visualization of cell density along different trajectories. At a given pseudotime, the width of each branch is proportional to the total number of cells. f Stream plots visualization of the selected marker genes, representing stages of NK cell maturation and/ or function. Source data are provided as a Source Data file.
Fig. 4
Fig. 4. Analysis of the circulating B cell populations in healthy donors (HD), patients with newly diagnosed (ND) and relapsed/refractory (R/R) cHL.
a Annotated UMAP of B cell clusters (n = 55,598 cells). Each cluster is labeled with a distinct color and unique number. b Feature plots of selected cell lineage and differentiation markers. c Dot plot with relative expression of selected genes in B cell clusters. Displayed genes were curated from the top differentially expressed genes that defined clusters using a two-sided Wilcoxon rank sum test, adjusted for multiple comparisons (adj p < 0.05, fold change >1.75) and supplemented with relevant markers based on a priori knowledge. The size of the dot indicates the percentage of marker-expressing cells in each cluster and the z-score reflects mean marker expression across the clusters. d Relative abundance of B cell clusters in HD (n = 13) and patients with ND cHL (n = 11). e Relative abundance of B cell clusters in patients with R/R cHL at baseline [C1D1] (n = 20) and C4D1 (n = 20), stratified by BOR to PD-1 blockade, CR (n = 9), PR (n = 5), PD (n = 6). f Number of total BCRs (left panel), number of unique BCRs (middle panel) and BCR repertoire diversity, as determined by Chao1 diversity index (right panel) in all B cells from HD (n = 13) and patients with ND cHL (n = 10) and R/R cHL at baseline [C1D1] (n = 20) and C4D1 (n = 20) stratified by BOR to PD-1 blockade. CR Complete response (n = 9), PR=partial response (n = 5), PD progressive disease (n = 6). df Differences between HD and patients with ND cHL were assessed by the two-sided Wilcoxon rank-sum test. The one-sided Cuzick trend test was used to compare patients with R/R cHL by response (CRs, PRs and PDs). d, e Nominal p values that were significant (p < 0.05) are listed and those that remained significant after Benjamini–Hochberg correction FDR < 0.1 are noted (*). In f p values are nominal with no Benjamini–Hochberg correction. e, f All box plots generated in R display the 25th and 75th percentiles (lower and upper hinges), median values, and whiskers. The whiskers extend from the hinges to the largest/smallest values within 1.5 times the interquartile range (IQR) from the hinge. Data points beyond the end of the whiskers are plotted individually. Source data are provided as a Source Data file.
Fig. 5
Fig. 5. Analysis of the circulating monocyte and dendritic cell populations in healthy donors (HD), patients with newly diagnosed (ND) and relapsed/refractory (R/R) cHL.
a Annotated UMAP of myeloid clusters (n = 126,707 cells). Each cluster is labeled with a distinct color and unique number. b Relative abundance of myeloid clusters between HD (n = 13) and patients with ND cHL (n = 11). Differences between HD and patients with ND cHL were assessed by the two-sided Wilcoxon rank-sum test. Nominal p values that remained significant after Benjamini–Hochberg correction with an FDR < 0.1 are noted (*). c Dot plot with relative expression of selected genes in monocyte and dendritic clusters. Displayed genes were curated from the top differentially expressed genes that defined clusters using a two-sided Wilcoxon rank sum test, adjusted for multiple comparisons (adj p < 0.05, fold change >1.75) and supplemented with relevant markers based on a priori knowledge. The size of the dot indicates the percentage of marker-expressing cells in each cluster and the z-score reflects mean marker expression across the clusters. d (Top panel) Cellular phenotype maps of the representative RNAscope images from patients with ND cHL (magenta, HRS cells; blue, Cluster 0-like macrophages CXCL2+ (left), CXCL3+ (middle) IL1B+(right); green, other macrophages CXCL2-/CXCL3-/IL1B-) (all images). The experiment was performed in 4 ND cHL samples. (Bottom panel) Proximity plots for the indicated CXCL2+, CXCL3+ and IL1+ Cluster 0-like macrophages and HRS cells. Data are presented as mean values +/− SEM. e UMAP showing Cluster 0-like (IL1β+) monocytes/macrophages (our data) (left panel, blue dots, n = 5783 cells) after cell label transfer to Mulder et al. (Immunity 54, 1883-1900 e1885 (2021)) data set (light grey dots, n = 60,691 cells), overlaid on the same UMAP. The right panel represents the IL1β+ monocytes and macrophages cluster from Mulder et al. (dark grey dots, n = 7985 cells). Source data are provided as a Source Data file.
Fig. 6
Fig. 6. Identification of IL1β+ monocyte transcriptional signature associated with lack of response to PD-1 blockade.
a Differential expression analysis of response-related Cluster 0 transcripts in patients with relapsed/refractory (R/R) cHL who achieved a complete response (CR) or progressed on PD-1 blockade (PD). A two-sided permutation test, adjusted for multiple comparisons (adj p < 0.1, fold change > 1.5) was used to filter the differentially expressed Cluster 0 genes in patients who achieved a CR or progressed on therapy at C4D1. The top 50 of 368 differentially expressed genes are shown for patients by response at C4D1 and baseline C1D1. b Pathway enrichment analysis of response-related differentially expressed genes in Cluster 0 using Molecular Signatures Database (MSigDB) gene sets: CP:REACTOME: Reactome gene sets; CP:WIKIPATHWAYS: WikiPathways gene sets; and C7: Immunologic gene sets. Gene Ratio (x-axis) represents the number of genes in the AUCell signature over the total number of genes in a given gene set; FDR significant < 0.05; Count represents the number of genes in the overlap between the AUCell gene signature and given gene set. c AUCell signature score in circulating Cluster 0 monocytes from healthy donors (HD) and patients with newly diagnosed cHL (ND) or R/R cHL at C1D1 and C4D1 at the single-cell (upper panel: HD n = 73 cells; ND n = 8266 cells; CR C1D1 n = 3942 cells; PD C1D1 n = 2390 cells; CR C4D1 n = 5403 cells; PD C4D1 n = 4335 cells) and per-patient (lower panel: HD n = 12 samples; ND n = 11 samples; CR C1D1 n = 9 samples; PD C1D1 n = 6 samples; CR C4D1 n = 9 samples; PD C4D1 n = 5 samples) levels. d AUCell signature score in all circulating monocytes from HDs and patients with cHL at the single-cell (upper panel: HD n = 28,001 cells; ND n = 20,633 cells; CR C1D1 n = 16,851 cells; PD C1D1 n = 7464 cells; CR C4D1 n = 17,343 cells; PD C4D1 n = 10,999 cells) and per-patient (lower panel: HD n = 13 samples; ND n = 11 samples; CR C1D1 n = 9 samples; PD C1D1 n = 6 samples; CR C4D1 n = 9 samples; PD C4D1 n = 5 samples) levels. e AUCell signature score in all circulating monocytes from patients with metastatic urothelial carcinoma (mUC) (Yuen et al. Nat Med 26, 693-698 (2020)) at baseline (C1D1), stratified by the subsequent response to PD-L1 blockade, at the single-cell (upper panel: Responders n = 3718 cells, Non-responders n = 4134 cells) and per-patient (lower panel: Responders n = 5 samples, Non-responders n = 5 samples) levels. ce A one-sided Wilcoxon rank-sum test was used to assess the distributions of AUCell gene signature scores between HD and ND, as well as between CR and PD at C1D1 and C4D1, at both the single-cell and per-patient levels. ce (upper panel) All violin plots generated in R illustrate the data distribution with kernel density estimation. Plots display the 25th and 75th percentiles (lower and upper hinges) and median values. The width of the violin at different points reflects the density of the data. (upper panels) All box plots display the 25th and 75th percentiles (lower and upper hinges), median values, and whiskers. The whiskers extend from the hinges to the largest/smallest values within 1.5 times the interquartile range (IQR) from the hinge. Data points beyond the end of the whiskers are plotted individually. Source data are provided as a Source Data file.

References

    1. Weniger, M. A. & Kuppers, R. Molecular biology of Hodgkin lymphoma. Leukemia35, 968–981 (2021). - PMC - PubMed
    1. Green, M. R. et al. Integrative analysis reveals selective 9p24.1 amplification, increased PD-1 ligand expression, and further induction via JAK2 in nodular sclerosing Hodgkin lymphoma and primary mediastinal large B cell lymphoma. Blood116, 3268–3277 (2010). - PMC - PubMed
    1. Roemer, M. G. et al. PD-L1 and PD-L2 genetic alterations define classical Hodgkin lymphoma and predict outcome. J. Clin. Oncol.34, 2690–2697 (2016). - PMC - PubMed
    1. Wienand, K. et al. Genomic analyses of flow-sorted Hodgkin Reed-Sternberg cells reveal complementary mechanisms of immune evasion. Blood Adv.3, 4065–4080 (2019). - PMC - PubMed
    1. Ansell, S. M. et al. Nivolumab for relapsed/refractory classical Hodgkin lymphoma: 5-year survival from the pivotal phase 2 CheckMate 205 study. Blood Adv. 2023;7(20):6266-6274. Blood Adv.8, 829–831 (2024). - PMC - PubMed

MeSH terms