. 2024 Dec 30;15(1):10733.
doi: 10.1038/s41467-024-54180-7.

Immune checkpoint inhibitor-induced severe epidermal necrolysis mediated by macrophage-derived CXCL10 and abated by TNF blockade

Affiliations

Immune checkpoint inhibitor-induced severe epidermal necrolysis mediated by macrophage-derived CXCL10 and abated by TNF blockade

Chun-Bing Chen et al. Nat Commun. .

Abstract

Immune checkpoint inhibitors (ICI) represent new anticancer agents and have been used worldwide. However, ICI can potentially induce life-threatening severe cutaneous adverse reaction (SCAR), such as Stevens-Johnson syndrome/toxic epidermal necrolysis (SJS/TEN), hindering continuous ICI therapy. We examine 6 cohorts including 25 ICI-induced SJS/TEN patients and conduct single-cell RNA sequencing (scRNA-seq) analysis, which shows overexpression of macrophage-derived CXCL10 that recruits CXCR3+ cytotoxic T lymphocytes (CTL) in blister cells from ICI-SJS/TEN skin lesions. ScRNA expression profiles and ex vivo blocking studies further identify TNF signaling as a pathway responsible for macrophage-derived CXCL10 and CTL activation. Based on the trajectory analysis, ICI-activated T cells from whole blood are proposed to serve as the initial cells involved in inflammation, that lead to monocytes differentiating into macrophages and increasing their susceptibility to migrate to the lesion sites. Compared with systemic corticosteroids treatment, ICI-induced SJS/TEN patients treated with biologic TNF blockade showed a significantly rapid recovery and no recurrence of SCAR with continuous ICI therapy. Our findings identify that macrophage-eliciting CTL contribute to the pathogenesis of ICI-induced epidermal necrolysis and provide potential therapeutic targets for the management and prevention of SCAR induced by ICI therapy.


Conflict of interest statement

Competing interests: The authors declare no competing interests.

Figures

Fig. 1
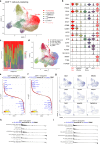
Fig. 1. Immunophenotypic analysis of patients with ICI-induced SJS/TEN, ICI-induced mild cADR, and control participants.
a Workflow showing sample collection and processing for 10X Genomics single-cell RNA sequencing (scRNA-seq) and the confirmation of results by flow cytometry, ex vivo lymphocyte activation test (LAT), BD Rhapsody scRNA-seq, ELISA/cytokine array, NanoString RNA-seq, and immunofluorescence assay performed in this study. Lesional blister cells (lesional BC) or peripheral blood mononuclear cells (PBMC) were obtained from enrolled patients with immune-related adverse events (irAEs) or control participants. b Characteristics of the participants enrolled in this study, such as groups with “immune checkpoint inhibitor (ICI)-cADR” (including ICI-induced Stevens-Johnson syndrome/toxic epidermal necrolysis [SJS/TEN], ICI-induced mild cADR) and “Control participants” (including small molecule drug-induced SJS/TEN, ICI-tolerant patients treated with ICI for at least 6 months with no evidence of drug-induced hypersensitivity reactions, burn patients, and healthy donors [HD] with no cADR history). Detailed clinical information can be found in Supplementary Table 1. c Representative clinical pictures of skin detachment for patients with ICI-induced SJS/TEN are shown. Other pictures of ICI-induced SJS/TEN (e.g., oral mucosal involvement and ocular injury) and ICI-induced mild cADR (lichenoid dermatitis) can be found in Supplementary Fig. 1a–l. d The identification of all cell clusters following 10X Genomics scRNA-seq of lesional BC and PBMC samples from patients with ICI-induced SJS/TEN, mild cADR and control participants (including lesional BC from 5 patients with ICI-induced SJS/TEN, PBMC from 5 the same patients with ICI-induced SJS/TEN, PBMC from 1 patient with an ICI-induced mild cADR [lichenoid dermatitis], and 5 each of sex-, age-matched ICI-tolerant patients and 6 of sex-, age-matched HD). A total of 115,327 cells are analyzed. e Violin plots show the expression of canonical marker genes across different clusters; the y-axis represents normalized values of marker gene expression (detailed gene expression profiles for different clusters can be found in Supplementary Fig. 1m). f Frequencies of cells in each cluster for each enrolled patient with ICI-cADR and control participants. ISB indicates ICI-induced SJS/TEN lesional BC; ISP indicates ICI-induced SJS/TEN PBMC; IMP indicates ICI-induced mild cADR (lichenoid dermatitis) PBMC; ITP indicates ICI-tolerant PBMC; HD indicates HD PBMC. g Distributions of all cell clusters colored for different groups of enrolled ICI-cADR patients and control participants. ISB: 18,010 cells; ISP: 22,156 cells; IMP: 6,354 cells; ITP: 34,477; HD: 34,330 cells. Figure 1a created with BioRender.com, released under a Creative Commons Attribution-NonCommercial-NoDerivs 4.0 International license.
Fig. 2
Fig. 2. ICI-induced SJS/TEN–related changes in macrophage/monocyte/myeloid cell functions and gene expression profiles.
a Sub-clustering of macrophage/monocyte/myeloid cells selected from patients with ICI-induced SJS/TEN, ICI-induced mild cADR, and control participants. A total of 31,046 cells were defined as macrophage/monocyte/myeloid cells by SingleR annotation and well-studied marker genes. b Violin plots display the marker genes of macrophage/monocyte/myeloid cell clusters. For each cluster, the selected top 10 genes of the highest expression levels with cell type–specificity score, and a highly expressed well-defined subset marker are shown. The y-axis represents normalized values for different gene expression levels (detailed gene expression profiles for different clusters are presented in Supplementary Fig. 2a). c Frequencies of macrophage/monocyte/myeloid cells in each cluster for each enrolled patient with ICI-cADR and control participants. ISB: ICI-induced SJS/TEN lesional BC; ISP: ICI-induced SJS/TEN PBMC; IMP: ICI-induced mild cADR PBMC; ITP: ICI-tolerant PBMC; HD: healthy donors PBMC. d Distributions of macrophage/monocyte/myeloid cells across clusters among patients with ICI-cADR patients and control participants. Numbers of cells defined as macrophage/monocyte/myeloid cells by group were ISB: 5579 cells; ISP: 7558 cells; IMP: 984 cells; ITP: 3247 cells; HD: 13,678. e Ranking of the significant and relevant differentially expressed genes (DEG) in macrophage/monocyte/myeloid cells comparing between ICI-SJS/TEN lesional BC and HD PBMC. f Ranking of the significant and relevant DEG in macrophage/monocyte/myeloid cells comparing between ICI-SJS/TEN lesional BC and ICI-tolerant (tolerant) PBMC. The significance of DEG was defined a using a two-sided non-parametric Wilcoxon rank-sum test and Bonferroni correction. g Functional enrichment analysis of significant and relevant hallmark gene sets identified as differentially expressed genes in macrophage/monocyte/myeloid cells comparing between ICI-SJS/TEN lesional BC and HD PMBC. NES, normalized enrichment score. h Functional enrichment analysis of significant and relevant hallmark gene sets identified as differentially expressed in macrophage/monocyte/myeloid cells comparing between ICI-SJS/TEN lesional BC and ICI-tolerant (tolerant) PMBC. All significant the significant and relevant differentially expressed genes and hallmark gene sets are shown in the source data.
Fig. 3
Fig. 3. ICI-induced SJS/TEN–related changes in CD8+ T cells and gene expression profiles.
a Sub-clustering of CD8+ T cells selected from patients with ICI-induced SJS/TEN, ICI-induced mild cADR, and control participants. A total of 29,134 cells were defined as CD8+ T cells by SingleR annotation and well-studied marker genes. CM: central memory T cells; MAIT: mucosa-associated invariant T cells; Trm: tissue-resident memory T cells. b Violin plots display marker genes for CD8+ T cell clusters. For each cluster, the selected top 10 genes of the highest expression levels with cell type–specificity score, and a highly expressed well-defined subset marker are shown. The y-axis represents the normalized values for gene expression (detailed gene expression profiles for different clusters can be found in Supplementary Fig. 3a). c Frequencies of CD8+ T cells in each cluster for each enrolled patient with ICI-cADR and control participant. ISB: ICI-induced SJS/TEN lesional BC; ISP: ICI-induced SJS/TEN PBMC; IMP: ICI-induced mild cADR (lichenoid dermatitis) PBMC; ITP: ICI-tolerant PBMC; HD: healthy donors PBMC. d Distributions of CD8+ T cells across clusters from ICI-cADR patients and control participants. CD8+ T cell numbers according to group were ISB: 6388 cells; ISP: 4462 cells; IMP: 1570 cells; ITP: 10,319 cells; HD: 6395 cells. e Ranking of the significant and relevant differentially expressed genes (DEG) in CD8+ T cells comparing between ICI-SJS/TEN lesional BC and HD PBMC. f Ranking of the significant and relevant DEG in CD8+ T cells comparing between ICI-SJS/TEN lesional BC and ICI-tolerant (tolerant) PBMC. The significance of DEG was defined a using a two-sided non-parametric Wilcoxon rank-sum test and Bonferroni correction. g The expression patterns of cytotoxic proteins, co-inhibitory receptors, and tumor necrosis factor receptor (TNFR) in UMAP of CD8+ T cell sub-clusters. h Functional enrichment analysis of significant and relevant hallmark gene sets identified as differentially expressed in CD8+ T cells comparing between ICI-SJS/TEN lesional BC and HD PMBC. NES, normalized enrichment score. i Functional enrichment analysis of significant and relevant hallmark gene sets identified as differentially expressed in CD8+ T cells comparing between ICI-SJS/TEN lesional BC and ICI-tolerant (tolerant) PBMC. All significant the significant and relevant differentially expressed genes and hallmark gene sets are shown in the source data.
Fig. 4
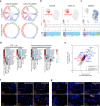
Fig. 4. The connectivity between CD8+ T cells and macrophage/monocyte/myeloid cells in patients with ICI-induced SJS/TEN and mild cADR.
a Analysis of chemokine receptor–ligand pairs (CXCR3–CXCL9 and CXCR3–CXCL10) across clusters in all cell datasets shown in Fig. 1d. The “ICI-SJS/TEN” group includes lesional BC and PBMC from 5 patients with ICI-induced SJS/TEN patients, and the “ICI-tolerant & HD” group includes PBMC from 5 ICI-tolerant patients and 6 healthy donors (HD). b The scaled and normalized gene expression levels for CXCL9 and CXCL10 in all cell datasets (related to Fig. 1d) was shown, whereas the violin plot and heatmap beneath was drawn from the subset of macrophage/monocyte/myeloid clusters. c The scaled and normalized expression levels of CXCR3 in all cell datasets (related to Fig. 1d) were shown, whereas the violin plot and heatmap beneath were drawn from the subset of CD8+ T cell clusters. ISB: ICI-SJS/TEN lesional BC; ISP: ICI-SJS/TEN PBMC; IMP: ICI-mild cADR PBMC; ITP: ICI-tolerant PBMC; HD: healthy donors PBMC. d Heatmap showing Z score–normalized averaged expression levels of the indicated cytokines/cytotoxic proteins/inflammatory proteins and its related receptor genes compared among ICI-SJS/TEN, ICI-mild cADR, and control groups. The normalized differential gene expression (DEG) levels in CD8+ T cell clusters (clusters 3–7 in Fig. 1d; defined by SingleR annotation) and macrophage/monocyte/myeloid clusters (clusters 9–14 in Fig. 1d; defined by SingleR annotation) were shown. The indicated relevant genes list is based on the significant P values for ICI-SJS/TEN lesional BC group comparing to “ICI-tolerant & HD” group, which were calculated by Wilcoxon rank-sum test. The genes associated with the TNF signaling pathway were denoted in a red color. e Scatterplot showing DEG, confirming RNA expression levels in formalin-fixed paraffin-embedded (FFPE) skin tissue samples from patients with ICI-induced SJS–TEN (ICI-SJS/TEN; n = 5) or ICI-induced lichenoid dermatitis (ICI-mild cADR; n = 7) compared with those from HD (HD; n = 8). Each dot denotes an individual gene with a Benjamini–Hochberg-adjusted P value (two-sided unpaired Mann–Whitney U test) <0.05 and average log2 fold change (FC) > 2 in ICI-SJS/TEN samples compared with HD samples (ICI-SJS/TEN vs. HD) and in ICI-mild cADR samples compared with HD samples (ICI-mild cADR vs. HD). The blue-labeled genes represent genes that were significantly elevated in both the ICI-SJS/TEN vs. HD and ICI-mild cADR vs. HD comparisons, whereas the red-labeled genes were only significantly elevated in the ICI-SJS/TEN vs. HD comparison. f Immunofluorescence staining with anti-CD8 (green) and anti-CXCR3 (red) antibodies, and 4’,6-diamidino-2-phenylindole (DAPI; nuclear stain; blue) in skin tissues from 7 patients with ICI-SJS/TEN and 4 ICI-mild cADR and from 4 HD control participants (sample list shown in source data). The upper figures represent 200×, whereas the lower figures represent 400× magnification. g Immunofluorescence staining with anti-CXCL10 (green) and anti-CD163 (red) antibodies and DAPI (blue). The upper figures represent 200×, whereas the lower figures represent 400× magnification.
Fig. 5
Fig. 5. The expressions of TNF and CXCL9/CXCL10-CXCR3-axis in patients with ICI-induced SJS/TEN and mild cADR.
a The secretion of CXCL10, TNF, GNLY, and GZMB were measured by ELISA in the blister fluids of 6 patients with ICI-SJS/TEN and 15 burn patients (Burns). b Plasma expression levels of CXCL10, CXCL9, TNF, IFN-γ, IL-6, IL-8, GNLY, and GZMB were measured by cytokine array or ELISA in 8 patients with ICI-induced SJS/TEN (ICI-SJS/TEN), 32 patients with ICI-induced mild cADR (ICI-mild cADR), and 9 control participants (Ctrl; including 4 participants with ICI-tolerant and 5 with HD). Plasma from patients with ICI-induced cADR were obtained during the acute stage of cADR phenotypes. Data in (a) and (b) are presented as the mean ± SD. P values were calculated by a two-sided unpaired Mann–Whitney U test. *P < 0.05, **P < 0.01, ***P < 0.001.
Fig. 6
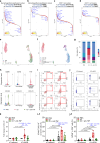
Fig. 6. The different immune mechanism of ICI-induced SJS/TEN versus drug-induced SJS/TEN, and ex vivo lymphocyte activation test upon ICI stimulation can be suppressed by biologic anti-tumor necrosis factor (TNF) agent.
a scRNA-seq were performed for lesional BC and PBMC samples from 5 patients with ICI-induced SJS/TEN and 3 patients with drug-induced SJS/TEN. Ranking of the significant and relevant differentially expressed genes (DEG) in macrophage/monocyte/myeloid cells comparing between ICI-SJS/TEN lesional BC and drug-induced SJS/TEN lesional BC. b Ranking of the significant and relevant DEG in macrophage/monocyte/myeloid cells comparing between ICI-SJS/TEN PBMC and drug-SJS/TEN PBMC. c Ranking of the significant and relevant DEG in CD8+ T cells comparing between ICI-SJS/TEN lesional BC and drug-SJS/TEN lesional BC. d Ranking of the significant and relevant DEG in CD8+ T cells comparing between ICI-SJS/TEN PBMC and drug-SJS/TEN PBMC. e scRNA-seq analysis of PBMC collected during the recovery stage of a patient with ICI-induced SJS/TEN (ICI-SJS/TEN-1) after ex vivo culture with phosphate-buffered saline (PBS, solvent control), ICI stimulation (ICI), and ICI plus anti-TNF (ICI+anti-TNF). f Identification of cell clusters across sample groups. g Frequencies of different immune cells in each cluster across groups treated with PBS, ICI, and ICI+anti-TNF. The Violin plots display canonical marker genes for these immune cell clusters are shown in Supplementary Fig. 11. h Violin plots display the expression of selected ICI-induced SJS/TEN-associated genes, including GZMB, CD163, TNF, CXCR3, and CXCL10, in CD8+ T cell or macrophage/monocyte cell clusters after ex vivo culture. i The macrophage/monocyte phenotype after ex vivo culture was measured by flow cytometric assay. The percentage of CD163+CXCL10+ cells was determined in CD14+ monocyte cells (detailed gating information for flow cytometric assay is shown in Supplementary Fig. 12). i-1 The populations of CD163+CXCL10+ cells in CD14+ monocytes after ex vivo treatment. j Cytotoxic CD8+ T cell phenotypes after ex vivo culture were measured. GranzymeB (GZMB)+ cells were determined in CD8+ T cells (detailed gating information for the flow cytometric assay is shown in Supplementary Fig. 12). j-1 The populations of GZMB+ cells in CD8+ T cells identified in PBMC after ex vivo treatment are shown. k Expression levels of CXCL10 in ex vivo cultured supernatant were detected. The significance of DEG was defined a using a two-sided non-parametric Wilcoxon rank-sum test and Bonferroni correction. Data in (ij) are presented with boxplot showing individual data points, the first quartile, the median, and the third quartile. A black * indicates that P values were calculated by two-sided unpaired Mann–Whitney U test; a blue * indicates that P values were calculated by two-sided paired Wilcoxon matched-pairs signed-rank test.
Fig. 7
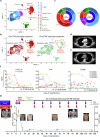
Fig. 7. Anti-TNF therapy improved patients with ICI-induced SJS/TEN and prevented the recurrence of ICI-induced SJS/TEN during re-challenging with ICI therapy with concurrent TNF blockade.
a 10X Genomic single-cell RNA sequencing (scRNA-seq) analysis in PBMC from three patients with ICI-induced SJS-TEN. UMAP plot generated from a merged dataset of the three patients with ICI-SJS/TEN pre- and post-TNF blockade treatment (total n = 31,904 cells). b UMAP plots segregated according to cellular origin. Dark red indicates the cell clusters before TNF blockade, whereas green indicates those after TNF blockade. Dotted regions highlight cytotoxic cells (including CD8+ T cells and NK/NKT cells) and myeloid/monocyte clusters both before and after TNF blockade. c Pie charts of three ICI-SJS/TEN patients showing relative cluster abundances before and after TNF blockade. The populations of total myeloid/monocyte cells before and after TNF blockade are shown in red. d, e Tumor images in the ICI-induced SJS-TEN overlapping case (ICI-SJS/TEN-1) with metaplastic breast carcinoma were evaluated by computed tomography (CT), revealing a durable complete response after recovery from the SJS/TEN episode. The red arrow indicates the tumor location. f Serial plasma CXCL10, TNF, and GZMB levels in 6 available patients with ICI-induced SJS/TEN during the clinical course from acute to late recovery stages. Day 1 on the horizontal axis is defined as the first day of hospitalization. The arrow in each line chart indicates TNF blockade (etanercept) administration. * of CXCL10 level represent P value calculated by two-sided paired Wilcoxon matched-pairs signed-rank test. g Clinical course, skin presentation, main tumor evaluation by CT, and serial plasma CXCL10 and TNF levels for one patient with ICI-induced SJS/TEN (ICI-SJS/TEN-15) who tolerated to continuous the same type of ICI immunotherapy combined with concurrent TNF blockade. Day 1 on the horizontal axis is defined as the first day of hospitalization. The blue arrow indicates TNF blockade (etanercept) administration time points, and the red arrow indicates the ICI (atezolizumab) treatment and re-challenge time points. The dotted line, arrow range, and values in the CT image indicate the tumor size.

Similar articles

Cited by

References

    1. Reck, M. et al. Pembrolizumab versus chemotherapy for PD-L1-positive non-small-cell lung cancer. N. Engl. J. Med.375, 1823–1833 (2016). - PubMed
    1. Ribas, A. et al. Pembrolizumab versus investigator-choice chemotherapy for ipilimumab-refractory melanoma (KEYNOTE-002): a randomised, controlled, phase 2 trial. Lancet Oncol.16, 908–918 (2015). - PMC - PubMed
    1. Weber, J. S. et al. Nivolumab versus chemotherapy in patients with advanced melanoma who progressed after anti-CTLA-4 treatment (CheckMate 037): a randomised, controlled, open-label, phase 3 trial. Lancet Oncol.16, 375–384 (2015). - PubMed
    1. Davar, D. & Kirkwood, J. M. PD-1 immune checkpoint inhibitors and immune-related adverse events: understanding the upside of the downside of checkpoint blockade. JAMA Oncol.5, 942–943 (2019). - PubMed
    1. Ramos-Casals, M. et al. Immune-related adverse events of checkpoint inhibitors. Nat. Rev. Dis. Prim.6, 38 (2020). - PMC - PubMed

Publication types

MeSH terms

Associated data