. 2024 Dec 30;15(1):10737.
doi: 10.1038/s41467-024-54651-x.

NOS inhibition sensitizes metaplastic breast cancer to PI3K inhibition and taxane therapy via c-JUN repression

Affiliations

NOS inhibition sensitizes metaplastic breast cancer to PI3K inhibition and taxane therapy via c-JUN repression

Tejaswini Reddy et al. Nat Commun. .

Abstract

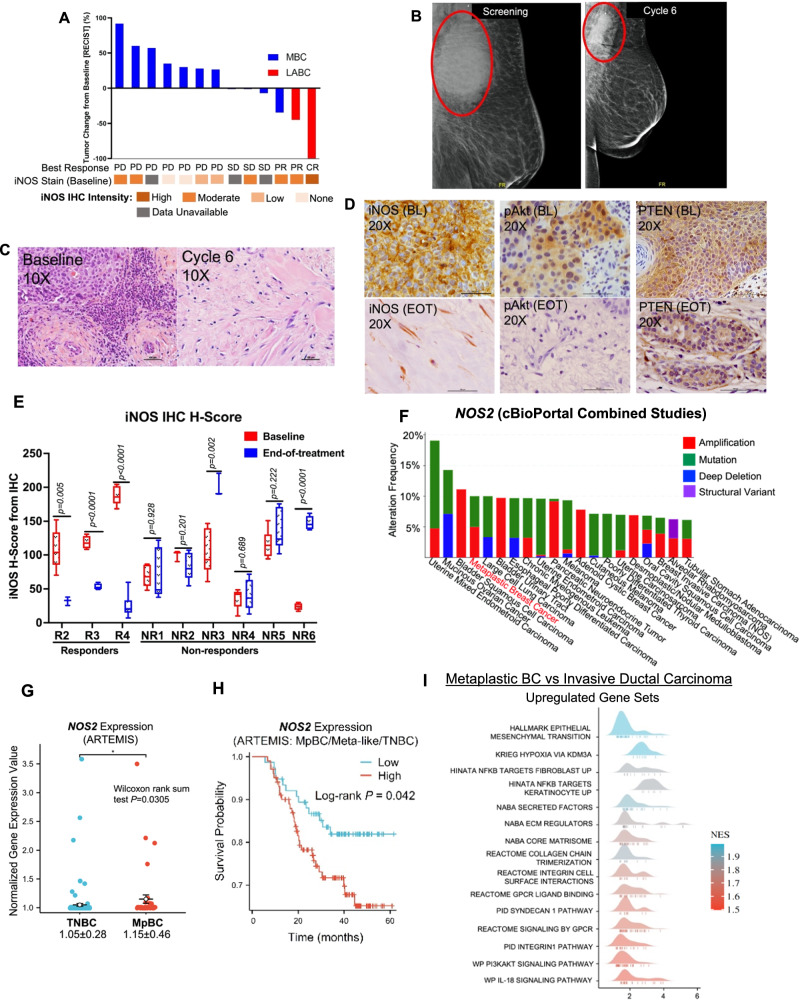
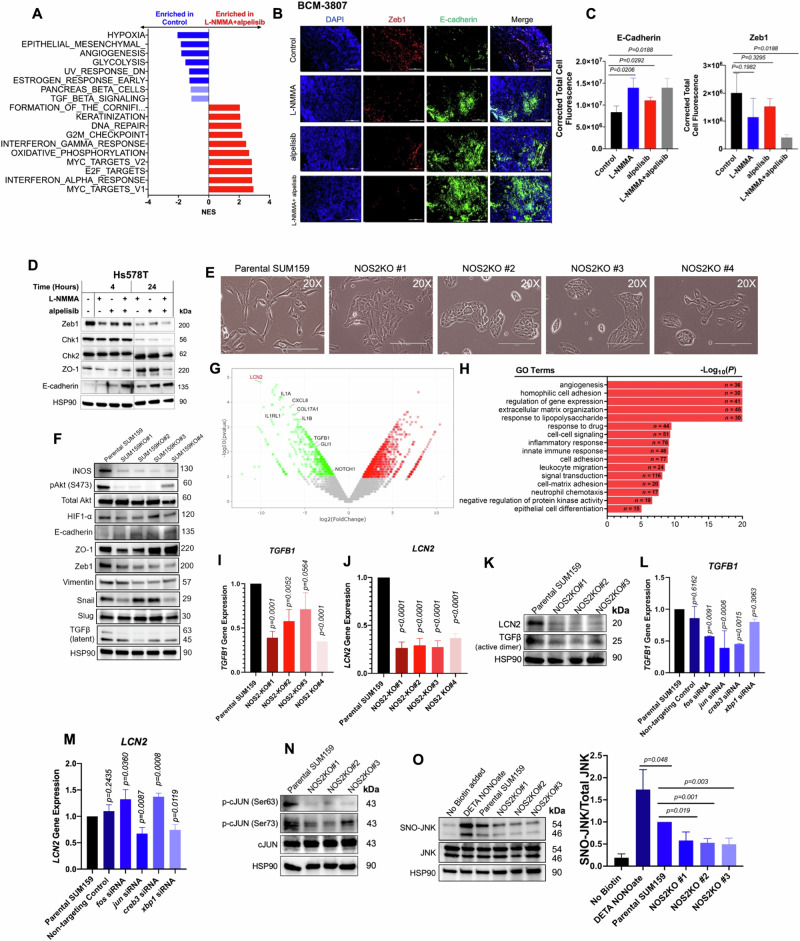
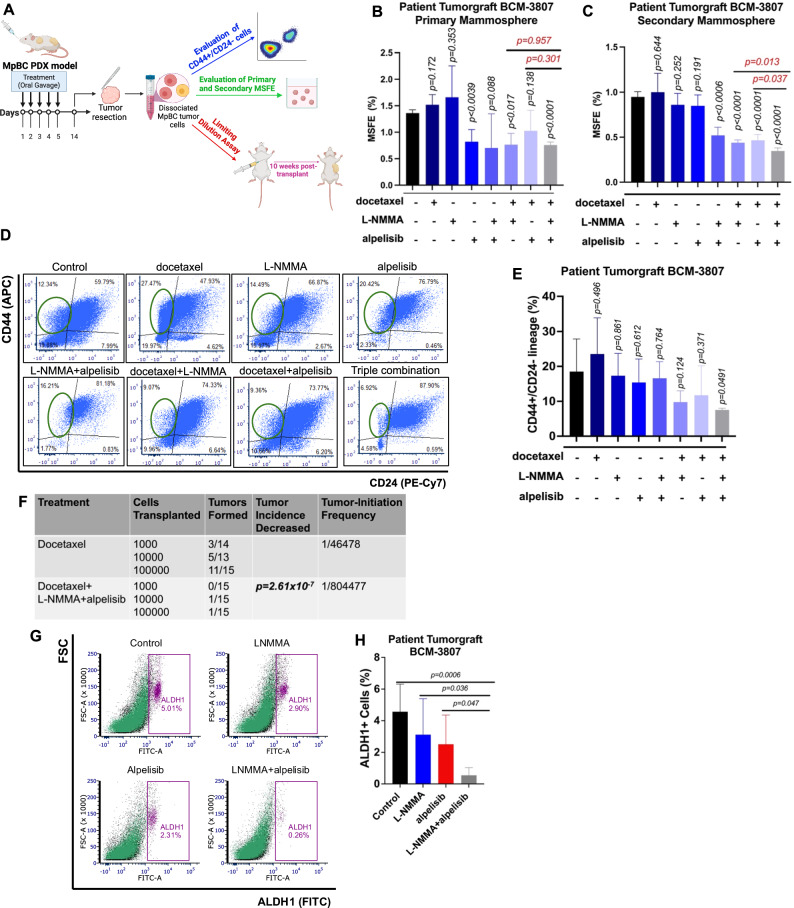
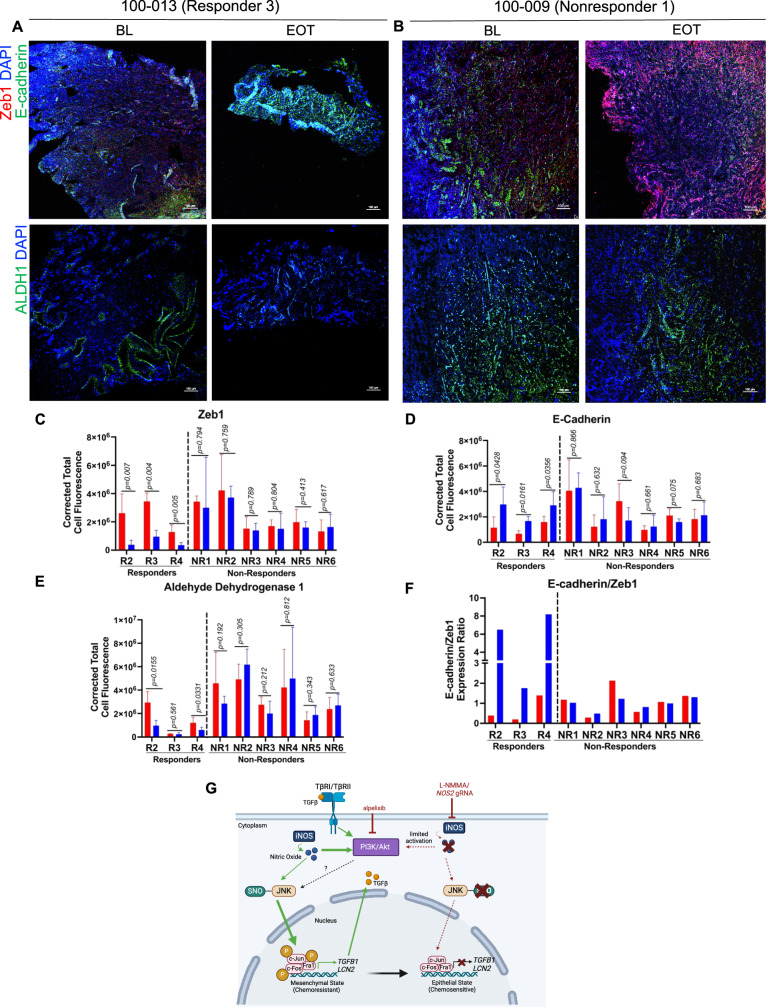
Metaplastic breast cancer (MpBC) is a highly chemoresistant subtype of breast cancer with no standardized therapy options. A clinical study in anthracycline-refractory MpBC patients suggested that nitric oxide synthase (NOS) inhibitor NG-monomethyl-l-arginine (L-NMMA) may augment anti-tumor efficacy of taxane. We report that NOS blockade potentiated response of human MpBC cell lines and tumors to phosphoinositide 3-kinase (PI3K) inhibitor alpelisib and taxane. Mechanistically, NOS blockade leads to a decrease in the S-nitrosylation of c-Jun NH2-terminal kinase (JNK)/c-Jun complex to repress its transcriptional output, leading to enhanced tumor differentiation and associated chemosensitivity. As a result, combined NOS and PI3K inhibition with taxane targets MpBC stem cells and improves survival in patient-derived xenograft models relative to single-/dual-agent therapy. Similarly, biopsies from MpBC tumors that responded to L-NMMA+taxane therapy showed a post-treatment reversal of epithelial-to-mesenchymal transition and decreased stemness. Our findings suggest that combined inhibition of iNOS and PI3K is a unique strategy to decrease chemoresistance and improve clinical outcomes in MpBC.


Conflict of interest statement

Competing interests: C. Yam reports grants from Conquer Cancer Foundation (Career Development Award supported by Fleur Fairman; the Gianni Bonadonna Breast Cancer Research Fellowship) and other support from MD Anderson Cancer Center (The University of Texas, Houston, TX) during the conduct of the study, as well as other support from Amgen, Merck, Genentech, and GSK outside the submitted work. S. Moulder also reports other support from Eli Lilly and Company and grants from ASCO Career Development Award Mentor outside the submitted work. J. Chang reports grants from the Cancer Prevention and Research Institute of Texas and from NIH during the conduct of the study. J.Chang is the sole inventor on patent application no. 10420838 entitled “Methods for treating cancer using iNOS-inhibitory compositions” held by Houston Methodist Hospital. C. Thomas reports support from NIH during this study. F. Meric-Bernstam reports grants and personal fees from F. Hoffmann-La Roche/Genentech during the conduct of the study, as well as personal fees from AbbVie, Aduro BioTech Inc., Alkermes, AstraZeneca, DebioPharm, eFFECTOR Therapeutics, IBM Watson, Infinity Pharmaceuticals, The Jackson Laboratory, Kolon Life Science, Lengo Therapeutics, OrigiMed, PACT Pharma, Parexel International, Pfizer Inc., Samsung Bioepis, Seattle Genetics Inc., Tallac Therapeutics, Tyra Biosciences, Xencor, Zymeworks, Black Diamond, Biovica, Eisai, Immunomedics, Inflection Biosciences, Karyopharm Therapeutics, Loxo Oncology, Mersana Therapeutics, OnCusp Therapeutics, Puma Biotechnology Inc., Silverback Therapeutics, Spectrum Pharmaceuticals, and Zentalis and grants from Aileron Therapeutics, Inc., AstraZeneca, Bayer Healthcare Pharmaceutical, Calithera Biosciences Inc., Curis Inc., CytomX Therapeutics Inc., Daiichi Sankyo Co. Ltd., Debiopharm International, eFFECTOR Therapeutics, Guardant Health Inc., Klus Pharma, Takeda Pharmaceutical, Novartis, Puma Biotechnology Inc., and Taiho Pharmaceutical Co. outside the submitted work. No disclosures were reported by other authors.

Figures

Fig. 1
Fig. 1. Clinical activity of L-NMMA combined with docetaxel in chemorefractory MpBC patients.
A Waterfall Plot showing change in target lesion/tumor volume, best response (RECIST), and baseline iNOS H-score expression status in the 13 patients with available data from post-baseline assessments. PD progressive disease, SD stable disease, PR partial response, and CR complete response. iNOS H-Score Metric (0–50: None, 51–100: low, 101–150: Moderate, >150: High) B Representative mammogram images at baseline (BL) and end of cycle 6 for Patient 100-048 (CR), showing shrinkage in target lesion size. C Hematoxylin and Eosin staining of BL tumor from 100-048 showing metaplastic squamous differentiation and end-of-treatment (EOT) tissue showing residual keratinized and fibrotic tissue. Scale bars represent 100 µM. Representative images of n = 3 tissue samples. D BL IHC staining of iNOS, PTEN, and phospho-Akt of tumor tissue from 100-048 and associated EOT iNOS, pAkt, and PTEN staining in residual tissue. Scale bars represent 100 µM. E iNOS H-score for BL and EOT tumors in indicated responders and non-responders. BL and EOT H-scores are indicated by red and blue box and whisker plots, respectively. R2-R4 indicates responder patients, and NR1-NR6 indicate non-responder patients. H-score analysis of 4–6 images per slide captured from tissues to cover entire tissue bed. The center bar indicates median, bounds of box represent lower and upper quartiles, and the whiskers indicate minimum and maximum of the dataset for each group. Statistical analysis by two-sided Student’s t test. F NOS2 alteration frequencies in various cancers from cBioPortal Combined Study Dataset (n = 179290). G NOS2 normalized gene expression in MpBC/metaplastic-like TNBC (n = 41, red dots) and non-MpTNBC (n = 137, blue dots) from the ARTEMIS dataset. The dot and error bars represent mean ± SD. Statistical analysis by two-sided Student’s t test. H Kaplan-Meier metastasis-free survival analysis of MpBC and non-MpTNBC tumors based on expression status [high (red line)/low (blue line)] of NOS2 from ARTEMIS dataset. I Gene set enrichment analysis of the top represented upregulated hallmark gene sets based on normalized enrichment score (NES) from RNA-sequencing data from TCGA in human MpBC tumors (n = 14) compared to invasive ductal carcinoma tumors (n = 814).
Fig. 2
Fig. 2. Co-expression of iNOS and phospho-Akt is predominant in MpBC.
A Network of protein interactions with iNOS generated by STRING analysis. Each network node represents one gene. Red line highlight interaction between NOS2 and AKT1. B Mutual exclusivity analysis of cBioPortal combined dataset of all cancers (n = 179,290) demonstrated a significant tendency toward co-occurrence for NOS2 with PIK3CA, AKT1, PTEN, and RPL39 genomic alterations. mRNA expression and protein/phosphoprotein data were selected in analysis. Statistical analysis using one-sided Fisher’s Exact Test. C Immunoblotting analysis of iNOS, PTEN, phospho-Akt (Thr308 and Ser473) in a panel of breast cancer cell lines with known PIK3CA/PIK3R1 and PTEN mutation status. HSP90 was used as a loading control. Human mammary epithelial cell line (MCF-10A), ER+ breast cancer, HER2+ breast cancer, non-metaplastic TNBC, and metaplastic TNBC cell lines are indicated in black, red, blue, green, and purple, respectively. Blots shown are representative images of n = 3 biological replicates. D Comparison of normalized iNOS and phospho-Akt (Thr308 and Ser473) protein levels among MpBC, TNBC, ER+, and HER2+ breast cancer cell lines. Each dot represents a cell line showing a representative experiment, statistical analysis by two-sided Student’s t test comparing differences in protein expression ratios of MpBC to TNBC cell lines. Bars and error bars represent Mean ± SD. E Droplet digital PCR analysis of RPL39 A14V and PIK3CA hotspot mutations (E542, E545K, H1047L, H1047R) and iNOS/phospho-Akt (Ser473) immunohistochemical expression status in PDXs of TNBC (n = 12), ER+ (n = 5), HER2+ (n = 3), and MpBC (n = 6). Green bars represent PDX models that express the specifically indicated mutation in the column. Blue bars (depending on gradient) represent the expression of phospho-Akt from low to high expression, a marker of PI3K/Akt activation. Orange bars (depending on gradient) represent low to high iNOS expression. F Results of two-sided Fisher’s exact test comparing MpBC mutation status of RPL39 A14V and PIK3CA hotspot mutations in other breast cancer subtypes. G mRNA expression of NOS2 in all breast cancer PDX models. Values were compared to ΔCT value from PDX 4913 (TNBC) as a control that was set to 1 and represent the mean ± SD of three biological replicates.
Fig. 3
Fig. 3. Pan-NOS inhibitor L-NMMA acts synergistically with isoform α-specific PI3K inhibitor alpelisib in MpBC cell lines with PIK3CA/PIK3R1 mutations.
A Four MpBC cell lines were treated with dimethyl sulfoxide (DMSO), or increasing concentrations of L-NMMA, alpelisib, or combination for 72 hours. Cell growth was evaluated using Sulforhodamine B (SRB) assay. Sensitivity of MpBC cell lines to L-NMMA alone, alpelisib alone, or L-NMMA combined with alpelisib was compared to vehicle control treated MpBC cells. Cell viability (left) and the combination index (right) are shown for each of these four cell lines and determined by CalcuSyn software. Fa, fraction affected. Bars and error bars represent mean ± SD of three biological replicates. B Protein levels of iNOS, phospho-Akt (Ser473/Thr308), total Akt, and GAPDH in SUM159 control and different NOS2 knockout (NOS2KO) clones. NOS2KO clones were developed using iNOS Double Nickase CRISPR plasmids. Blots shown are representative images of n = 2 biological replicates. C Cell Glo Titer Cell Viability Assay results of SUM159 control and NOS2KO clones treated with alpelisib at varied concentrations for 72 hours. IC50 values were determined by GraphPad Prism software. D Immunoblotting of iNOS and PI3K signaling markers in SUM159 (PIK3CA mutated), Hs578T (PIK3R1 mutated), BT549 (PTEN-deleted) cell lines treated for 24 hours with DMSO control, 4 mM L-NMMA, 5 µM alpelisib, and L-NMMA combined with alpelisib. Blots shown are representative images of n = 3 biological replicates. Densitometry quantification values were determined using ImageLab software (Biorad) and found in Supplementary Fig. 3. E Immunoblotting of S-nitrosoglutathione reductase (GSNOR) and tubulin loading control of MpBC cell lines HCC1806, BT549, Hs578T, and SUM159 with densitometry analysis indicated in a bar graph. The blots shown are representative images of n = 2 biological replicates. F Extent of DNA damage, quantified by the comet tail moment in the neutral comet assay. Statistical analysis by two-sided Student’s t test. n = 3 biological replicates per condition, 40 comets counted per biological replicate.
Fig. 4
Fig. 4. NOS inhibition augments PI3K inhibitor and taxane treatment in vivo.
A Schematics representing the MpBC PDX (BCM-3807, BCM-4664, PIM-010, and PIM-084) experimental design. PDXs derived from human MpBCs were transplanted into cleared mammary fat-pad of female NSG mice. When tumors reached 150–200 mm3, mice were randomized to receive vehicle control, NOS inhibition therapy (L-NMMA [400 mg/kg oral gavage on day 1, 200 mg/kg oral gavage on days 2–5] + amlodipine [10 mg/kg intraperitoneal injection on days 1–5]), PI3K inhibitor alpelisib (35 mg/kg oral gavage on days 1–5), or the combination of both therapies as indicated. Caliper measurements were taken twice a week. Days in which mice were treated with therapies are indicated in red and rest days are indicated in green. BE Mean tumor volume and corresponding waterfall plots demonstrating maximal treatment response to single-agent or combination therapy in four MpBC PDX models ([BCM-3807, n = 6], [PIM-010, n = 7], [PIM-084, n = 5], and [BCM-4664, n = 6]). Average tumor volume [0.5 × (mm long dimension) × (mm short dimension)2] and data points are mean tumor volume ± SEM. Statistical analysis for be by two-sided Student’s t test (*p ≤ 0.05, **p ≤ 0.01). Each bar in waterfall is derived from the maximal response of a single tumor-bearing mouse to therapy. Lines and bars in the plots indicated in black represent vehicle control, blue represent L-NMMA single-agent therapy, red represent alpelisib single-agent therapy, and gray indicate dual-agent therapy. P values: BCM-3807 (control vs L-NMMA+alpelisib [p = 0.0211], L-NMMA vs L-NMMA+alpelisib [p = 0.0398], alpelisib vs L-NMMA+alpelisib [p = 0.0456]), PIM-010 (control vs L-NMMA+alpelisib [p = 0.006], L-NMMA vs L-NMMA+alpelisib [p = 0.0231], alpelisib vs L-NMMA+alpelisib [p = 0.0079]), PIM-084 (control vs L-NMMA+alpelisib [p = 0.0231], alpelisib vs L-NMMA+alpelisib [p = 0.016]), BCM-4664 (control vs L-NMMA+alpelisib [p = 0.0052], L-NMMA vs L-NMMA+alpelisib [p = 0.0254], alpelisib vs L-NMMA+alpelisib [p = 0.1275]). F, G Tumor volumes of BCM-4664 (F) and BCM-3807 (G) tumors treated with vehicle control (black), docetaxel (purple), or combination therapy (docetaxel + NOS inhibition therapy [blue], docetaxel + alpelisib [green], and docetaxel + NOS inhibition therapy + alpelisib [red]). When tumors reached 150–200 mm3, they were randomized into the respective treatment arms. Each graph line represents a replicate/treatment arm. H, I Kaplan–Meier survival curves of model BCM-4664 (H) and BCM-3807 (I) treated with vehicle control, docetaxel, or combination therapy (dual/triple combination). An event was scored when a tumor reached 1200 mm3 or from death. Statistical analysis using Log-rank (Mantel–Cox) test. P values: BCM-4664 (docetaxel+alpelisib vs triple combination [p = 0.0432], docetaxel+L-NMMA vs triple combination [p = 0.0007], BCM-3807 (docetaxel vs. triple combination [p = 0.0192].
Fig. 5
Fig. 5. NOS inhibition induces epithelial-to-mesenchymal transition reversal in MpBC.
ATop GSEA pathways by normalized enrichment score (NES) from the Hallmark and Reactome collections, enriched in control (blue) and L-NMMA+alpelisib (red) treated PDX tumors. Light blue bars indicate non-significant pathways. B Representative immunofluorescence images of BCM-3807 tumors evaluated for C E-cadherin and Zeb1 protein expression. n = 3 biological replicates per condition. Five images at ×10 magnification per biological replicate covering the complete tissue bed were utilized for analysis. Scale bars represent 200 µM. Black, blue, red, and gray bars represent vehicle control, L-NMMA, alpelisib, and L-NMMA+alpelisib, respectively. D Immunoblotting of EMT markers in Hs578T (PIK3R1 mutated) cell lines treated with DMSO control, L-NMMA, alpelisib, and L-NMMA+alpelisib for 4–24 hours. E Morphology of SUM159 control cells and NOS2KO clone cells. ×20 magnification and scale bars represent 200 µM. G Volcano Plot representing global transcriptional changes comparing SUM159 control cells and NOS2KO clone cells. Each data point represents a gene regulated by AP-1 transcription factor family. Differentially expressed genes (p < 0.05) with a log2 fold change >1 are upregulated genes (red dots), and less than −1 are downregulated genes (green dots). Statistical analysis was performed using the Wald test. H Significantly differentially expressed genes clustered by their gene ontology (GO) with an adjusted P value < 0.05, tested using two-sided Fisher exact test (GeneSCF v1.1-p2). mRNA expression of TGFB1 I and LCN2 J from Parental SUM159 cells and NOS2KO clone cells and TGFB1 L and LCN2 M in SUM159 treated with non-targeting control siRNA and siRNAs specific to XBP1, CREB3, FOS, and JUN. Immunoblots of F EMT and iNOS-associated proteins, K LCN2, TGFβ [active form], N phospho-c-Jun (Ser63/Ser73), O S-nitrosylation of JNK (SNO-JNK), and HSP90 loading control in Parental SUM159 cells and NOS2KO clone cells. For C, I, J, KO, Statistical analysis by two-sided Student’s t test. Bars and error bars represent the mean ± SD of three biological replicates. For all Blots, images shown are representative of n = 3 biological replicates, and graph represents SNO-JNK/JNK protein expression ratios from n = 3 biological replicates.
Fig. 6
Fig. 6. L-NMMA and alpelisib combined with taxane chemotherapy are effective at targeting breast cancer stem cells.
A Schematic showing experimental outline to test the tumor-initiating and self-renewal capacity of MpBC PDX tumor model BCM-3807 after treatment with targeted therapies with or without taxane chemotherapy. Figure created with Biorender.com. B Primary and C Secondary MSFE % values of tumors from each indicated treatment group after 14 days of treatment. Tumors were treated in vivo for 14 days, collected, dissociated into single cell suspensions, and subsequently plated under mammosphere conditions (60,000 cells per well in 6-well low-adherent plates in supplemented MammoCult Media). To determine secondary MSFE, primary mammosphere were collected, dissociated, and replated under mammosphere conditions. A two-tailed Student t test was conducted to evaluate p values comparing each treatment condition to vehicle control. Bars and error bars represent the mean ± SD of four biological replicates/mice per condition. P values indicated in red compare triple combination therapy to both double combination therapies. P values indicated in black compare indicated treatment arm to vehicle control. D, E CD44+/CD24− (BCSC marker) results (flow cytometry) from tumors after treatment. A two-tailed Student t test was conducted to evaluate p values comparing each treatment condition to vehicle control. Bars and error bars represent the mean ± SD of four biological replicates/mice per condition. F Limiting Dilution Assay: BCM-3807 tumors from docetaxel and triple combination (docetaxel+L-NMMA+alpelisib) treated mice (14 days) were dissociated and pooled. A total of 1000, 10,000, and 100,000 cells from each group were transplanted into the mammary gland fat-pad of 4- to 6-week-old mice (n = 13–15 mice/group). Tumor incidence was reported at 12 weeks post-transplantation. Stem cell frequency fractions and overall statistical analysis using Chi-squared test comparing differences in stem cell frequencies between treatment groups was evaluated using available LDA software (https://bioinf.wehi.edu.au/software/elda/). G, H Flow cytometry analysis of ALDH1+ cells in BCM-3807 tumors after 14 days of treatment with vehicle control, single-agent therapy (L-NMMA or alpelisib), and dual-agent therapy. Statistical analysis by two-sided Student’s t test. Bars and error bars represent the mean ± SD of five biological replicates/mice per condition.
Fig. 7
Fig. 7. EMT reversal in MpBC human tumor biopsies after L-NMMA+taxane therapy.
A Representative immunofluorescence images of tumor biopsy for patient 100-013 (responder) and B patient 100-009 (non-responder) stained for Zeb1 (red), E-cadherin (green), ALDH1 (green), and DAPI (blue). Images magnification ×10; scale bars represent 100 µM. Corrected total cell fluorescence analysis quantified using ImageJ software for C Zeb1, D E-cadherin, E ALDH1 in patient tumor biopsies at baseline (BL) and end-of-treatment (EOT). Immunofluorescence analysis was obtained from 5 images per slide captured from tissues to cover the entire tissue bed. Statistical analysis by two-sided Student’s t test. Bars and error bars represent ±SD F Ratio of E-cadherin/Zeb expression (corrected total cell fluorescence) in patient tumor biopsies at BL and EOT. Statistical analysis was performed by Student’s t test. Red and blue bars indicate data for BL and EOT corrected total cell fluorescence, respectively. R2-R4 indicate responder patients, and NR1-NR6 indicate non-responder patients. G Schematic represents a potential mechanism of action of NOS inhibition inducing EMT reversal. iNOS inducible nitric oxide synthase; EMT epithelial-to-mesenchymal transition; JNK c-Jun N-terminal kinase; PI3K phosphoinositide 3-kinase; TGFB1 transforming growth factor beta 1; LCN2 lipocalin AP-1 activator protein 1. Figure created with Biorender.com.

References

    1. Adams, S. Dramatic response of metaplastic breast cancer to chemo-immunotherapy. NPJ Breast Cancer3, 8 (2017). - PMC - PubMed
    1. Weigelt, B., Eberle, C., Cowell, C. F., Ng, C. K. & Reis-Filho, J. S. Metaplastic breast carcinoma: more than a special type. Nat. Rev. Cancer14, 147–148 (2014). - PubMed
    1. Djomehri, S. I. et al. Quantitative proteomic landscape of metaplastic breast carcinoma pathological subtypes and their relationship to triple-negative tumors. Nat. Commun.11, 1723 (2020). - PMC - PubMed
    1. Moreno, A. C. et al. Outcomes after treatment of metaplastic versus other breast cancer subtypes. J. Cancer11, 1341–1350 (2020). - PMC - PubMed
    1. Reddy, T. P. et al. A comprehensive overview of metaplastic breast cancer: clinical features and molecular aberrations. Breast Cancer Res.22, 121 (2020). - PMC - PubMed

Publication types

MeSH terms

Associated data