. 2024 Dec 30;15(1):10819.
doi: 10.1038/s41467-024-55050-y.

A high-protein diet-responsive gut hormone regulates behavioral and metabolic optimization in Drosophila melanogaster

Affiliations

A high-protein diet-responsive gut hormone regulates behavioral and metabolic optimization in Drosophila melanogaster

Yuto Yoshinari et al. Nat Commun. .

Abstract

Protein is essential for all living organisms; however, excessive protein intake can have adverse effects, such as hyperammonemia. Although mechanisms responding to protein deficiency are well-studied, there is a significant gap in our understanding of how organisms adaptively suppress excessive protein intake. In the present study, utilizing the fruit fly, Drosophila melanogaster, we discover that the peptide hormone CCHamide1 (CCHa1), secreted by enteroendocrine cells in response to a high-protein diet (HPD), is vital for suppressing overconsumption of protein. Gut-derived CCHa1 is received by a small subset of enteric neurons that produce short neuropeptide F, thereby modulating protein-specific satiety. Importantly, impairment of the CCHa1-mediated gut-enteric neuronal axis results in ammonia accumulation and a shortened lifespan under HPD conditions. Collectively, our findings unravel the crosstalk of gut hormone and neuronal pathways that orchestrate physiological responses to prevent and adapt to dietary protein overload.


Conflict of interest statement

Competing interests: The authors declare no competing interests.

Figures
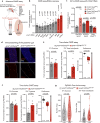
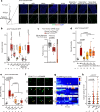
Fig. 1
Fig. 1. Midgut CCHa1 regulates feeding behavior in female Drosophila melanogaster.
a The gut and capillary feeding (CAFÉ) assay showing the experimental scheme. b Screening of enteroendocrine hormones, which affect feeding amount in the CAFÉ assay. c The CAFÉ assay with CCHa1 RNAi in the Gut EECs (prosts), EECs of R5 region midgut (AstA), and brain (nSybbrain). d Immunostaining images of the midgut from control or gut-specific CCHa1 RNAi flies. CCHa1 (Red), Prospero (white), and DAPI (blue) are shown. In the bottom images, white broken lines show the outlines of the midgut. Scale bar, 50 µm. e Two-choice feeding experiment with CAFÉ assay. Consumption of sucrose (left), yeast autolysate (centre), and preference (right) of control or gut-specific CCHa1 RNAi flies is shown. In this and the following two-choice CAFÉ assay figures, each dot presents a sample of eight flies. In the preference graph, S means sucrose, Y means yeast autolysate. f Two-choice feeding experiment with CAFÉ assay. Consumption of sucrose (left), tryptone (centre), and preference (right) is shown. g Number of sips of sucrose (left) and yeast autolysate (right) of CCHa1 RNAi or control flies measured using the flyPAD system. In this and the following flyPAD assay figures, a dot presents the number of sips by a single fly from each food source measured separately. Numbers of samples assessed (n) are shown in the graphs. For all bar graphs, means and SEMs with all data points are shown. For box plots with dots, the median, 25th and 75th percentile lines are shown. Whiskers extend 1.5 times the interquartile range from the 25th and 75th percentiles. Statistics: One-way ANOVA followed by Dunnett’s test (b), two-tailed Student’s t test (c, e, f), two-sided Wilcoxon rank sum test (g). p values are shown in the graphs.
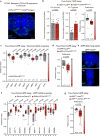
Fig. 2
Fig. 2. High-protein diets and amino acid-supplemented diets activate CCHa1+ EECs.
Besides the standard diet without supplementation (SD) and HPD, other diets consisted of standard diets supplemented with NEAA, EAA, all amino acids (All AA), and selected combinations of NEAA (Mix 1, 2, and 3). Amino-acid compositions of these mixtures are described in Supplementary Data 1. a (Left) Illustration of the gut showing posterior region of midgut. (Right) Immunostaining images of the midgut from prosts>CaLexA > GFP flies expressing a Ca2+-signaling-sensitive reporter in EECs maintained on each medium. GFP (green), CCHa1 (red), and DAPI (blue) are shown. White broken lines show the outline of the midgut. Scale bar, 20 µm. b Quantification of the GFP signal of CCHa1+ EECs of prosts>CaLexA > GFP flies maintained as in (a). c Two-choice feeding experiment with the CAFÉ assay. Preference between sucrose and the NEAA mixture of control and gut-specific CCHa1 RNAi flies is shown. d, e Quantification of the GFP signal of CCHa1+ EECs of prosts>CaLexA > GFP flies. f Sequential images of CCHa1-T2A-knock-in-GAL4-driven GCaMP8f signals in EECs. The timestamp indicates the time elapsed since the start of imaging. White arrows and yellow arrows indicate non-responders and responders, respectively. g Representative heatmap records of GCaMP8f intensity of six individual EECs from single gut. h Quantification of Ca2+ peak in EECs within 2 min under different feeding conditions. Numbers of samples assessed (n) are shown in the graphs. For box plots with dots, the median, 25th and 75th percentile lines are shown. Whiskers extend 1.5 times the interquartile range from the 25th and 75th percentiles. Statistics: One-way ANOVA followed by Dunnett’s test (b), two-tailed Student’s t test (c), one-way ANOVA followed by Tukey’s multiple comparisons test (d, e, h). p values are shown in the graphs. The exact p values for Fig. 2e; +Ala, Gly vs +Ala, Pro (0.0063), +Ala, Gly vs +Ala, Tyr (0.0082), +Ala, Gly vs +2x Ala (0.000060).
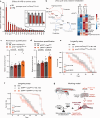
Fig. 3
Fig. 3. CCHa1-R in sNPF neurons regulates feeding preference.
a Immunostaining image of the brain from CCHa1-R-T2A-knock-in-GAL4>stinger flies expressing nuclear-localized GFP in the CCHa1-R-expressing cells. GFP (green) and phalloidin (blue) are shown. Scale bar, 50 µm. b Two-choice feeding experiment with CAFÉ assay. Consumption of sucrose (left), tryptone (centre), and preference (right) of control and neuronal CCHa1-R RNAi flies are shown. In the preference graph, S means sucrose, T means tryptone. c two-choice feeding experiment screening with the CAFÉ assay. Preferences between sucrose and tryptone of control (no GAL4) and several neurotransmitters, and neuropeptides expressing cell-specific CCHa1-R RNAi flies are shown. d Two-choice feeding experiment with the CAFÉ assay. Preferences between sucrose and tryptone of control and sNPF neurons-specific CCHa1-R RNAi flies are shown. e Immunostaining images of the brain (top) and abdominal ganglion (bottom: Ag) from sNPF>stinger flies expressing nuclear-localized GFP in the sNPF neurons. GFP (green) and phalloidin (blue) are shown. Scale bar, 50 µm. f Two-choice feeding experiment screening with CAFÉ assay. Preferences between sucrose and tryptone of control (GAL4>mCherry RNAi) and various sNPF-GAL4-driven CCHa1-R RNAi flies are shown. g Two-choice feeding experiment with CAFÉ assay. Preferences between sucrose and tryptone of control and enteric sNPF neuron-specific CCHa1-R RNAi flies are shown. In all graphs, numbers of samples assessed (n) are shown in the graphs. For all bar graphs, mean and SEM with all data points are shown. For box plots with dots, the median, 25th and 75th percentile lines are shown. Whiskers extend 1.5 times the interquartile range from the 25th and 75th percentiles. Statistics: two-tailed Student’s t test (b, d, f, g), one-way ANOVA followed by Tukey’s multiple comparisons test (c). p values are shown in the graphs.
Fig. 4
Fig. 4. Enteric sNPF neurons control feeding behavior via sNPF.
a Immunostaining images of the brain (left) and abdominal ganglion (right: Ag) from sNPFTH>stinger flies. GFP (green) and phalloidin (blue) are shown. Scale bar, 50 µm. b Illustration of the midgut (top) and immunostaining images of HCG neurons (bottom) from sNPFTH>stinger flies. GFP (white), sNPF/NPF (red), and DAPI (blue) are shown. Scale bar, 20 µm. c Two-choice feeding experiment with the CAFÉ assay. Consumption of sucrose (left), tryptone (centre), and preference (right) of control and enteric sNPF neuron-specific sNPF RNAi flies are shown. d Numbers of sips of sucrose (left) and yeast autolysate (right) of sNPF RNAi and control flies measured using the flyPAD system. e Pseudocolor images of enteric sNPF neurons from sNPFTH>CaLexA > GFP flies maintained on standard diet (SD) or 10% peptone-supplemented, high-protein diet (HPD). Fluorescence signals (GFP) are pseudocoloured; high to low intensity is displayed as warm (yellow) to cold (blue) colors with a color scale. Scale bar, 20 µm. f Quantification of CaLexA-driven GFP intensity of enteric sNPF neurons. g Two-choice feeding experiment with CAFÉ assay. Preferences between sucrose and tryptone of controls and enteric sNPF neuron-inactive (sNPFTH>shibirets) flies are shown. h An illustration of GPCR::Tango system. Upon activation by ligand binding, β-Arrestin-TEV is recruited to GPCR and cleaves TCS, releasing LexA from the GPCR. i Immunostaining images of the HCG from control (without GAL4 driver) or gut-specific CCHa1 RNAi flies carrying CCHa1-R-knock-in-Tango and LexAop-mCD8::GFP. GFP (green), sNPF/NPF (red), and DAPI (blue) are shown. Scale bar, 20 µm. j Quantification of CCHa1-R-knock-in-Tango driven GFP intensity in the enteric sNPF neurons. k Two-choice feeding experiment with CAFÉ assay. The preference between sucrose and yeast autolysate is shown. Numbers of samples assessed (n) are shown in the graphs. For all bar graphs, means and SEMs with all data points are shown. For box plots with dots, the median, 25th and 75th percentile lines are shown. Whiskers extend 1.5 times the interquartile range from the 25th and 75th percentiles. All immunohistochemical experiments were repeated at least twice with similar results. Statistics: two-tailed Student’s t test (c), two-sided Wilcoxon rank sum test (d, j), Wilcoxon rank sum test with Holm’s correction (f), one-way ANOVA followed by Tukey’s multiple comparisons test (g, k). p values are shown in the graphs.
Fig. 5
Fig. 5. Neuronal sNPF/sNPFR signaling regulates feeding behavior.
a Immunostaining images of the anterior midgut from sNPFTH>syt::GFP, Denmark fly. GFP (green), RFP (red), and DAPI (blue) are shown. Scale bar, 20 µm. b Immunostaining images of the proventriculus (PV: left) and HCG (right) of sNPF-RT2A-knock-in>stinger fly. GFP (white), sNPF/NPF (red), and DAPI (blue) are shown. Scale bar, 50 µm (left), 20 µm (right). c Two-choice feeding experiment with CAFÉ assay. Preferences between sucrose and tryptone of controls and muscle (howts > sNPF-RRNAi)- or neuron (nSybts > sNPF-RRNAi)-specific sNPF-R RNAi flies are shown. S means sucrose, T means tryptone. d Numbers of sips on sucrose (left) and yeast autolysate (right) of sNPF-R RNAi and control flies measured using the flyPAD system. e Illustrations (top) and immunostaining images (bottom) of Trans-Tango experiment. Immunostaining images of the HCG of sNPFTH>Trans-Tango fly are shown with GFP (presynaptic neurons: green), RFP (postsynaptic neuron: red), AKH (corpora cardiaca: white), and DAPI (blue). Note that RFP signals were observed in HCG neurons, but not in the corpora cardiaca. Scale bar, 20 µm. Numbers of samples assessed (n) are shown in the graphs. For box plots with dots, the median, 25th and 75th percentile lines are shown. Whiskers extend 1.5 times the interquartile range from the 25th and 75th percentiles. All immunohistochemical experiments were repeated at least twice with similar results. Statistics: two-tailed Student’s t test (c), two-sided Wilcoxon rank sum test (d). p values are shown in the graphs.
Fig. 6
Fig. 6. Enteric sNPF neurons send signals to sugar-sensing Gr43a neurons.
a Immunostaining images of the HCG from Piezo>stinger (top), Gr43a>stinger (bottom) flies. GFP (white), sNPF/NPF(red), and DAPI (blue) are shown. Scale bar, 20 µm. b wo-choice feeding experiment with CAFÉ assay. Preferences between sucrose and tryptone of controls and piezo neurons (Piezo > sNPF-RRNAi) or Gr43a neuron (Gr43a > sNPF-RRNAi) specific sNPF-R RNAi flies are shown. S means sucrose, T means tryptone. c Numbers of sips of sucrose (left) and yeast autolysate (right) of sNPF-R RNAi and control flies measured using the flyPAD system. d Immunostaining images of the HCG of control (no Gr43a-LexA: bottom) and GRASP (with Gr43a-LexA: top) flies. Re-constituted GFP (without immunostaining: green), sNPF/NPF (red), and DAPI (blue) are shown. Yellow arrows indicate GRASP signals where nerves are in close proximity. Scale bar, 20 µm (right). e Numbers of sips of sucrose (left) and yeast autolysate (right) of Gr43a RNAi and control flies measured using the flyPAD system. f Numbers of sips of yeast autolysate upon activation of Gr43a neurons and control flies measured using the flyPAD system. Numbers of samples assessed (n) are shown in the graphs. For box plots with dots, the median, 25th and 75th percentile lines are shown. Whiskers extend 1.5 times the interquartile range from the 25th and 75th percentiles. All immunohistochemical experiments were repeated at least twice with similar results. Statistics: two-tailed Student’s t test (b), two-sided Wilcoxon rank sum test (c, e, f). p values are shown in the graphs.
Fig. 7
Fig. 7. Gut-HCG neurons influence the urea cycle and ammonium metabolism.
a Relative amounts of amino acids from whole body samples of prosts>mCherryRNAi flies maintained on standard diet (SD) or high-protein diet (HPD). Values are normalized by SD. b An illustration of urea cycle and creatine metabolic pathway (left), and heatmaps of selected metabolites of control and gut-specific CCHa1 RNAi flies maintained on SD or HPD. c, d Measurements of ammonium levels from whole body samples of control, gut-specific CCHa1 RNAi flies (c), and enteric sNPF neurons specific sNPF RNAi flies (d). These flies were maintained on SD or HPD for 3 days before experiments. e Survival curves of control and gut-specific CCHa1 RNAi flies maintained on SD or HPD. f Survival curves of control and enteric sNPF neuron-specific sNPF RNAi flies maintained on SD or HPD. g A model of this study. The numbers of samples assessed (n) are shown in the graphs. For all bar graphs, means and SEMs with all data points are shown. Survival curves show survival curve values and confidence intervals. Statistics: two-tailed Welch’s t test (b), one-way ANOVA followed by Tukey’s multiple comparisons test (c, d). Pairwise log-rank test (e, f), p values are shown in the graphs except for (a, b). p values and data of the (b) are shown in Supplementary Fig. 12.

References

    1. Soultoukis, G. A. & Partridge, L. Dietary protein, metabolism, and aging. Annu. Rev. Biochem.85, 5–34 (2016). - PubMed
    1. Kosakamoto, H. et al. Sensing of the non-essential amino acid tyrosine governs the response to protein restriction in Drosophila. Nat. Metab.4, 944–959 (2022). - PubMed
    1. Jouandin, P. et al. Lysosomal cystine mobilization shapes the response of TORC1 and tissue growth to fasting. Science375, eabc4203 (2022). - PMC - PubMed
    1. Khan, M. S. et al. Protein appetite at the interface between nutrient sensing and physiological homeostasis. Nutrients13, 4103 (2021). - PMC - PubMed
    1. Simpson, S. J., Batley, R. & Raubenheimer, D. Geometric analysis of macronutrient intake in humans: the power of protein? Appetite41, 123–140 (2003). - PubMed

Publication types

LinkOut - more resources