. 2024 Dec 30;15(1):10792.
doi: 10.1038/s41467-024-55094-0.

Neuromorphic-enabled video-activated cell sorting

Affiliations

Neuromorphic-enabled video-activated cell sorting

Weihua He et al. Nat Commun. .

Abstract

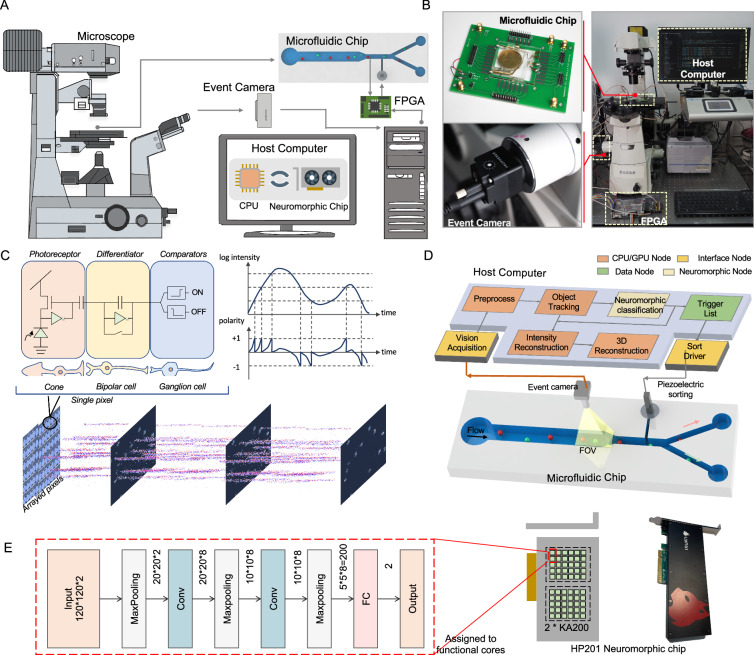
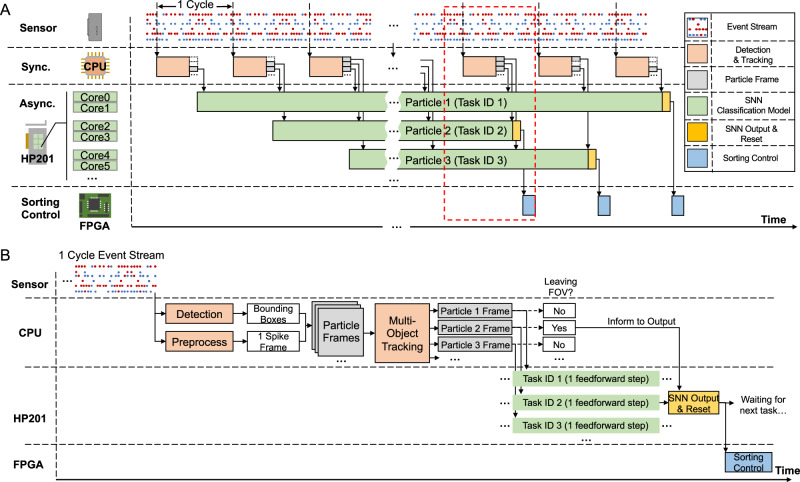
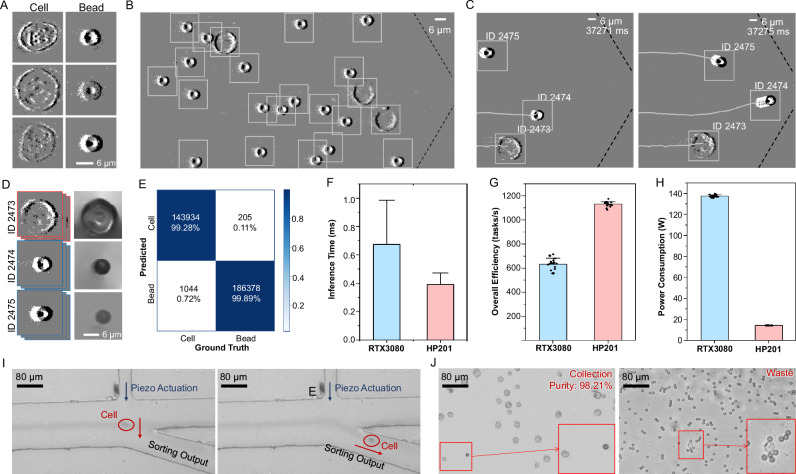
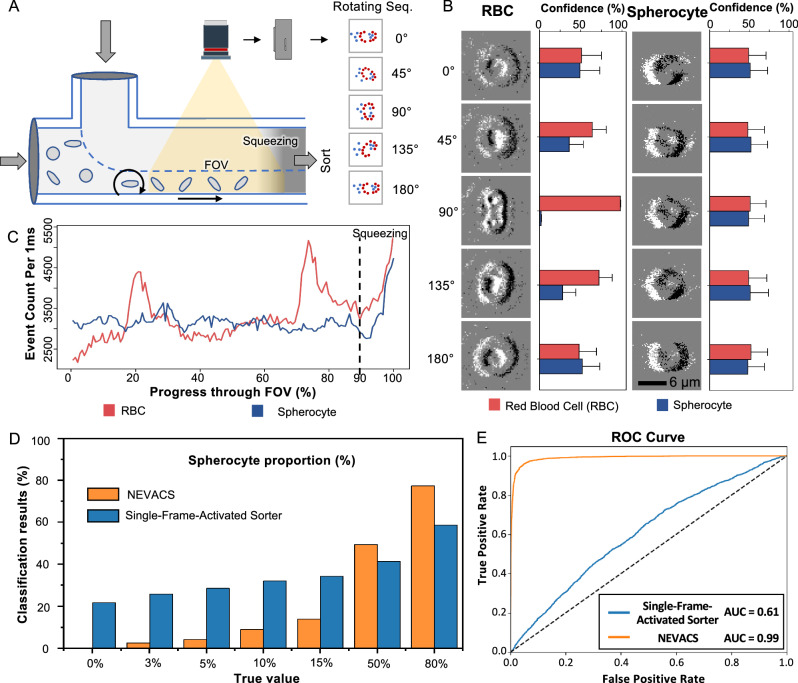
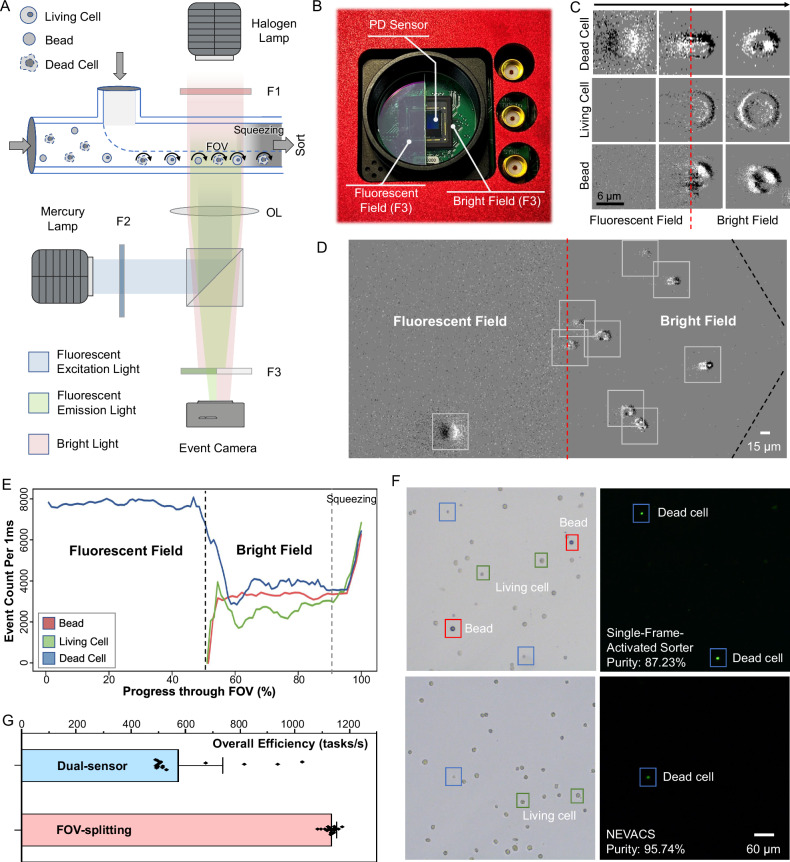
Imaging flow cytometry allows image-activated cell sorting (IACS) with enhanced feature dimensions in cellular morphology, structure, and composition. However, existing IACS frameworks suffer from the challenges of 3D information loss and processing latency dilemma in real-time sorting operation. Herein, we establish a neuromorphic-enabled video-activated cell sorter (NEVACS) framework, designed to achieve high-dimensional spatiotemporal characterization content alongside high-throughput sorting of particles in wide field of view. NEVACS adopts event camera, CPU, spiking neural networks deployed on a neuromorphic chip, and achieves sorting throughput of 1000 cells/s with relatively economic hybrid hardware solution (~$10 K for control) and simple-to-make-and-use microfluidic infrastructures. Particularly, the application of NEVACS in classifying regular red blood cells and blood-disease-relevant spherocytes highlights the accuracy of using video over a single frame (i.e., average error of 0.99% vs 19.93%), indicating NEVACS' potential in cell morphology screening and disease diagnosis.


Conflict of interest statement

Competing interests: The authors declare no competing interests.

Figures

Fig. 1
Fig. 1. The proposed NEVACS framework and infrastructure.
A System backbones include an event camera, microscope, host personal computer, FPGA, and microfluidic chip. The cell suspension sample is first introduced into the wide channel (bird-view) for microfluidic operation and field imaging and then focused into the narrow channel. The FOV is imaged through microscopy and event camera with high spatiotemporal resolution, and analyzed by deploying a spiking neural network (SNN) model in the host computer to get the sort decision list. The electrical signals are triggered by electrodes in the microfluidic chip as the cells in the narrow channel pass through, informing the FPGA to query the sort decision list and activate piezoelectric sorting. See Supplementary Fig. 1 for details. B Experimental setup of NEVACS. C The working mechanism of the neuromorphic vision sensor, event camera. D Functional modules of the microfluidic, imaging, and control subsystems. After vision acquisition and preprocessing, the blobs in the FOV are analyzed by the multi-object tracking module to obtain spatiotemporal video sequences for each particle. The videos can be used for comprehensive neuromorphic classification for sort decisions and further offline reconstruction. See Supplementary Fig. 1 for details. E The SNN classification models deployed independently and asynchronously on the neuromorphic chip HP201. `Conv' and `FC' refer to the convolutional layer and fully connected layer, respectively.
Fig. 2
Fig. 2. The control flow for the hybrid asynchronous neuromorphic vision information processing architecture.
A Overall control flow. In every cycle, particle blobs in the imaged event stream are detected and tracked synchronously on the CPU to generate binarized video for each particle. The video frames for one particular particle are sequentially processed by a dedicated spiking neural network (SNN) classification model (task). For multiple particles, these SNN models (tasks) are executed independently and asynchronously on the corresponding cores of the neuromorphic chip HP201. Note that because particles (e.g., particle 1 slower than 2 or 3) may have different speeds in the FOV, their SNNs may have different task start and end timing. The classification result for each particle is utilized for sorting decisions to conduct sorting control via FPGA. `Sync.' and `Async.' refer to synchronous phase and asynchronous phase, respectively. B The detailed control flow in one cycle. Initially, the event stream is used to generate bounding boxes for particles in the FOV, and one binarized spike frame. These two are used to generate ROIs for particles. Each ROI (called particle frame) is associated with a particular particle by the MOT module, and fed immediately to its dedicated SNN for one feedforward step. The CPU decides and notifies SNN and the subsequent sorting control, depending on whether the particle has left the FOV or not.
Fig. 3
Fig. 3. Basic performance of NEVACS.
A Hela cells and 6-μm beads in the processed event stream, visualized with black and white pixels representing the positive and negative events respectively. B The detected event blobs of particles in the FOV (800 × 400 pixels), where the dotted line marks the boundary of the funnel-like microfluidic channel. C Snapshot of the MOT results, depicting the trajectory and order of particles entering the narrow channel. Note, during this course, the order of particles (e.g., ID 2473 and ID 2475) may change but can be successfully analyzed by the MOT module SORT. D The intensity reconstruction results (right) obtained offline from the recorded spatiotemporal imaging sequences (left) for different particles. E Confusion matrix of the SNN classification model results on the test set. The false identification rate of cells and beads is 0.72% and 0.11%, respectively. FH Comparisons of inference time (F) 500 biological replicates are performed, and data are presented as mean values ± SD, control subsystem overall efficiency (G), and power consumption (H) for NEVACS with different accelerator configurations (RTX3080 and HP201), respectively. 20 biological replicates are performed for (GH), and data are presented as mean values ± SD. I Time-lapsed microscopic image snapshots recorded by a high-speed camera to confirm the sorting trajectories of single cells. J Representative microscopic visualization of cell sorting results for the cell-bead mixture, with>98% purity of collection. Insets show the rare, false sorting cases. The experiment was repeated 20 times independently with similar results.
Fig. 4
Fig. 4. Classification of regular red blood cells (RBCs) and spherocytes with multi-angle enhancement feature of NEVACS.
A Overall, side-view schematic of NEVACS configured for multi-angle imaging enhanced classification. Particles are subject to rolling by a sheath flow input above the main channel. B The classification confidence (obtained by the single-frame-activated sorter) using only one snapshot for both RBCs and spherocytes under typical imaging angles. 4000 biological replicates are performed, and data are presented as mean values ± SD. For these two types of particles, RBCs could be classified as RBC with relatively high confidence when a particular snapshot of RBCs (e.g., 90) is fed, while spherocytes would be classified as RBC or spherocyte with nearly the same confidence when any snapshot of spherocytes is fed. This indicates great confusion in classifying the mixture of these two particles in the single-frame-activated sorter, which uses only one frame. C The dynamic trends of event count for the two particles rotating throughout the FOV. The event counts are greater in the squeezing region because particles have the highest velocity in this region. D Comparison of the classification results for the two particles by NEVACS and the single-frame-activated sorter. E The receiver operating characteristic (ROC) curves and area under the curve (AUC) of NEVACS and the single-frame-activated sorter in classifying the regular RBCs and spherocytes under all the spherocyte proportions.
Fig. 5
Fig. 5. FOV-splitting multi-channel bright-fluorescent spatiotemporal imaging and sorting of different particles.
A Side-view schematic of FOV-splitting multi-channel imaging via a single event camera. `F' and `OL' refer to the filter and optical lens, respectively. B The customized FOV-splitting F3 filter assembled with the photodiode (PD) sensor of the event camera. One-half of the PD sensor array images the fluorescent field, while the other half images the bright field. C Typical images of three particles in the fluorescent field, the field junction, and the bright field, where the red dotted line marks the bright-fluorescent field junction. Only the dead Hela cells could be seen in the fluorescent field. The experiment was repeated 20 times independently with similar results. D The detected event blobs in FOV-splitting NEVACS, where the red dotted line and black dotted line mark the bright-fluorescent-field junction and the boundary of the funnel-like microfluidic channel, respectively. The halo of emission light in a fluorescent field is recorded by the event camera due to its sensitivity to the intensity change, causing reduced image quality in fluorescence images. The experiment was repeated 20 times independently with similar results. E Representative dynamic trends of event count for different particles passing throughout the FOV. The event counts are greater in the squeezing region because particles have the highest velocity in this region. F Representative, bright-field, and fluorescent microscopic images of collected particles after sorting by the single-frame-activated sorter (top) and NEVACS (bottom) for the living Hela-dead Hela-bead mixture. The experiment was repeated 20 times independently with similar results. G Comparison of the control subsystem overall efficiency for FOV-splitting NEVACS and dual-sensor NEVACS. 20 biological replicates are performed, and data are presented as mean values ± SD.

Similar articles

Cited by

References

    1. Boutros, M., Heigwer, F. & Laufer, C. Microscopy-based high-content screening. Cell163, 1314–1325 (2015). - PubMed
    1. Lai, QueenieT. K. et al. High-throughput time-stretch imaging flow cytometry for multi-class classification of phytoplankton. Opt. Express24, 28170–28184 (2016). - PubMed
    1. Blasi, T. et al. Label-free cell cycle analysis for high-throughput imaging flow cytometry. Nat. Commun.7, 10256 (2016). - PMC - PubMed
    1. Mikami, H. et al. Ultrafast confocal fluorescence microscopy beyond the fluorescence lifetime limit. Optica5, 117–126 (2018).
    1. Lei, C. et al. High-throughput imaging flow cytometry by optofluidic time-stretch microscopy. Nat. Protoc.13, 1603–1631 (2018). - PubMed

Publication types

LinkOut - more resources