. 2024 Dec 30;9(1):367.
doi: 10.1038/s41392-024-02076-9.

Malate initiates a proton-sensing pathway essential for pH regulation of inflammation

Affiliations

Malate initiates a proton-sensing pathway essential for pH regulation of inflammation

Yu-Jia-Nan Chen et al. Signal Transduct Target Ther. .

Abstract

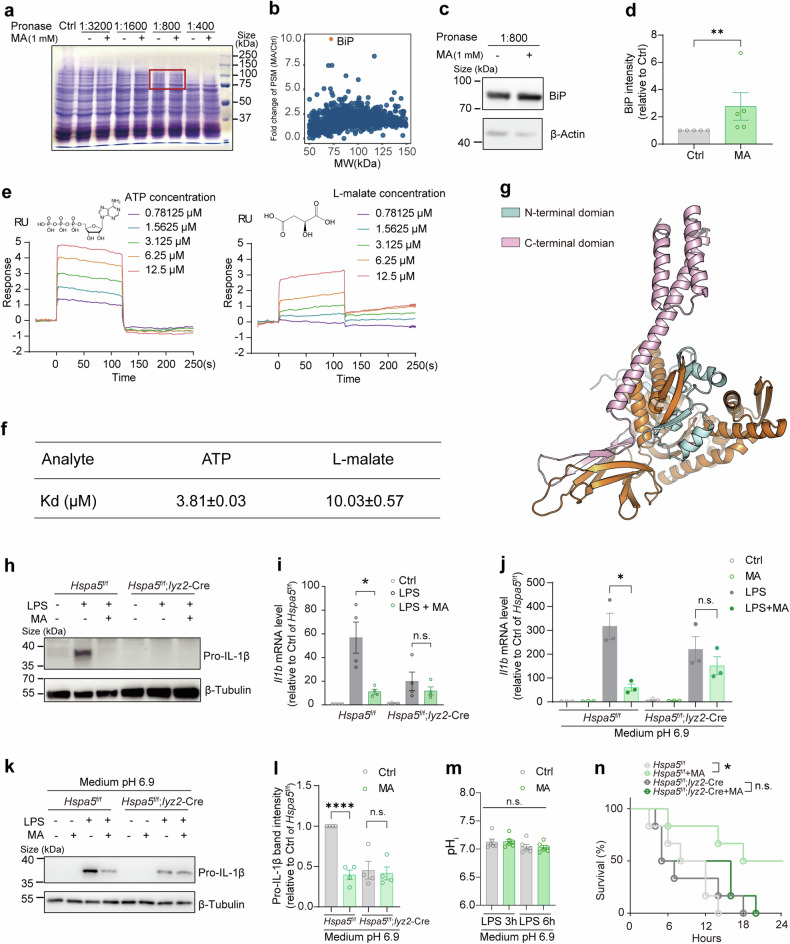
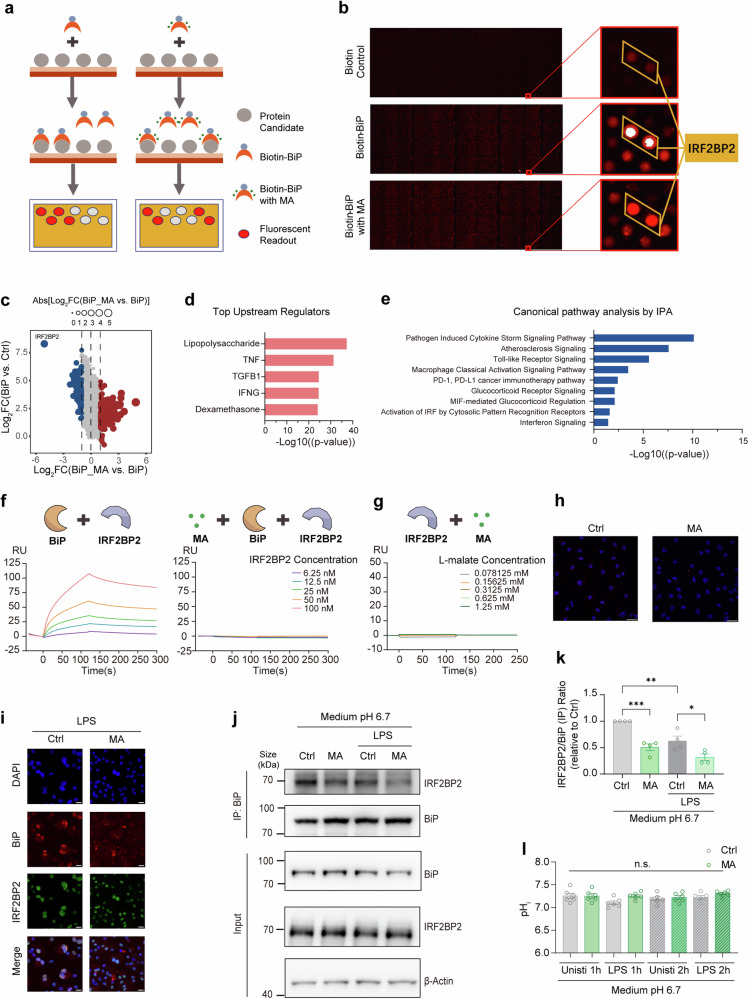
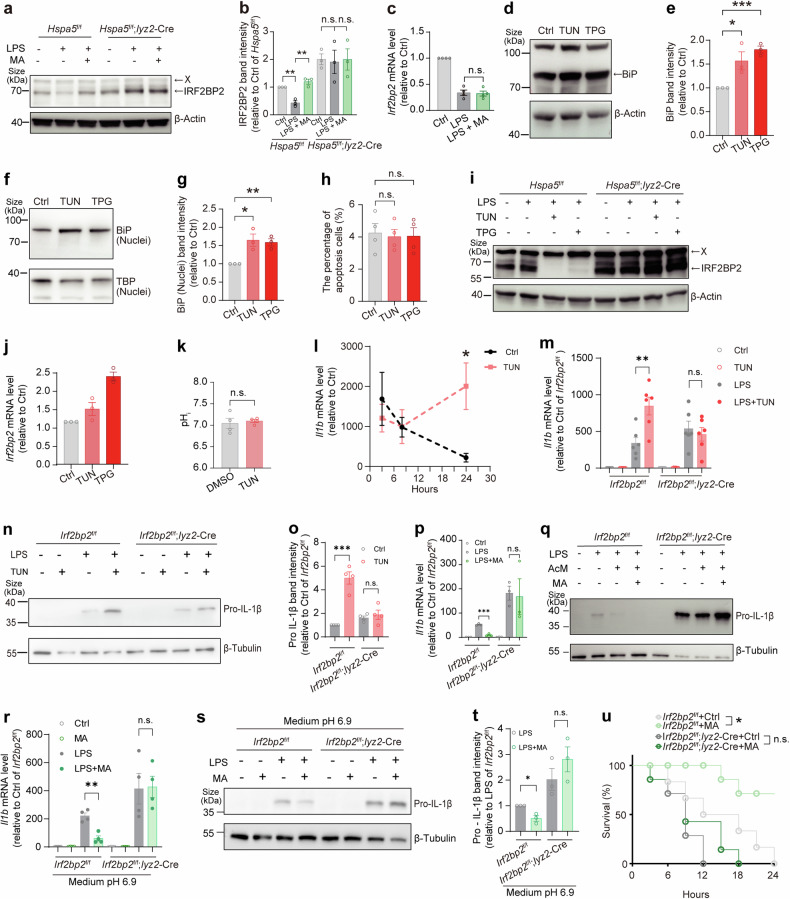
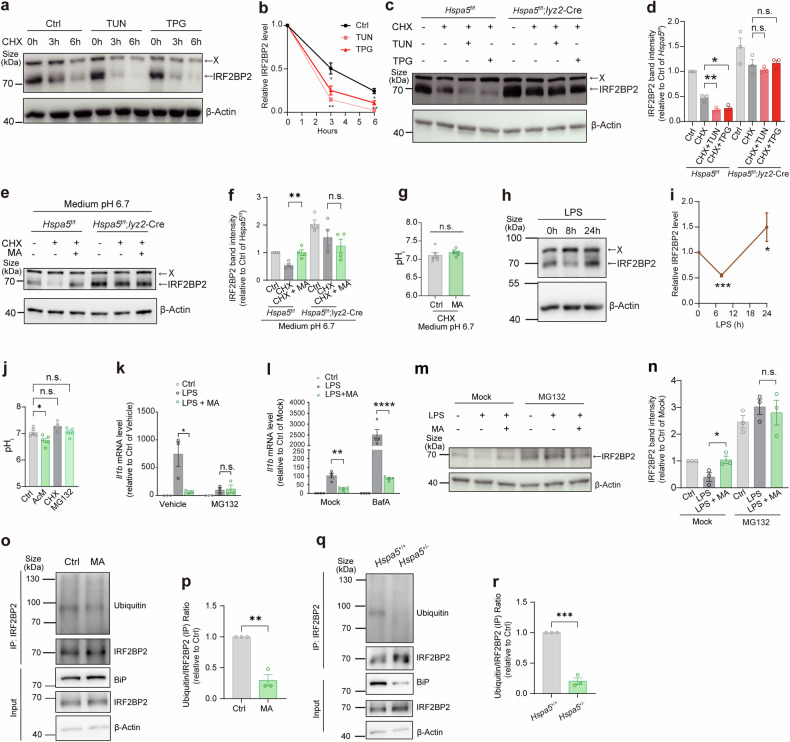
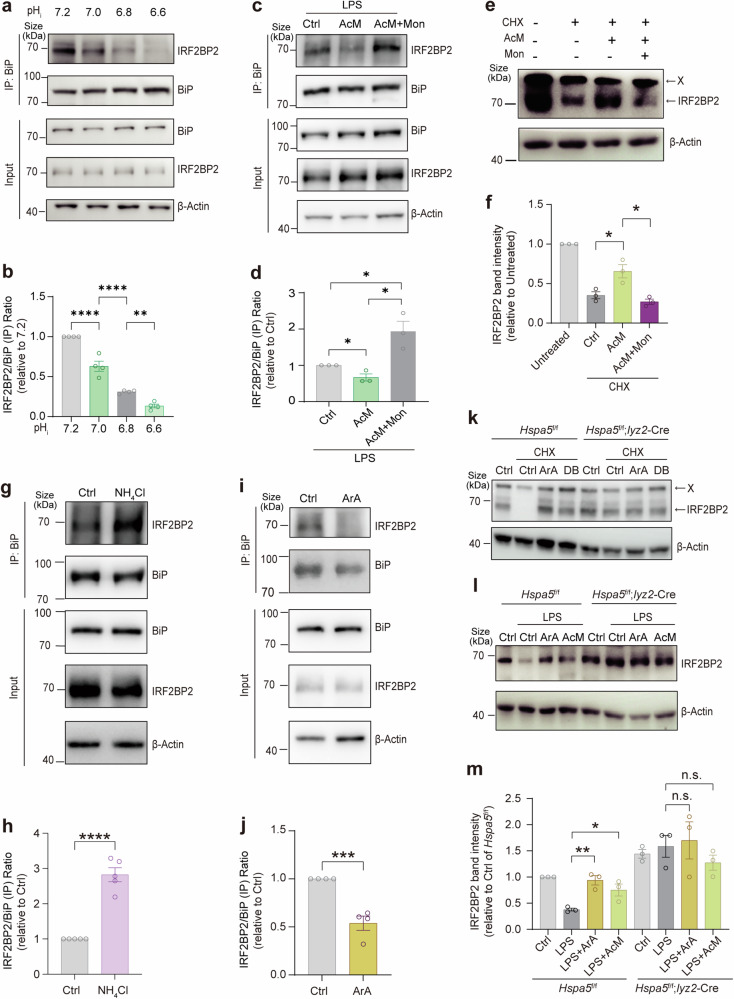
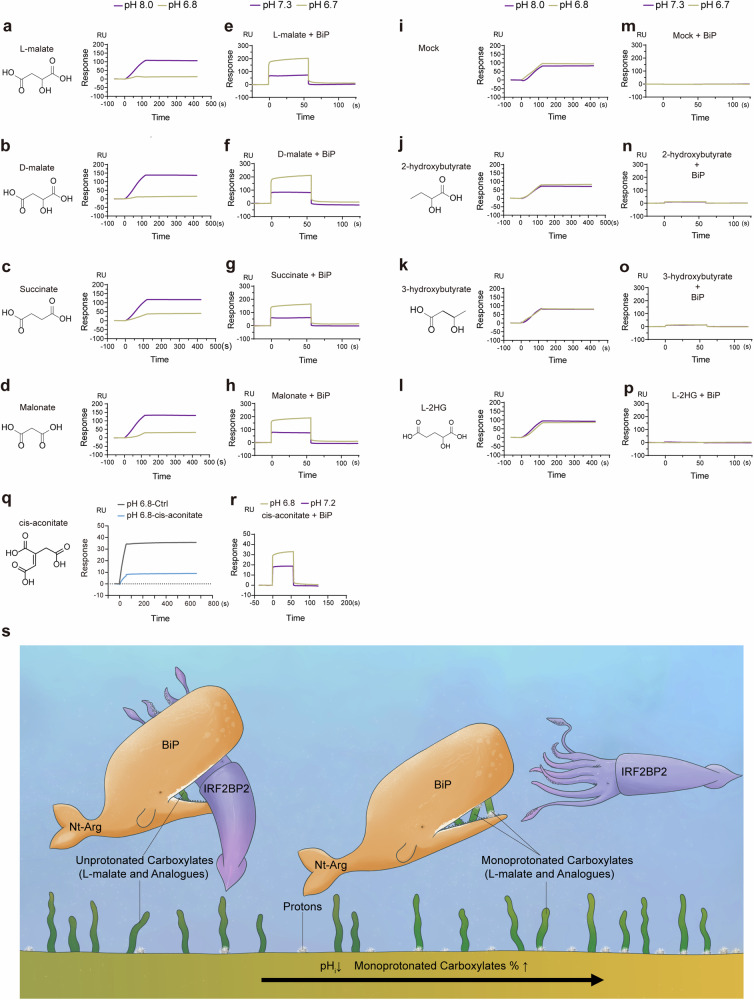
Metabolites can double as a signaling modality that initiates physiological adaptations. Metabolism, a chemical language encoding biological information, has been recognized as a powerful principle directing inflammatory responses. Cytosolic pH is a regulator of inflammatory response in macrophages. Here, we found that L-malate exerts anti-inflammatory effect via BiP-IRF2BP2 signaling, which is a sensor of cytosolic pH in macrophages. First, L-malate, a TCA intermediate upregulated in pro-inflammatory macrophages, was identified as a potent anti-inflammatory metabolite through initial screening. Subsequent screening with DARTS and MS led to the isolation of L-malate-BiP binding. Further screening through protein‒protein interaction microarrays identified a L-malate-restrained coupling of BiP with IRF2BP2, a known anti-inflammatory protein. Interestingly, pH reduction, which promotes carboxyl protonation of L-malate, facilitates L-malate and carboxylate analogues such as succinate to bind BiP, and disrupt BiP-IRF2BP2 interaction in a carboxyl-dependent manner. Both L-malate and acidification inhibit BiP-IRF2BP2 interaction, and protect IRF2BP2 from BiP-driven degradation in macrophages. Furthermore, both in vitro and in vivo, BiP-IRF2BP2 signal is required for effects of both L-malate and pH on inflammatory responses. These findings reveal a previously unrecognized, proton/carboxylate dual sensing pathway wherein pH and L-malate regulate inflammatory responses, indicating the role of certain carboxylate metabolites as adaptors in the proton biosensing by interactions between macromolecules.


Conflict of interest statement

Conflict of interest: Hongming Miao is the editorial board member of Signal Transduction and Targeted Therapy, but he has not been involved in the process of the manuscript handling. Other authors declare no competing interest.

Figures

Fig. 1
Fig. 1
L-malate acts as an anti-inflammatory metabolite. (a) Three–dimensional plot coordinates are generated from fold change of Il1b, Tnfa, and Il6 expressions in LPS stimulated (24 h) BMDMs treated with vehicle versus that treated with each metabolite, and dot sizes indicate the product of these three fold changes (See also Fig. S1 for details). (b-d) LPS-stimulated (24 h) BMDMs treated with L-malate (MA) as indicated and extracellular levels of TNF-α (b) and IL-6 (c) measured by ELISA and intracellular pro-IL-1β abundance visualized by immunoblotting (d). (eg) Il1b (e), Il6 (f), Tnfa (g) mRNA expressions measured by qPCR in Mdh2−/− and WT Raw264.7 cell lines under LPS stimulation (24 h). (h) Survival rates of WT mice (n = 12) administrated intragastrically with different dosages of L-malate (50, 100, 200 and 400 mg/kg) and injected intraperitoneally with LPS. (i) Representative paws of CAIA mice (day 14) treated with or without L-malate. Scale bars, 50μm. (j) Representative H&E staining of paw of CAIA mice (day 14) treated with or without L-malate. (k, l) Swelling score (k) and clinical score (l) in CAIA mice intraperitoneally injected with different dosages of L-malate (200 and 400 mg/kg, n = 10). n ≥ 3. The data are shown as the mean ± SEM. In (b, c, e – g, h), *p < 0.05; **p < 0.01, ***p < 0.001, ****p < 0.0001. In (k and l); * < 0.05, ** < 0.01 [MA (200 mg kg-1) compared to Ctrl]; # < 0.05, ## < 0.01, ### < 0.001, #### < 0.0001 [MA (400 mg kg-1) compared to Ctrl] (unpaired Student’s t-test, one-way ANOVA, two-way ANOVA or Mantel‒Cox survival analysis). See also Supplementary Fig. 1-5
Fig. 2
Fig. 2
BiP binds L-malate and is required for its anti-inflammatory effect. (a) Coomassie blue staining of SDS-PAGE gel for Raw264.7 cell lysates which were digested with protease with or without L-malate (1 mM, pH 7.0) according to DARTS assay. The bands protected by L-malate (1 mM, pH 7.0) was indicated by red frame. Representative data from three experiments. (b) Mass spectrometry analysis revealed the enrichment of BiP protein (shown as orange dots) in the protected bands from the L-malate-treated cell lysate in DARTS assays. (c and d) Raw264.7 cell lysates were digested with protease with or without L-malate (1 mM, pH 7.0) according to DARTS assay, then the levels of BiP protein was assayed using Western blot (c) and quantified (d). (e and f) BIAcore diagram showing responses measured in resonance unit (RU) of E. coli-expressed BiP protein (chip-coupled) to ATP or L-malate (pH 7.4). Representative data from three experiments (e); KD for each interaction of BiP with ATP and L-malate is indicated (f). (g) Crystal structure of BiP (PDB: 5E84) with different regions colored by palecyan (aa 1-125), orange (aa 126-499), and palepink (aa 500-654). (h and i) Il1b mRNA expressions quantified by qPCR (h) and pro-IL-1β protein abundance visualized by immunoblotting (i) in BMDMs isolated from Hspa5f/f or Hspa5f/f; Lyz2-Cre mice. These BMDMs were treated with or without L-malate (6 mM, pH 6.7), under stimulation of LPS for 24 h. (j, k and l) Il1b mRNA expressions quantified by qPCR (j) and pro-IL-1β protein abundance visualized (k) and quantified (l) by immunoblotting in BMDMs treated with or without L-malate (6 mM) in medium pH 6.9, under stimulation of LPS for 16 h. In addition, BMDMs were isolated from Hspa5f/f or Hspa5f/f; Lyz2-Cre mice. (m) pHi of in BMDMs treated with or without L-malate (6 mM) in medium pH 6.9, under stimulation of LPS for 3-6 h. (n) Survival rate in Hspa5f/f or Hspa5f/f; Lyz2-Cre mice (n = 6) administrated intragastrically with L-malate (400 mg kg−1) and injected intraperitoneally LPS. n ≥ 3. The data are shown as the mean ± SEM. *p < 0.05; **p < 0.01, ***p < 0.001, ****p < 0.0001. (two-sided Mann‒Whitney U test, unpaired Student’s t-test, Mantel‒Cox survival analysis). See also Supplementary Fig. 6–8
Fig. 3
Fig. 3
BiP and IRF2BP2 show direct binding affinity which is impaired by L-malate. (a) Strategy for identifying L-malate-responding protein-protein interactions with BiP. (b) Overall and notable readouts in the protein-protein interaction microarrays. (c) Scatterplot of signals from the protein microarrays of the BiP, BiP + L-malate (1 mM, pH adjusted to 7.2) and control groups. Proteins whose interaction with BiP were detected to be inhibited by L-malate are shown as blue dots, while proteins whose interaction with BiP were detected to be promoted by L-malate are shown as red dots. Size of circle indicates the absolute value of the logarithm of the ratios of the binding signal in the BiP+MA-treated group to the binding signal in the BiP-treated group to base two. In addition, protein IRF2BP2 was labeled. (d) Top predicted upstream regulators of DEGs analyzed by RNA-seq in BMDMs treated with LPS compared to BMDMs treated with LPS plus L-malate (24 h). (e) Canonical pathway analysis of the DEGs from RNA-seq in BMDMs treated with LPS compared to that treated with LPS plus L-malate (12 h), which of interest were shown. (f) BIAcore diagram of IRF2BP2 (concentrations indicated with colored lines) and BiP (chip-coupled) with or without L-malate (6 mM, pH 7.4). (g) BIAcore diagram of IRF2BP2 (chip-coupled) and L-malate (pH 7.4, concentrations indicated with colored lines). (h) The red spots represent BiP-IRF2BP2 bindings detected by PLA assay in BMDMs treated with or without L-malate (6 mM, pH 6.7), under stimulation of LPS for 3 h. Nuclei are stained with DAPI. Scale bars, 20 μm. Representative data from three experiments. (i) Immunofluorescent staining showing BiP-IRF2BP2 co-localizations in LPS-stimulated BMDMs treated with or without L-malate (6 mM, pH 6.7) for 1 h. Nuclei are stained with DAPI. Scale bars, 10 μm. Representative data from three experiments. (j and k) Cellular BiP-IRF2BP2 interactions shown by Western blot analysis of co-immunoprecipitation in MG132-pretreated (5 μM, 0.5 h) Raw264.7 cell lines treated with MG132 (0.5 μM) plus L-malate (6 mM) for 3 h in the medium pH 6.7. (l) pHi of MG132-pretreated (5 μM, 0.5 h) Raw264.7 cell lines treated with MG132 (0.5 μM) plus L-malate (6 mM) for 1-2 h in the medium pH 6.7. n ≥ 3. The data are shown as the mean ± SEM. *p < 0.05; **p < 0.01, ***p < 0.001. (two-sided Mann‒Whitney U test, unpaired Student’s t-test, Mantel‒Cox survival analysis). See also Supplementary Fig. 9
Fig. 4
Fig. 4
L-malate-BiP axis regulates the inflammatory response through IRF2BP2. (a, b) IRF2BP2 protein levels was visualized by immunoblotting (b) and quantification (c) of IRF2BP2 in BMDMs from Hspa5f/f or Hspa5f/f; Lyz2-Cre mice. These LPS-stimulated BMDMs were incubated with/without L-malate (6 mM, medium pH 6.7, 8 h). (c) Irf2bp2 mRNA expressions quantified by qPCR in LPS-stimulated BMDMs treated with or without L-malate (6 mM, medium pH 6.7, 8 h). (d-g) BiP protein levels of whole-cell (d, e) or nuclei (f, g) of BMDMs treated with/without Tunicamycin (TUN) (0.1 μM) or Thapsigargin (TPG) (0.1 μM) for 16 h. (h) Apoptosis rates detected by flow cytometry of BMDMs treated with/without Tunicamycin (0.1 μM) or Thapsigargin (0.1 μM) under 24 h stimulation of LPS. In addition, Tunicamycin (0.1 μM) or Thapsigargin (0.1 μM) was added 16 h before LPS stimulation. (i) IRF2BP2 protein abundance visualized by immunoblotting in BMDMs from Hspa5f/f or Hspa5f/f; Lyz2-Cre mice. These BMDMs were incubated with/without Tunicamycin (0.1 μM) or Thapsigargin (0.1 μM) and stimulated with LPS (2 h). In addition, Tunicamycin (0.1 μM) or Thapsigargin (0.1 μM) was added 16 h before LPS stimulation. Representative data from three experiments. (j) Irf2bp2 mRNA levels measured by qPCR in BMDMs isolated from Hspa5f/f or Hspa5f/f; Lyz2-Cre mice. These BMDMs were stimulated with LPS (2 h) and incubated with/without Tunicamycin (0.1 μM) or Thapsigargin (0.1 μM) which were added 16 h before LPS stimulation. (k) pHi of BMDMs incubated with/without Tunicamycin (0.1 μM) for 16 h. (l) Il1b mRNA levels in BMDMs stimulated with LPS (3 h, 8 h, 24 h) and incubated with/without Tunicamycin (0.1 μM) or Thapsigargin (0.1 μM) which were added 16 h before LPS stimulation. (m-o) Il1b mRNA levels quantified by qPCR (m) and pro-IL-1β protein levels visualized (n) and quantified (o) by immunoblotting in BMDMs isolated from Irf2bp2f/f or Irf2bp2f/f; Lyz2-Cre mice. These BMDMs were incubated with/without Tunicamycin (0.1 μM) or Thapsigargin (0.1 μM) and stimulated with LPS (16 h). In addition, Tunicamycin (0.1 μM) or Thapsigargin (0.1 μM) was added 24 h before LPS stimulation. (p, q) Il1b mRNA (p) and pro-IL-1β protein abundance (q) in BMDMs isolated from Irf2bp2f/f or Irf2bp2f/f; Lyz2-Cre mice treated with medium (pH 6.7) or L-malate (6 mM, medium pH 6.7), under stimulation of LPS for 24 h. (r-t) Il1b mRNA (r) and pro-IL-1β protein levels (s and t) in BMDMs isolated from Irf2bp2f/f or Irf2bp2f/f; Lyz2-Cre mice. These BMDMs under a controlled medium pH (6.9) were treated with or without L-malate (6 mM), under stimulation of LPS for 16 h. (u) Survival in Irf2bp2f/f or Irf2bp2f/f; Lyz2-Cre mice intragastric administrated with L-malate (400 mg kg−1) and intraperitoneally injected LPS (n = 6-7 per group). The “X” means unknown proteins detected in immunoblotting visualizing IRF2BP2. n ≥ 3. Data are shown as mean ± SEM. *p < 0.05; **p < 0.01; ***p < 0.001 (unpaired Student’s t-test, Mantel-Cox survival analysis). See also Supplementary Figs. 6 and 8
Fig. 5
Fig. 5
L-malate protects IRF2BP2 from BiP-driven protein degradation. (a and b) IRF2BP2 protein levels in CHX-treated (0 h, 3 h, and 6 h) BMDMs incubated with Tunicamycin (0.1 μM) or Thapsigargin (0.1 μM) added 16 h before CHX addition. (c and d) IRF2BP2 protein levels visualized (c) and quantified (d) by immunoblotting of BMDMs isolated from Hspa5f/f or Hspa5f/f; Lyz2-Cre mice. These BMDMs were treated by CHX (3 h) and incubated with/without Tunicamycin (0.1 μM) or Thapsigargin (0.1 μM) added 16 h before CHX addition. (e and f) IRF2BP2 abundance was visualized by immunoblotting (e) and quantification (f) of IRF2BP2 in BMDMs from Hspa5f/f or Hspa5f/f; Lyz2-Cre mice. These BMDMs under a controlled medium pH (6.7) were treated by CHX and incubated with or without L-malate (6 mM, 6 h). (g) pHi of BMDMs (controlled medium pH 6.7) treated with CHX (2 h) and incubated with or without L-malate (6 mM, 6 h). (h and i) IRF2BP2 abundance was visualized by immunoblotting (h) and quantification (i) of IRF2BP2 in BMDMs treated by LPS for 0, 8 h and 24 h. n = 3. (j) pHi of BMDMs treated with acidized medium (pH 6.7, 3 h), MG132 (5 μM, 0.5 h) or CHX (6 h). (k) Il1b mRNA levels in LPS-stimulated BMDMs treated with/without L-malate (6 mM) or MG132 (0.5 μM). In addition, MG132 (5 μM) was added in MG132-treated groups 0.5 h before LPS stimulation. (l) Il1b mRNA expressions in LPS-stimulated BMDMs treated with/without L-malate (6 mM, medium pH 6.7) and bafilomycin A (BafA) for 24 h. (m and n) IRF2BP2 protein levels in unstimulated and LPS-stimulated BMDMs treated with L-malate (6 mM, medium pH 6.7) and MG132 (0.5 μM) for 8 h. In addition, MG132 (5 μM) was added in MG132-treated groups 0.5 h before LPS stimulation. (o and p) IRF2BP2 ubiquitination shown by Western blot analysis of co-immunoprecipitation in MG132-pretreated (5 μM, 0.5 h) Raw264.7 cells treated with MG132 (0.5 μM) and L-malate (6 mM) in medium pH 6.7 for 3 h. (q and r) IRF2BP2 ubiquitination shown by Western blot analysis of co-immunoprecipitation in MG132-treated (5 μM, 0.5 h) Hspa5+/+ or Hspa5+/− Raw264.7 cell line. The “X” means unknown proteins detected in immunoblotting visualizing IRF2BP2. n ≥ 3. Data are shown as mean ± SEM. *p < 0.05; **p < 0.01; ***p < 0.001; ****p < 0.0001 (unpaired Student’s t-test)
Fig. 6
Fig. 6
BiP-IRF2BP2 signaling senses intracellular protons independently of lysosomal pH. (a and b) Cellular BiP-IRF2BP2 interactions shown by Western blot analysis of co-immunoprecipitation in MG132-pretreated (5 μM, 2 h) peritoneal macrophages which were incubated with Nigericin (10 μM), Valinomycin (10 μM) and MG132 (5 μM) for 3 h in calibration buffer under different pH (7.2, 7.0, 6.8, 6.6). (c and d) Cellular BiP-IRF2BP2 interactions shown by Western blot analysis of co-immunoprecipitation in MG132-pretreated (5 μM, 0.5 h) Raw264.7 cells which were treated with acidized medium (AcM) (pH 6.7) or with AcM plus monensin (0.1 μM) in the presence of LPS and MG132 (0.5 μM) for 6 h. (e and f) IRF2BP2 protein levels visualized (e) and quantified (f) by Western blot in CHX-treated (6 h) BMDMs with or without acidized medium (AcM) (pH 6.7) and monensin. (g and h) Cellular BiP-IRF2BP2 interactions shown by Western blot analysis of co-immunoprecipitation in MG132-pretreated (5 μM, 0.5 h) Raw264.7 cells which were incubated by Ringer’s solution containing glucose (11 mM), MG132 (0.5 μM) with or without NH4Cl (30 mM) for 2 h. (i and j) Cellular BiP-IRF2BP2 interactions shown by Western blot analysis of co-immunoprecipitation in MG132-pretreated (5 μM, 0.5 h) Raw264.7 cells which were treated MG132 (0.5 μM) by with or without ArA (200 μM, neutralized pH) for 6 h. (k) IRF2BP2 protein abundance was visualized by immunoblotting in BMDMs isolated from Hspa5f/f or Hspa5f/f; Lyz2-Cre mice. These CHX-treated BMDMs were treated with/without ArA or DB (9 h). (l and m) IRF2BP2 protein levels in BMDMs isolated from Hspa5f/f or Hspa5f/f; Lyz2-Cre mice. These LPS-stimulated BMDMs were treated with/without AcM (pH 6.7) or ArA (8 h). n ≥ 3. Data are shown as mean ± SEM. *p < 0.05; **p < 0.01; ***p < 0.001; ****p < 0.0001 (unpaired Student’s t-test)
Fig. 7
Fig. 7
pH reduction facilitates L-malate and analogues to bind BiP and to inhibit BiP-IRF2BP2 interaction. (a-d, i-l) BIAcore diagram of BiP (chip-coupled) and IRF2BP2 (25 nM) with or without different small molecules at concentration of 0.2 mM in different pH (8.0 indicated in purple and 6.8 indicated in brown). (e-h, m-p) BIAcore diagram of different small molecules at concentration of 1 mM with BiP protein (chip-coupled) in different pH (7.3 indicated in purple, 6.7 indicated in brown). (q) BIAcore diagram of BiP (chip-coupled) and IRF2BP2 (25 nM) with or without cis-aconitate (500 μM) in pH 6.8. (r) BIAcore diagram of cis-aconitate (1 mM) BiP protein (chip-coupled) in different pH (7.2 indicated in purple, 6.8 indicated in brown). (s) A conceptual graph illustrating the role of L-malate and analogues in pH sensing of BiP-IRF2BP2 interaction. n = 3. See also Supplementary Fig. 10
Fig. 8
Fig. 8
BiP-IRF2BP2 signaling links pH fluctuation with inflammation. (a, c) Il1b mRNA levels (a) and pro-IL-1β protein abundance (c) in BMDMs isolated from Hspa5f/f or Hspa5f/f; Lyz2-Cre mice treated with or without acidized medium (AcM) (pH 6.7), under stimulation of LPS for 24 h. (b) Il1b mRNA levels by qPCR in BMDMs isolated from Irf2bp2f/f or Irf2bp2f/f; Lyz2-Cre mice treated with or without acidized medium (AcM) (pH 6.7), under stimulation of LPS for 24 h. (d, f) Protein abundance of pro-IL-1β (d) and mRNA levels of Il1b (f) in BMDMs isolated from Irf2bp2f/f or Irf2bp2f/f; Lyz2-Cre mice treated with or without Monensin (1 μM), under stimulation of LPS for 24 h. (e) Il1b expressions in BMDMs isolated from Hspa5f/f or Hspa5f/f; Lyz2-Cre mice treated with or without monensin (1 μM), under stimulation of LPS for 24 h. (g, h) pro-IL-1β protein levels in BMDMs isolated from Hspa5f/f or Hspa5f/f; Lyz2-Cre mice treated with or without NH4Cl (15 mM), under stimulation of LPS for 16 h. (i) Il1b mRNA levels in BMDMs isolated from Hspa5f/f or Hspa5f/f; Lyz2-Cre mice treated with or without NH4Cl (15 mM), under stimulation of LPS for 8 h. (j) Il1b mRNA levels in BMDMs isolated from Irf2bp2f/f or Irf2bp2f/f; Lyz2-Cre mice treated with or without NH4Cl (15 mM), under stimulation of LPS for 8 h. (k, l) pro-IL-1β protein levels in BMDMs isolated from Irf2bp2f/f or Irf2bp2f/f; Lyz2-Cre mice treated with or without NH4Cl (15 mM), under stimulation of LPS for 16 h. (m) Representative H&E-stained sections of colons from Hspa5f/f, Hspa5f/f; Lyz2-Cre mice sampled on day 6 after the saline or NaOH exposure. Scale bar 100 μm. (n) Length of colons from Hspa5f/f or Hspa5f/f; Lyz2-Cre mice at day 6 of NaOH-induced colitis model (n = 7-9 per group). (o, p) mRNA levels of Il1b (o) and Il6 (p) in colons collected at day 3 after the saline or NaOH exposure, analyzed by qPCR. (q) Immunoreactive staining (brown) for IRF2BP2 [scale bar, 100 (left) or 50 (right) μm]. (r) Western blot of IRF2BP2 in colons of mixed sample from Hspa5f/f or Hspa5f/f; Lyz2-Cre mice at day 3 of NaOH-induced colitis model (n = 8 per group). The “X” means unknown proteins detected in immunoblotting visualizing IRF2BP2. n ≥ 3. Data are shown as mean ± SEM. *p < 0.05; **p < 0.01; ***p < 0.001 (unpaired Student’s t-test)

References

    1. Spiller, K. L. & Koh, T. J. Macrophage-based therapeutic strategies in regenerative medicine. Adv. Drug Deliv. Rev.122, 74–83 (2017). - PMC - PubMed
    1. Ji, L. et al. Slc6a8-Mediated Creatine Uptake and Accumulation Reprogram Macrophage Polarization via Regulating Cytokine Responses. Immunity51, 272–284.e277 (2019). - PubMed
    1. Ryan, D. G. & O’Neill, L. A. J. Krebs Cycle Reborn in Macrophage Immunometabolism. Annu Rev. Immunol.38, 289–313 (2020). - PubMed
    1. Hooftman, A. & O’Neill, L. A. J. The Immunomodulatory Potential of the Metabolite Itaconate. Trends Immunol.40, 687–698 (2019). - PubMed
    1. Mills, E. L. et al. Itaconate is an anti-inflammatory metabolite that activates Nrf2 via alkylation of KEAP1. Nature556, 113–117 (2018). - PMC - PubMed

Publication types

LinkOut - more resources