. 2024 Dec 30;15(1):10754.
doi: 10.1038/s41467-024-54917-4.

SARS-CoV-2 infection of human pluripotent stem cell-derived vascular cells reveals smooth muscle cells as key mediators of vascular pathology during infection

Affiliations

SARS-CoV-2 infection of human pluripotent stem cell-derived vascular cells reveals smooth muscle cells as key mediators of vascular pathology during infection

Alexsia Richards et al. Nat Commun. .

Abstract

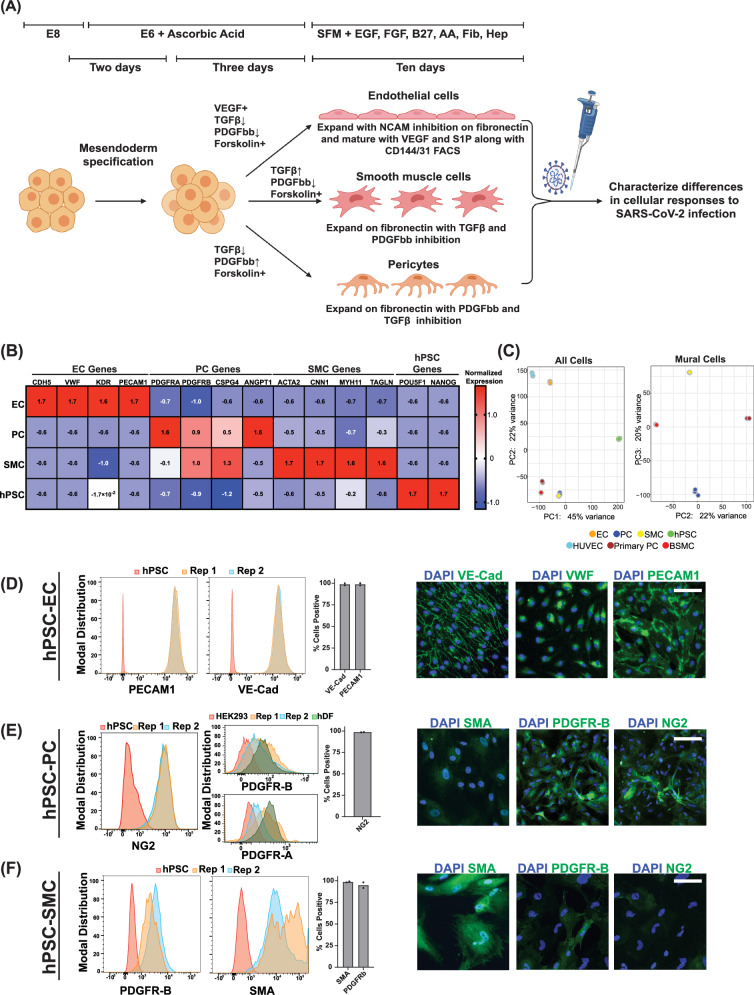
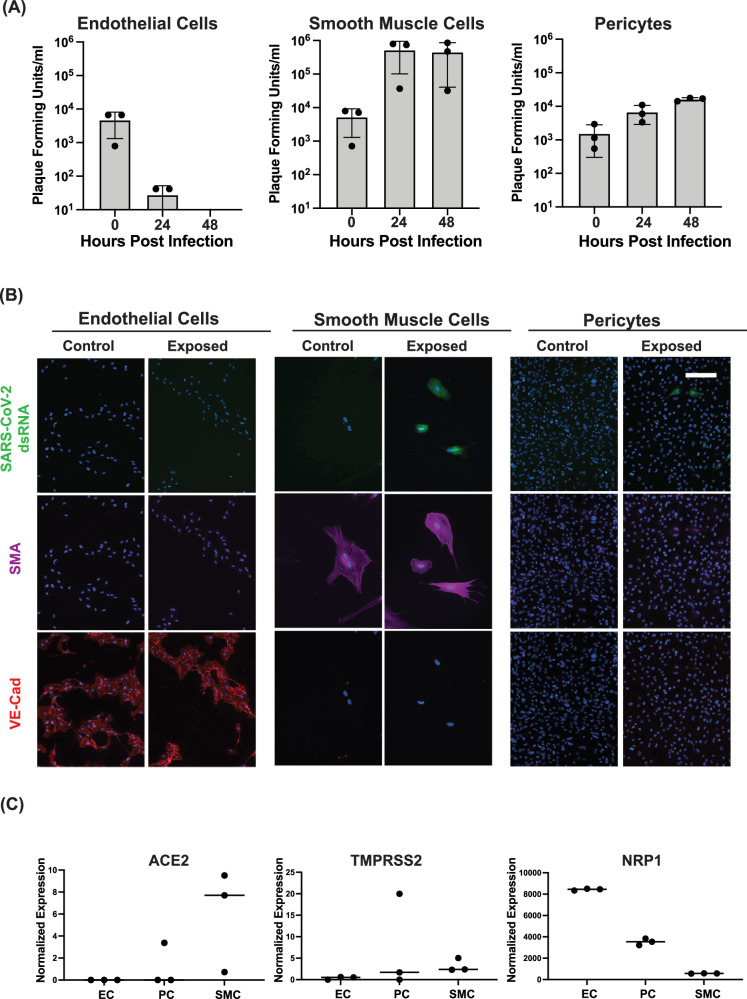
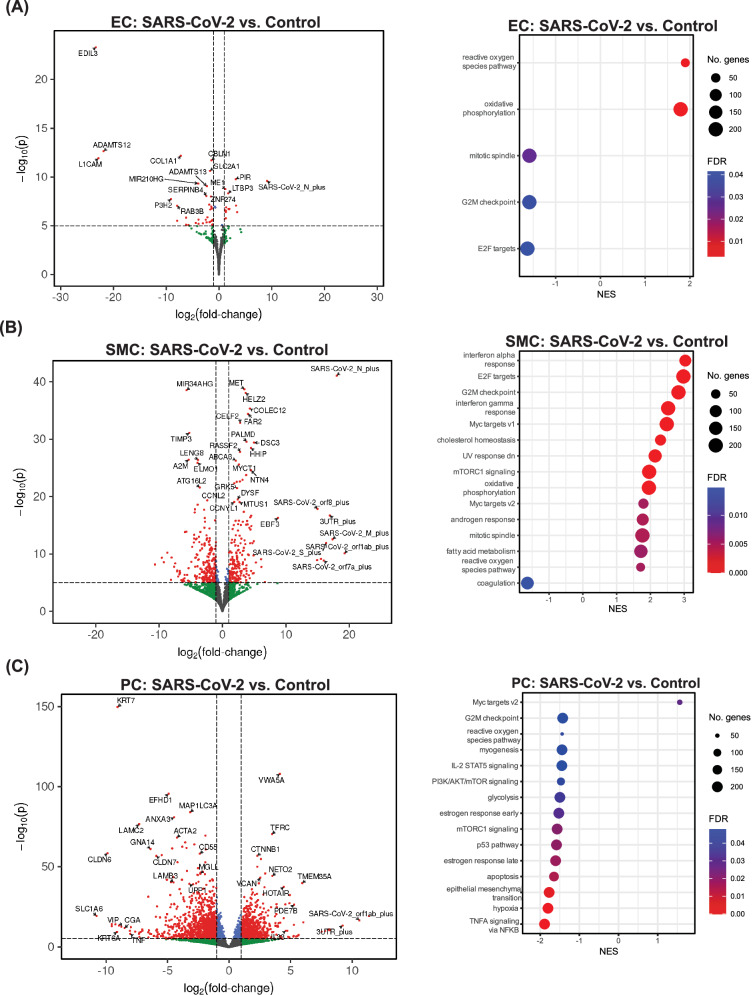
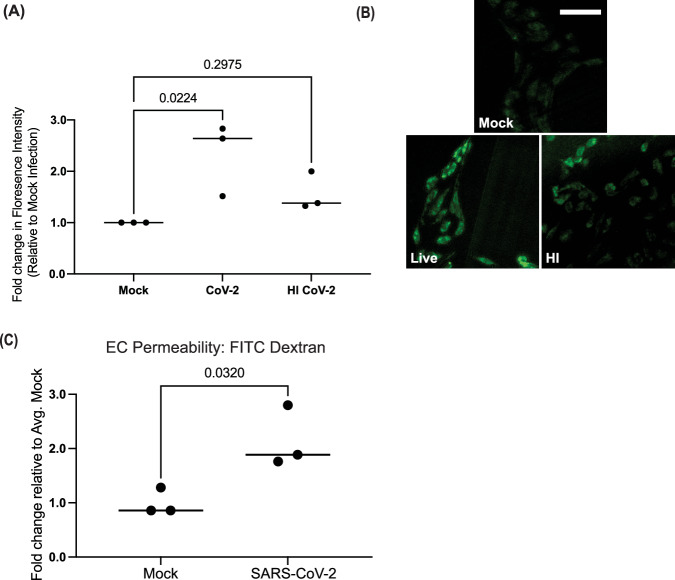
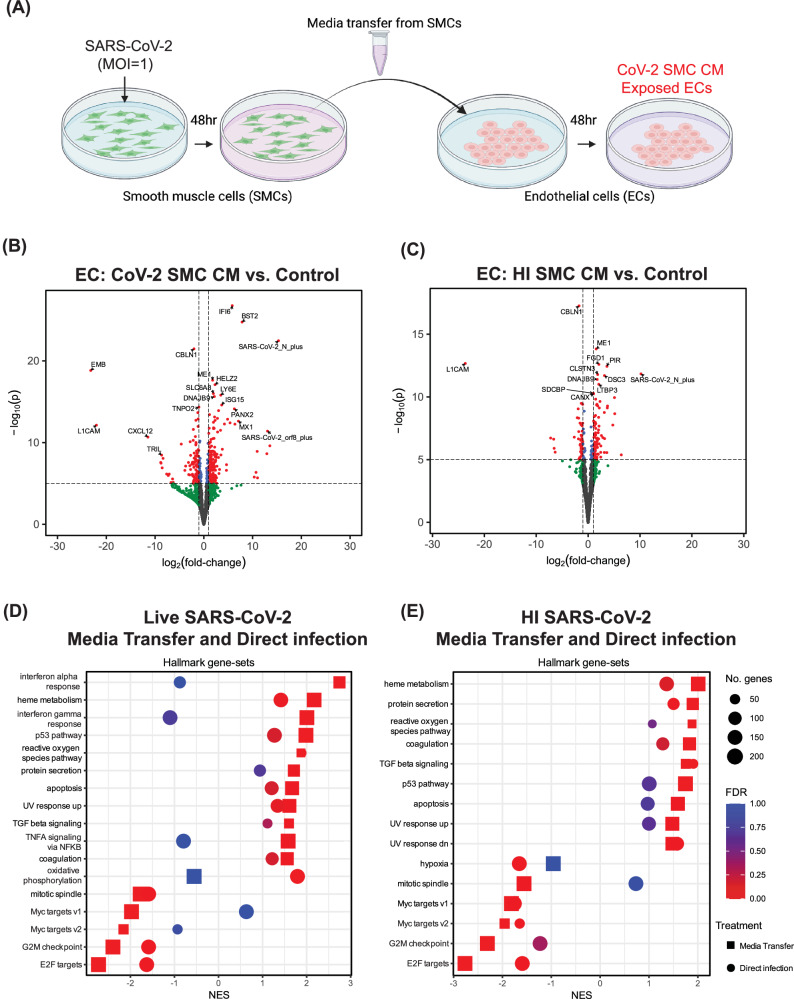
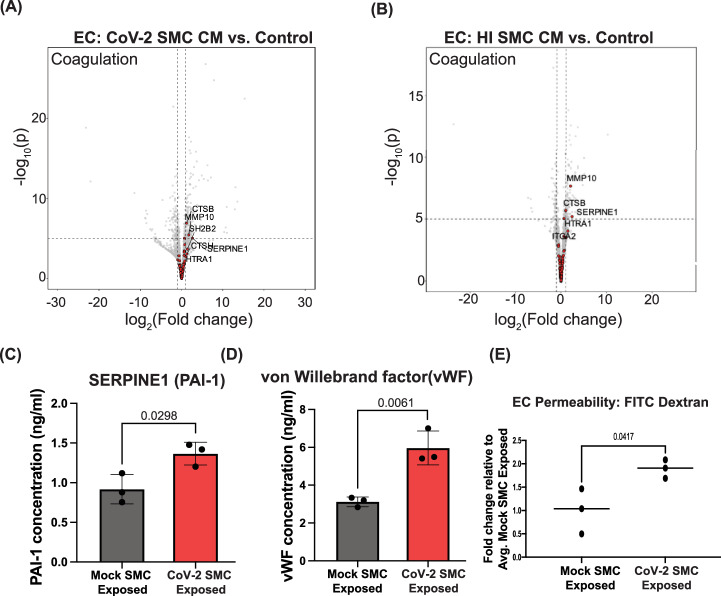
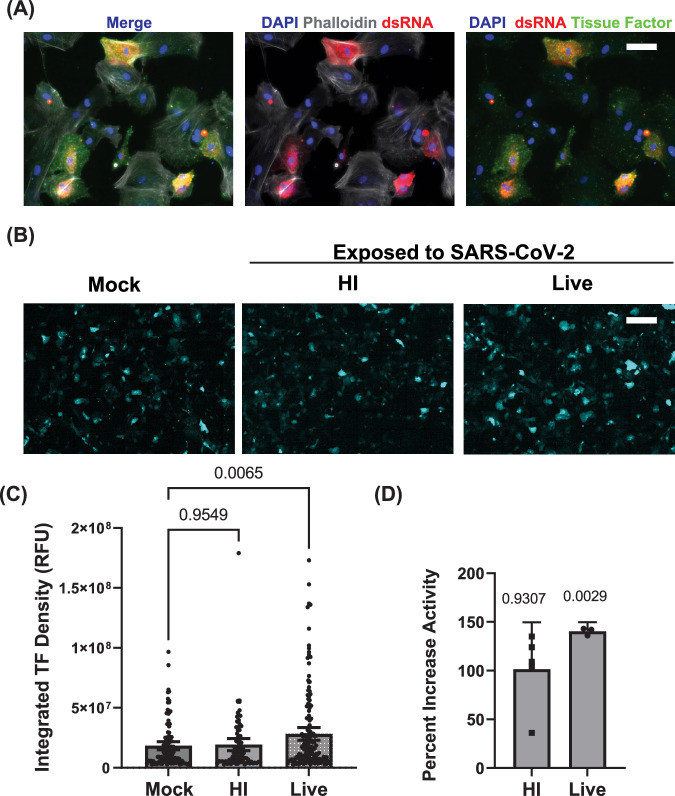
Although respiratory symptoms are the most prevalent disease manifestation of infection by Severe Acute Respiratory Syndrome Coronavirus 2 (SARS-CoV-2), nearly 20% of hospitalized patients are at risk for thromboembolic events. This prothrombotic state is considered a key factor in the increased risk of stroke, which is observed clinically during both acute infection and long after symptoms clear. Here, we develop a model of SARS-CoV-2 infection using human-induced pluripotent stem cell-derived endothelial cells (ECs), pericytes (PCs), and smooth muscle cells (SMCs) to recapitulate the vascular pathology associated with SARS-CoV-2 exposure. Our results demonstrate that perivascular cells, particularly SMCs, are a susceptible vascular target for SARS-CoV-2 infection. Utilizing RNA sequencing, we characterize the transcriptomic changes accompanying SARS-CoV-2 infection of SMCs, PCs, and ECs. We observe that infected SMCs shift to a pro-inflammatory state and increase the expression of key mediators of the coagulation cascade. Further, we show human ECs exposed to the secretome of infected SMCs produce hemostatic factors that contribute to vascular dysfunction despite not being susceptible to direct infection. The findings here recapitulate observations from patient sera in human COVID-19 patients and provide mechanistic insight into the unique vascular implications of SARS-CoV-2 infection at a cellular level.


Conflict of interest statement

Competing interests: The authors declare the following competing interests. R.J. is an advisor/co-founder of Fate Therapeutics and Fulcrum Therapeutics. D.J.M. has sponsored research, consults, and/or has stock options/stock in Medicenna, Lyell, Attivare, Epoulosis, Limax Biosciences, Lightning Bio, and Oddity Tech, licensed intellectual property with Alkem and Amend Surgical, and Board of Directors, ATCC.The remaining authors (A.R., A.K., T.W., M.F., X.G., L.G., R.K., T.L., Z.W.) declare no competing interests.

Figures

Fig. 1
Fig. 1. Derivation of hPSC-derived vascular endothelial cells, smooth muscle cells, and pericytes.
A Schematic of directed differentiation of hPSCs to vascular endothelial cells (ECs), smooth muscle cells (SMCs), and pericytes (PCs) (Created using BioRender). B Bulk RNA sequencing was performed on hPSC-derived ECs, PCs, and SMCs. The normalized expression values of known EC, PC, or SMC marker genes were quantitated over three biological replicates. The values plotted represent scaled normalized expression values for each gene across samples (C) (left) Principal component analysis (PCA) on bulk-RNA sequencing data from hPSCs, hPSC-ECs, hPSC-PCs, and hPSC-SMCs and primary endothelial cells (HUVECs), primary pericytes, and primary bronchial smooth muscle cells (BSMCs). (right) Mural cell-only PCA analysis (Primary pericytes, BSMCs, hPSC-PCs, and hPSC-SMCs) (D) Expression of PECAM1 and VE-Cadherin was quantitated by flow cytometry on hPSCs or on two independent differentiations of ECs. Data points on the bar graph represent values from two independent differentiations. Expression of VE-Cadherin, VWF, and PECAM1 in hPSC-derived ECs was observed by immunofluorescence. E Expression of NG2 was quantitated by flow cytometry on hPSCs or on two independent differentiations of PCs. Data points on bar graph represent values from two independent differentiations. Expression of PDGFR-B, and PDGFR-A was quantitated by flow cytometry on HEK293 cells, human dermal fibroblast (hDF) and two independent PC differentiation. Expression of SMA, PDGFR-B, and NG2 in hPSC derived PCs was observed by immunofluorescence. F Expression of PDGFR-B or SMA was quantitated by flow cytometry on hPSCs or on two independent differentiations of SMCs. Data points on the bar graph represent values from two independent differentiations. Expression of SMA, PDGFR-B, and NG2 in hPSC-derived SMCs was observed by immunofluorescence. Scale bar = 50 µm for all immunofluorescence images.
Fig. 2
Fig. 2. hPSC-derived ECs, PCs, and SMCs show selective susceptibility to SARS-CoV-2 infection.
A 10e5 hPSC-derived ECs, SMCs, and PCs were infected at an MOI of 0.1 (10e4 PFU) with SARS-CoV-2. The amount of infectious virus released into the media at the indicated time post-infection was quantitated by plaque assay in three independent experiments. Titers of EC 48 h.p.i samples were below the limit of detection of 10 plaque forming units. Data are presented as mean values +/- SD. B hPSC-derived ECs, SMCs, and PCs were infected at an MOI of 0.1 with SARS-CoV-2 and fixed at 48 hours post-infection. Fixed cells were stained with an antibody directed against dsRNA as well as antibodies directed against SMA or VE-Cadherin and imaged by immunofluorescence. The experiment was performed three times with similar results. Representative images from a single experiment are shown. C Expression of known SARS-CoV-2 receptors ACE2, TMPRSS2, and NRPP1 was quantitated by bulk sequencing on hPSC-derived ECs, PCs, and SMCs. Values shown are from three independent biological replicates. Scale bar = 50 µm for all immunofluorescence images.
Fig. 3
Fig. 3. hPSC-derived ECs, SMCs, and PCs display unique responses to SARS-CoV-2 exposure.
Bulk RNA sequencing was performed on RNA isolated from hPSC-derived vascular ECs, PCs, and SMCs 48 hours after virus exposure (MOI = 1). For all volcano plots, effect sizes were estimated using DESeq2, with (two-tailed) p-values computed using the Wald statistic. A full list of differentially expressed genes can be found in the Source Data file. A Volcano plots showing differential gene expression in ECs exposed to live SARS-CoV-2 compared to control uninfected ECs. Gene set enrichment analysis (GSEA) was performed on differentially expressed genes to analyze the transcriptional response to infection. Dot plots show gene-sets from the Hallmark collection of the MSigDB that were enriched (FDR < 0.05). B Volcano plots showing differential gene expression in SMCs exposed to live SARS-CoV-2 compared to control uninfected SMCs. GSEA was performed on differentially expressed genes to analyze the transcriptional response to infection. Dot plots show gene-sets from the Hallmark collection of the MSigDB that were enriched (FDR < 0.05). C Volcano plots showing differential gene expression in PCs exposed to live SARS-CoV-2 compared to control uninfected PCs. GSEA was performed on differentially expressed genes to analyze the transcriptional response to infection. Dot plots show gene-sets from the Hallmark collection of the MSigDB that were enriched (FDR < 0.05).
Fig. 4
Fig. 4. SARS-CoV-2 exposure induces reactive oxygen species production and decreases barrier function of hPSC-derived ECs.
A ECs were mock-infected or exposed to live or heat-inactivated SARS-CoV-2 for 48 hours (MOI = 1). CellROX green reagent was added at a final concentration of 5 μM, incubated for 30 minutes, and cells were analyzed by fluorescence microscopy. Green fluorescent signal showed the ROS-mediated oxidation of the reagent. The fluorescence intensity was measured for five cells for each condition for three independent experiments. For each experiment, the value plotted is the average fold change in florescence intensity relative to mock-infected cells for that experiment. Conditions were compared using a one-way ANOVA with Dunnett’s multiple comparisons test, with a single pooled variance. B Representative images of CellRox staining at 48 hours post-infection from a single experiment (Scale bar = 50 µm). C Transcytosis of FITC–tagged 10-kDa dextran across a monolayer hPSC-derived ECs. ECs were plated in transwells and infected with SARS-CoV-2 (MOI = 1) or mock-infected for 48 hours. FITC-dextran was added to the upper chamber and the fluorescence intensity of media the lower chamber was quantitated four hours after FITC-dextran addition. Three independent experiments were performed. All results are expressed as a fold change relative to the average value for mock-infected ECs. Conditions were compared using an unpaired t-test.
Fig. 5
Fig. 5. SMCs exposed to SARS-CoV-2 release factors that alter EC gene expression.
A Schematic of the experiment examining the effect of SMC-secreted factors on ECs (Created using BioRender). BE Bulk RNA sequencing was performed on RNA isolated from ECs 48 hours after exposure to SMC-conditioned media. For all volcano plots, effect sizes were estimated using DESeq2, with (two-tailed) p-values computed using the Wald statistic. A full list of differentially expressed genes can be found in the source data file. B Volcano plot of differentially expressed genes in ECs exposed to media from SARS-CoV-2 infected SMCs (CoV-2 SMC CM) compared to control ECs (Control). C Volcano plot of differentially expressed genes in ECs treated with media from SMCs exposed to heat-inactivated SARS-CoV-2 (HI SMC CM) compared to control ECs (Control). D GSEA results of ECs treated with media from SARS-CoV-2 infected SMCs compared to control ECs (Media Transfer) plotted together with GSEA results for ECs exposed to live SARS-CoV-2 compared to control ECs (Direct Infection) (E) GSEA results of ECs treated with media from SMCs exposed to heat-inactivated SARS-CoV-2 compared to control ECs (Media Transfer) plotted together with GSEA results for ECs exposed to live SARS-CoV-2 compared to control ECs (Direct Infection). In (D) and (E), the Hallmark collection of gene-sets from the MSigDB was used and gene-sets were plotted only when FDR < 0.05 for enrichment in at least one of the between-condition comparisons.
Fig. 6
Fig. 6. SARS-CoV-2 exposed SMCs release factors that promote clotting and reduce barrier function in ECs.
A Volcano plot for differential gene expression in ECs exposed to media from SARS-CoV-2 infected SMCs (CoV-2 SMC CM) compared to control ECs (Control). For all volcano plots, effect sizes were estimated using DESeq2, with (two-tailed) p-values computed using the Wald statistic. A full list of differentially expressed genes can be found in the source data file. B Volcano plot for differential gene expression in ECs exposed to media from SMCs exposed to heat-inactivated SARS-CoV-2 (HI SMC CM) compared to control ECs (Control). In both (A) and (B), genes highlighted in red correspond to the “coagulation” gene-set from the Hallmark collection of the MSigDB, with GSEA “leading edge” genes labeled by name. CE ECs were exposed to media from SARS-CoV-2- infected SMCs (CoV-2 SMC Exposed) or exposed to media from mock-infected SMCs (Mock SMC Exposed) for 48 hours. C The amount of SERPINE1(PAI-1) ECs released into the media 48 hours after CM exposure was quantitated by ELISA. Media was collected from three independent experiments and analyzed in parallel. Bar graph is the average value for each condition, and data points show the individual values from each experiment. Error bar shows +/- SD. Conditions were compared using an unpaired t-test. D The amount of von Willibrand Factor (vWF) ECs released into the media 48 hours after CM exposure was quantitated by ELISA. Media was collected from three independent experiments and analyzed in parallel. Bar graph is the average value for each condition, and data points show the individual values from each experiment. Error bar shows +/- SD. Conditions were compared using an unpaired t-test. E Transcytosis of FITC–tagged 10-kDa dextran across a monolayer hPSC-derived ECs. ECs were plated in transwells and exposed to media from SARS-CoV-2 infected SMCs (CoV-2 SMC CM) or media from mock-infected SMCs (Mock SMC Exposed) for 48 hours. FITC-dextran was added to the upper chamber, and the fluorescence intensity of media in the lower chamber was quantitated four hours after FITC-dextran addition. Three independent experiments were performed. All results are expressed as a fold change relative to the average value for mock-exposed ECs. Each dot represents the value from an independent experiment and lines show mean value across all three experiments. Conditions were compared using an unpaired t-test.
Fig. 7
Fig. 7. SARS-CoV-2 infection of SMCs increases tissue factor expression and activity.
A SMCs were infected with SARS-CoV-2 for 48 hours (MOI = 1) and stained with antibodies against dsRNA and tissue factor. Staining of actin with phalloidin was included to mark cell bodies. B Immunofluorescence staining for tissue factor in hPSC-derived SMCs exposed to either live or heat-inactivated (HI) SARS-CoV-2 or uninfected control hPSC-derived SMCs. Cells were fixed at 48 hours post-infection. Scale bar = 200 µm. The experiment was performed three times with similar results. C Quantitation of tissue factor staining shown in (B). Bar graph shows mean value, and error bar shows 95% confidence interval. Conditions were compared using a one-way ANOVA with Dunnett’s multiple comparisons test, with a single pooled variance. DTissue factor activity in cell lysate from SMCs exposed to live SARS-CoV-2 or HI SARS-CoV-2 (MOI = 1) for 48 hours was quantitated by ELISA and is reported as a percent increase compared to control uninfected SMCs. Scale bar = 50 µm for all immunofluorescence images. Activity levels were analyzed for three independent experiments for live SARS-CoV-2 treatment and five independent experiments for HI SARS-CoV-2. Levels were normalized to the average value for control SMCs for that experiment. Bar graph shows mean value, and error bar shows 95% confidence interval. Each condition was compared to 100% activity for control SMCs using a one sample t-test.

Update of

References

    1. Arora, P., Jafferany, M., Lotti, T., Sadoughifar, R. & Goldust, M. Learning from history: coronavirus outbreaks in the past. Dermatol Ther.33, e13343 (2020). - PubMed
    1. WHO, Vol. 2021.
    1. Acharya, Y., Alameer, A., Calpin, G., Alkhattab, M. & Sultan, S. A comprehensive review of vascular complications in COVID-19. J. Thromb. Thrombol.53, 586–593 (2022). - PMC - PubMed
    1. Merschel, M. American Heart Association News Stories.https://www.cbsnews.com/tag/american-heart-association/ (2023).
    1. Xie, Y., Xu, E., Bowe, B. & Al-Aly, Z. Long-term cardiovascular outcomes of COVID-19. Nat. Med.28, 583–590 (2022). - PMC - PubMed

Publication types

MeSH terms

Associated data