. 2024 Dec 30;15(1):10736.
doi: 10.1038/s41467-024-55038-8.

Integrated multi-omics profiling reveals neutrophil extracellular traps potentiate Aortic dissection progression

Affiliations

Integrated multi-omics profiling reveals neutrophil extracellular traps potentiate Aortic dissection progression

Yu-Fei Zhao et al. Nat Commun. .

Abstract

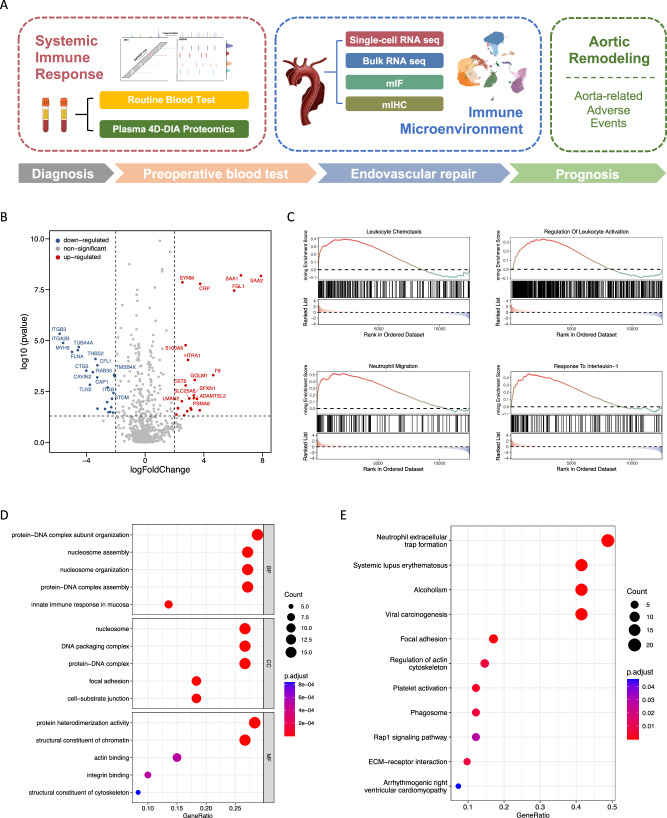
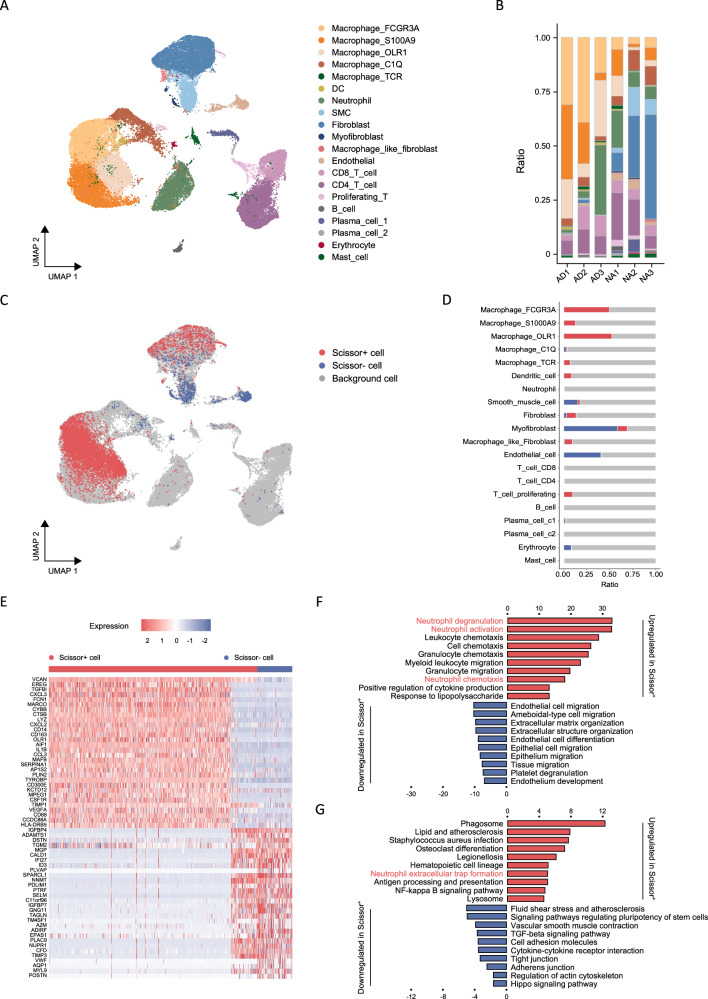
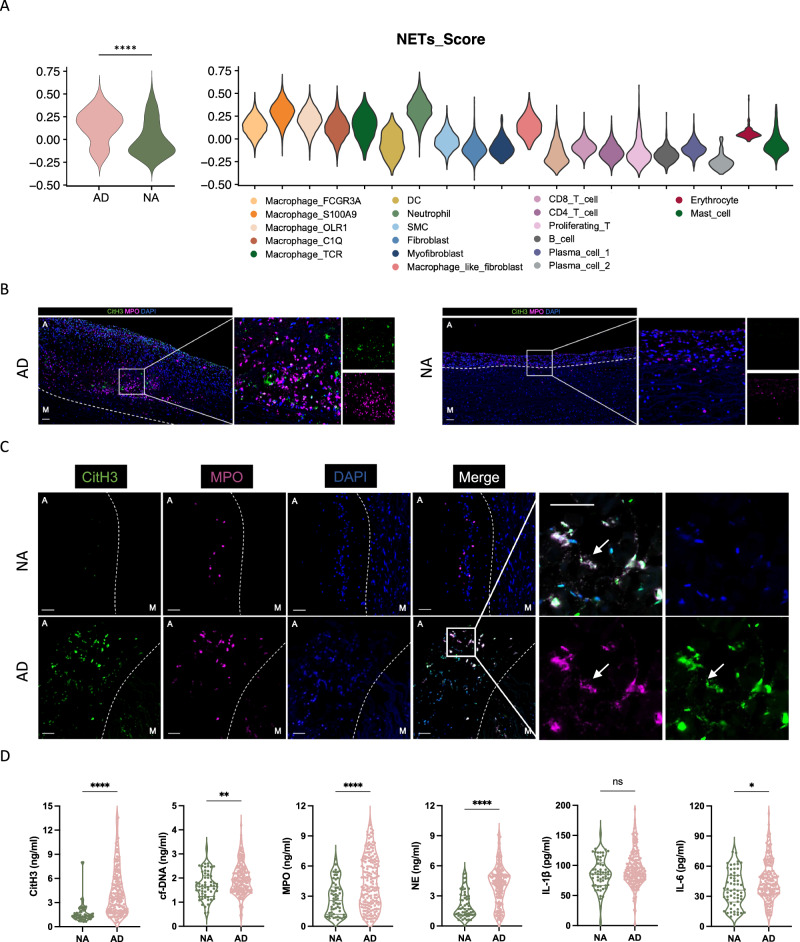
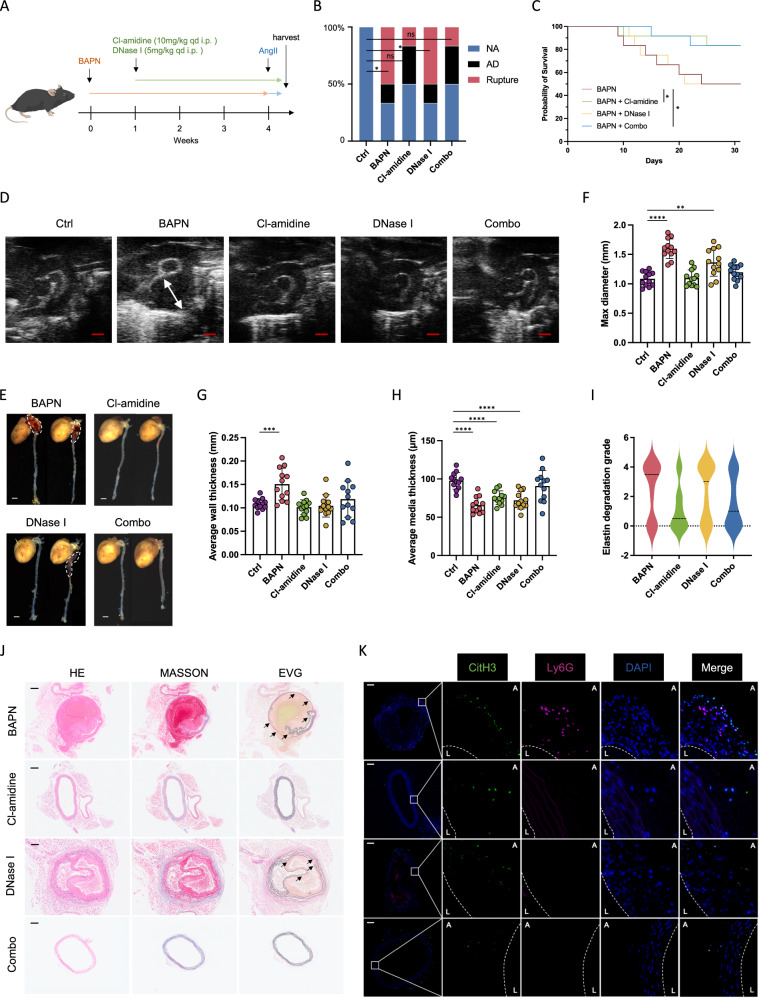
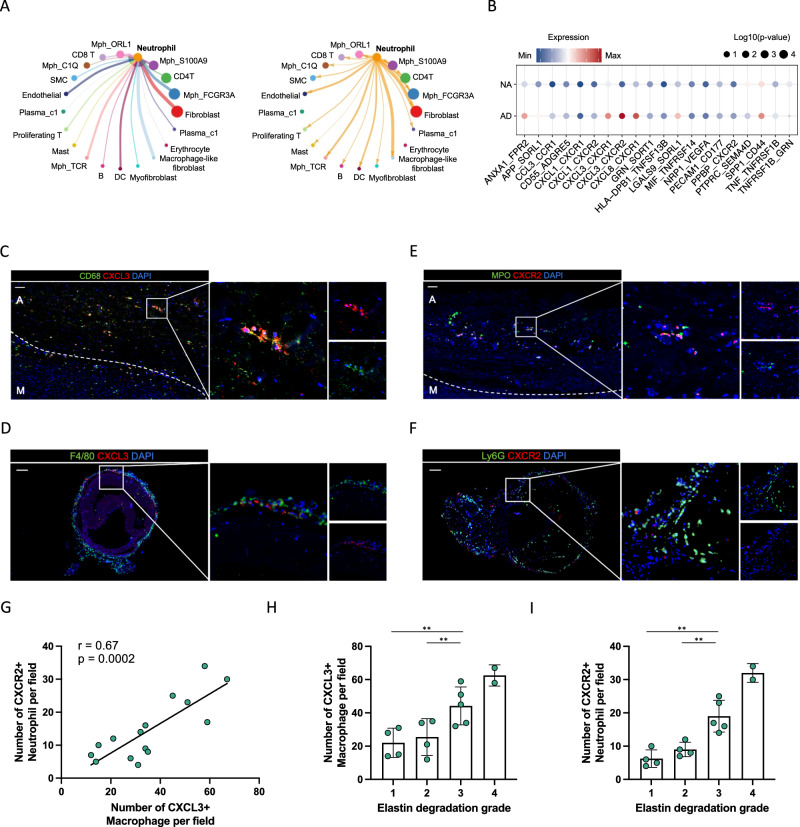
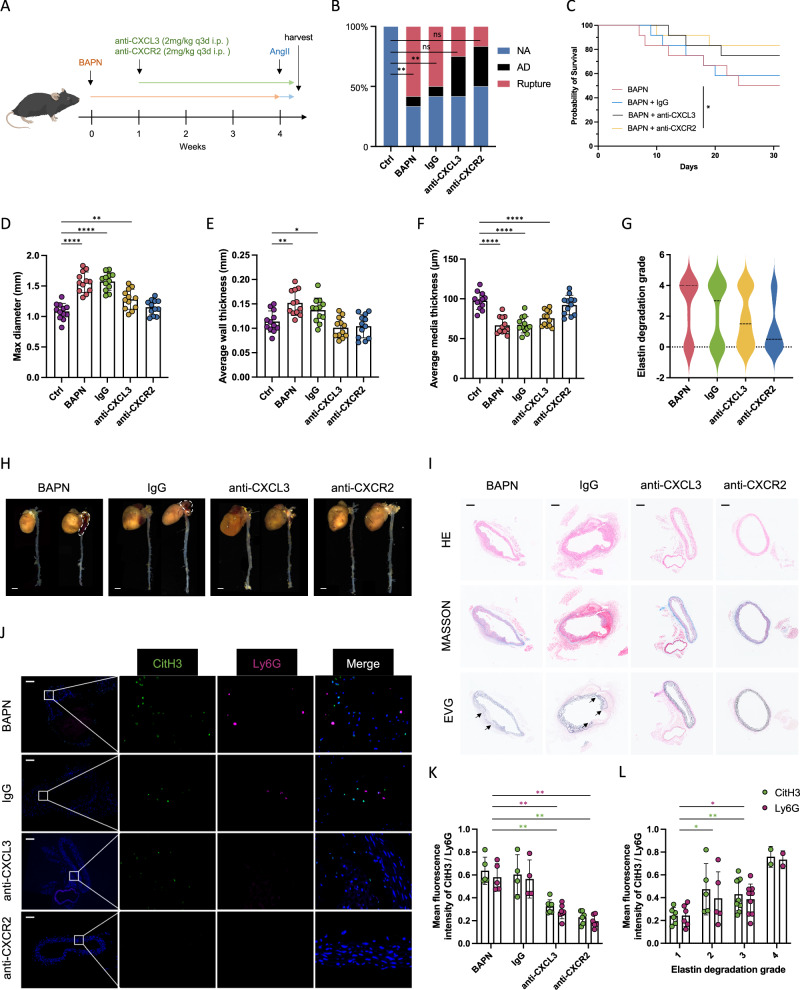
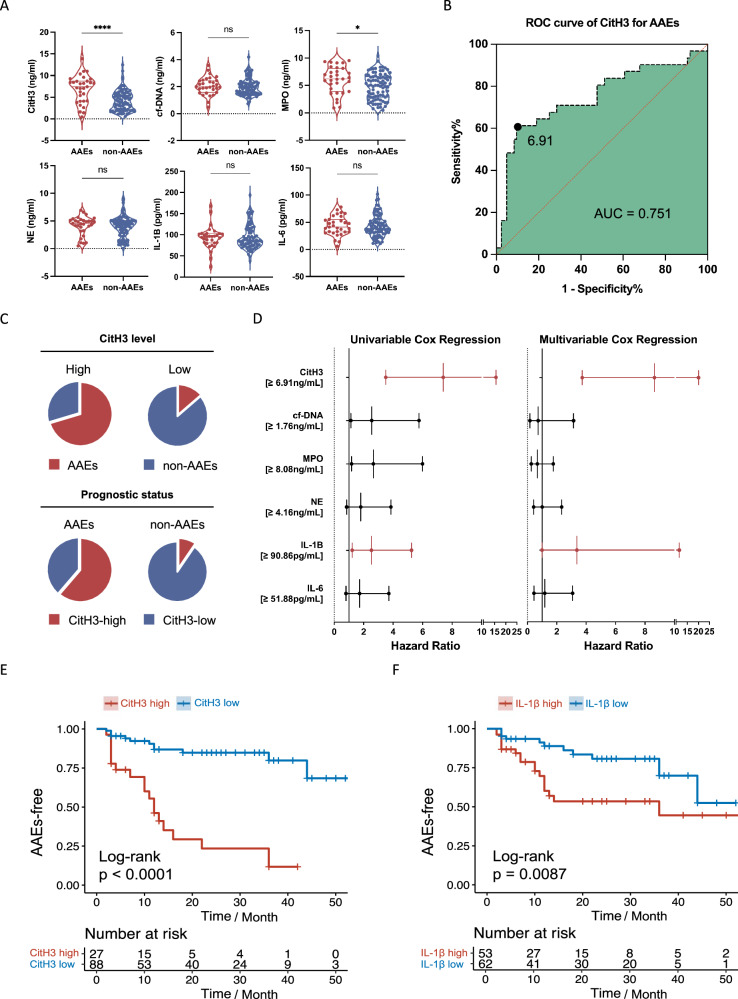
Adverse aortic remodeling increases the risk of aorta-related adverse events (AAEs) after thoracic endovascular aortic repair (TEVAR) and affects the overall prognosis of aortic dissection (AD). It is imperative to delve into the exploration of prognostic indicators to streamline the identification of individuals at elevated risk for postoperative AAEs, and therapeutic targets to optimize the efficacy of TEVAR for patients with AD. Here, we perform proteomic and single-cell transcriptomic analyses of peripheral blood and aortic lesions, respectively, from patients with AD and healthy subjects. The integrated multi-omics profiling identifies that highly phenotype-associated macrophages orchestrate neutrophil extracellular traps (NETs) through CXCL3/CXCR2 axis, thereby promoting the development of AD. Increased NETs formation is a defining feature of systemic immunity and aortic microenvironment of AD. Inhibiting NETs formation through the blockade of citrullinated histone H3 or CXCL3/CXCR2 axis ameliorates the progression and rupture of aortic dissection in male mice. The plasma level of citrullinated histone H3 predicts AAEs following endovascular therapy, facilitating the risk stratification and prognostic evaluation for patients with AD.


Conflict of interest statement

Competing interests: The authors declare no competing interests.

Figures

Fig. 1
Fig. 1. AD is marked by systemic inflammation and neutrophil activation in peripheral blood.
A Flow chart of sample collection and study design. B Volcano plot depicting the differentially expressed proteins between patients with AD (n = 30) and matched healthy counterparts (n = 30). C Gene set enrichment analysis illustrating the hallmark pathways enriched in the patients with AD, including leukocyte activation and chemotaxis, neutrophil migration, and inflammatory process. D GO enrichment analysis showing enrichment of protein-DNA subunit organization and complex assembly, nucleosome organization and assembly in peripheral blood from patients with AD. E KEGG analysis showcasing enrichment pathways related to neutrophil extracellular traps (NETs) formation, platelet activation and actin regulation in peripheral blood from patients with AD. A two-sided statistical significance was set at adjusted p < 0.05. AD: aortic dissection; GO: Gene ontology; KEGG: Kyoto encyclopedia of genes and genomes.
Fig. 2
Fig. 2. A phenotype-associated macrophage subset orchestrates neutrophil within aortic microenvironment.
A UMAP representation of aligned gene expression data in single cells extracted from healthy aortas (n = 28,428) and dissected aortas (n = 18,875) showing partition into 20 distinct clusters. B Histogram indicating the proportion of cells in aortic tissue of each analyzed patient with AD (n = 3) and healthy individual (n = 3). C UMAP visualization of the Scissor-selected cells across cell populations. D Histogram indicating the proportion of Scissor-selected cells in aortic tissue of each analyzed patient with AD and healthy individual. E A heatmap plot of differential gene expressions in Scissor+ cells versus Scissor cells. F A bar plot of the GO enrichment of biological processes showing the significantly enriched pathways in Scissor+ cells. G A bar plot of the KEGG enrichment showing the significantly enriched pathways in Scissor+ cells. AD: aortic dissection; SMC: smooth muscle cell; DC: dendric cell; FCGR3A: Fc fragment of IgG receptor 3a; S100A9: S100 calcium binding protein A9; OLR1: oxidized low density lipoprotein receptor 1; UMAP: uniform manifold approximation and projection.
Fig. 3
Fig. 3. Elevated NETosis occurs in aortic lesions and peripheral blood from patients with AD.
A Single-cell sequencing data of NETs-associated gene module score of dissected aortas (left) and NETs-associated gene module score of each cell cluster (right). B Representative immunofluorescence images of NETs identified by co-localization of MPO (red) and CitH3 (green). Scale bars = 1 mm. C Zoom-in immunofluorescence images of NETs determined by co-staining of MPO (red) and CitH3 (green). Scale bars = 100 μm. M indicated media, A indicated adventitia, and the white dotted line indicated the boundary between media and adventitia. D NETs associated markers as detected by ELISA in the plasma from patients with AD (n = 187) and healthy individuals (n = 59) (p < 0.001; p = 0.0069; p < 0.001; p < 0.001; p = 0.2177; p = 0.0140, respectively). Source data are provided as a Source Data file. Values are expressed as means ± SD. A two-sided statistical significance was set at *p < 0.05, **p < 0.01, ***p < 0.001, ****p < 0.0001 by Mann–Whitney U test. NETs: neutrophil extracellular traps; CitH3: citrullinated histone H3; cf-DNA: cell-free DNA; MPO: myeloperoxidase; NE: neutrophil elastase; IL-1β: interleukin-1β; IL-6: interleukin-6.
Fig. 4
Fig. 4. Inhibition of NETosis attenuates dissection progression in mice with AD.
A Schematic overview of experimental design. Each mouse received intraperitoneal injection of saline, Cl-amidine (10 mg/kg), DNase I (5 mg/kg) or both drugs at a fixed time once a day during 4–7 weeks of age until death or the end point of the experiment. B The incidence of AD and aortic rupture in each group (n = 12). Comparisons by Fisher’s exact test indicating aortic rupture rate difference among groups (p = 0.0137; p = 0.4783; p = 0.0137; p = 0.4783). C Mice death due to aortic rupture of each indicated group (n = 12) (p = 0.0378 for Cl-amidine vs BAPN; p = 0.0424 for Combo vs BAPN). D Representative vascular ultrasound images of aorta in each group (n = 12). Scale bar = 1 mm. E Representative macrographs of aortas in each group. Scale bar = 20 mm. F The average of max diameter (F) (p = 0.0018 for DNase I vs Ctrl), aortic wall thickness of aortas (G) (p < 0.0006 for BAPN vs Ctrl), and media thickness (H) in each group (n = 12). I Elastin degradation grading evaluation of aorta in each group (n = 12) (p = 0.0337 for Cl-amidine vs BAPN; p = 0.0436 for Combo vs BAPN). J Representative immunohistochemistry images showing aortic dilation, false lumen formation, and elastin degradation within aortas in each group. Arrow indicating broken elastin. (K) Representative immunofluorescence images showing NETs formation within aortas of mice, determined by CitH3 (citrullinated histone H3, green) and neutrophil (Ly6G, red) staining. Scale bar = 100 μm. Values are expressed as means ± SD. A two-sided statistical significance was set at *p < 0.05, **p < 0.01, ***p < 0.001, ****p < 0.0001 by Mann–Whitney U test or Fisher’s exact test. Log-rank test was used for the analysis of survival rate.
Fig. 5
Fig. 5. CXCL3+ macrophages were positively correlated with CXCR2+ neutrophils within AD lesion.
A Interaction network of main cell types in AD constructed with CellChat. B The ligand-receptor interactions between macrophages and neutrophils in AD compared to those in NA. C, D Representative images of the presence of CXCL3+ macrophages within human (C) and mice (D) dissected aorta. Scale bars = 100 μm. E, F Representative images of the presence of CXCR2+ neutrophils within human (E) and mice (F) dissected aorta. Scale bars = 100 μm. G Pearson correlation analysis showing positive linear correlation between the number of CXCL3+ macrophages and the number of CXCR2+ neutrophils within human aortic lesion (n = 5, three fields per sample). H, I Bar plot showing the positive correlation between elastin degradation grading and CXCL3+ macrophages (H) and CXCR2+ neutrophils (I) (n = 5, three fields per sample). Values are expressed as means ± SD. A two-sided statistical significance was set at *p < 0.05, **p < 0.01, ***p < 0.001, ****p < 0.0001 by Mann–Whitney U test.
Fig. 6
Fig. 6. Macrophage fosters NETs formation via CXCL3/CXCR2 axis.
A Schematic overview of experimental design. Mice received intraperitoneal injection of IgG anti-body, anti-CXCL3 anti-body (2 mg/kg), and anti-CXCR2 anti-body (2 mg/kg) at a fixed time once a day until death or the end point of the experiment. B The incidence of AD and aortic rupture in each group (n = 12). Comparisons by Fisher’s exact test indicating aortic rupture rate difference among groups (p = 0.0045; p = 0.0137; p = 0.2174; p = 0.4783). C Mice death due to aortic rupture of each indicated group (p = 0.0408 for anti-CXCR2 vs BAPN). DF The average of max diameter (D) (p = 0.0065 for anti-CXCL3 vs Ctrl), aortic wall thickness (E) (p = 0.0012 for BAPN vs Ctrl; p = 0.0284 for IgG vs Ctrl), and aortic media thickness (F) in each group. G Elastin degradation grading evaluation of each aorta (p = 0.0423 for anti-CXCL3 vs BAPN; p = 0.0318 for anti-CXCR2 vs BAPN). H Representative macrographs of aortas in each group. Scale bar = 20 mm. I Representative immunohistochemistry images showing aortic dilation, false lumen formation, and elastin degradation within aortas in each group. Scale bar = 100 μm. J Representative immunofluorescence images showing NETs formation within aortas of mice. Scale bar = 100 μm. K Immunofluorescence quantification of NETs markers among each group (CitH3: p = 0.0025 for anti-CXCL3 vs BAPN; p = 0.0044 for anti-CXCR2 vs BAPN; Ly6G: p = 0.0025 for anti-CXCL3 vs BAPN; p = 0.0043 for anti-CXCR2 vs BAPN). L Immunofluorescence quantification of NETs markers within aortas with four elastin degradation grades (CitH3: p = 0.0489 for grade 2 vs grade 1; p = 0.0012 for grade 3 vs grade 1; p = 0.0473 for grade 4 vs grade 1; Ly6G: p = 0.0537 for grade 2 vs grade 1; p = 0.0425 for grade 3 vs grade 1; p = 0.0414 for grade 4 vs grade 1). Values are expressed as means ± SD. A two-sided statistical significance was set at *p < 0.05, **p < 0.01, ***p < 0.001, ****p < 0.0001 by Mann–Whitney U test.
Fig. 7
Fig. 7. NETs-associated markers serve as prognostic risk factors.
A The levels of NETs-associated markers in plasma of patients with (n = 31) or without AAEs (n = 85) after endovascular treatment (p < 0.001; p = 0.3505; p = 0.0207; p = 0.5449; p = 0.5294, p = 0.6997, respectively). B ROC curve analysis showing that at the cut-off level defined as 6.91 ng/ml CitH3, the sensitivity and specificity for predicting AAEs are 0.6 and 0.9, respectively, with the area under the curve of 0.75. C Pie chart displaying the frequencies for combinations of levels of CitH3 (split into categorical variable) and prognostic status (whether patients developed AAEs). D The univariable and multivariable Cox regression models showing that CitH3 and IL-1β were independent risk factors for AAEs of patients with AD. The upper- and lower-line segment indicating the 95% confidence interval. (E) Kaplan-Meier curves of patients with high levels of CitH3 (≥6.91 ng/ml) and the incidence of AAEs compared to patients with low levels of CitH3 (<6.91 ng/ml). Below the survival curves showing the number of exposed subjects at each time point. F Kaplan–Meier curves of patients with high IL-1β (≥90.86 pg/ml) and the incidence of AAEs compared to patients with low IL-1β (<90.86 pg/ml). Below the survival curves showing the number of exposed subjects at each time point. Values are expressed as means ± SD. Source data are provided as a Source Data file. A two-sided statistical significance was set at *p < 0.05, **p < 0.01, ***p < 0.001, ****p < 0.0001 by Mann–Whitney U test. ROC: receiver operating characteristic.

References

    1. Erbel, R. et al. 2014 ESC Guidelines on the diagnosis and treatment of aortic diseases: Document covering acute and chronic aortic diseases of the thoracic and abdominal aorta of the adult. The Task Force for the Diagnosis and Treatment of Aortic Diseases of the European Society of Cardiology (ESC). Eur. Heart J.35, 2873–2926 (2014). - PubMed
    1. Rylski, B., Schilling, O. & Czerny, M. Acute aortic dissection: evidence, uncertainties, and future therapies. Eur. Heart J.44, 813–821 (2023). - PubMed
    1. Afifi, R. O. et al. Outcomes of patients with acute type B (DeBakey III) Aortic dissection: a 13-year, single-center experience. Circulation132, 748–754 (2015). - PMC - PubMed
    1. Garbade, J. et al. Outcome of patients suffering from acute type B aortic dissection: a retrospective single-centre analysis of 135 consecutive patients. Eur. J. Cardiothorac. Surg.38, 285–292 (2010). - PubMed
    1. Ogami, T. et al. Long-term outcomes after recurrent acute thoracic aortic dissection: Insights from the International Registry of Aortic Dissection. J. Thorac. Cardiovasc. Surg.24, 283–286 (2024). - PubMed

Publication types

MeSH terms

Associated data