. 2024 Dec 30;15(1):10771.
doi: 10.1038/s41467-024-54964-x.

Genomic analysis of global Plasmodium vivax populations reveals insights into the evolution of drug resistance

Affiliations

Genomic analysis of global Plasmodium vivax populations reveals insights into the evolution of drug resistance

Gabrielle C Ngwana-Joseph et al. Nat Commun. .

Abstract

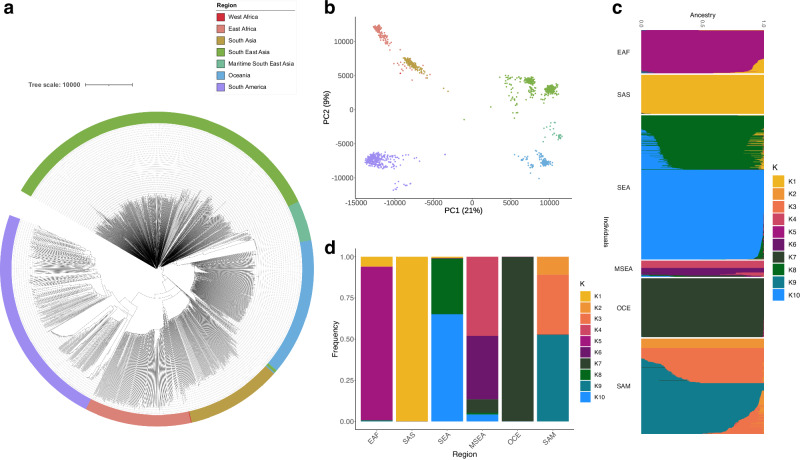
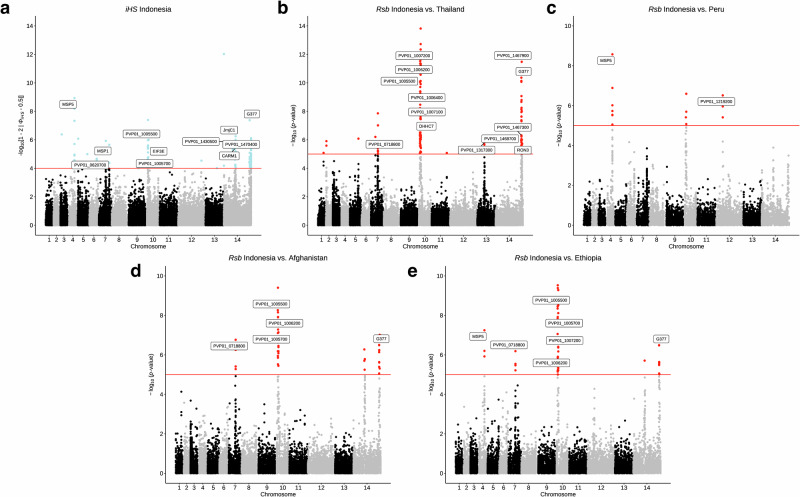
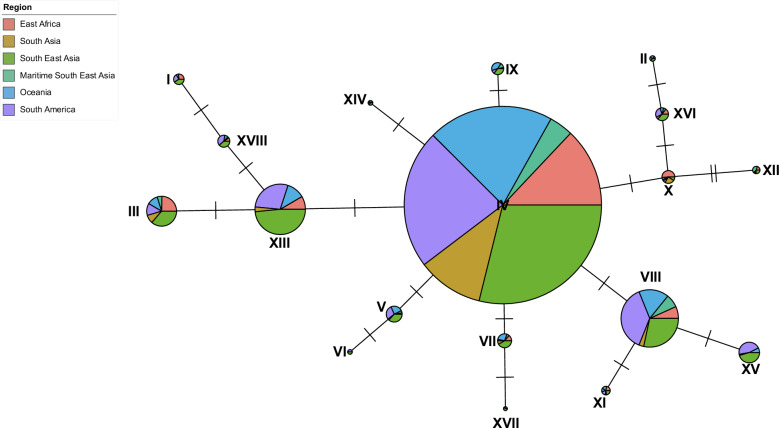
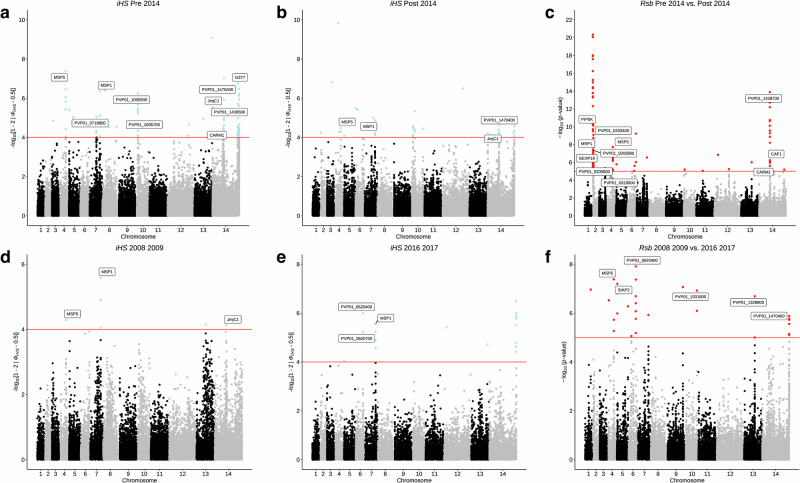
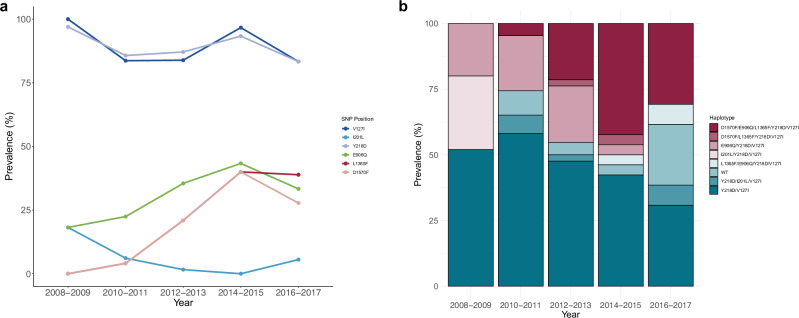
Increasing reports of chloroquine resistance (CQR) in Plasmodium vivax endemic regions have led to several countries, including Indonesia, to adopt dihydroarteminsin-piperaquine instead. However, the molecular drivers of CQR remain unclear. Using a genome-wide approach, we perform a genomic analysis of 1534 P. vivax isolates across 29 endemic countries, detailing population structure, patterns of relatedness, selection, and resistance profiling, providing insights into potential drivers of CQR. Selective sweeps in a locus proximal to pvmdr1, a putative marker for CQR, along with transcriptional regulation genes, distinguish isolates from Indonesia from those in regions where chloroquine remains highly effective. In 106 isolates from Indonesian Papua, the epicentre of CQR, we observe an increasing prevalence of novel SNPs in the candidate resistance gene pvmrp1 since the introduction of dihydroartemisinin-piperaquine. Overall, we provide novel markers for resistance surveillance, supported by evidence of regions under recent directional selection and temporal analysis in this continually evolving parasite.


Conflict of interest statement

Competing interests: The authors declare no competing interests.

Figures

Fig. 1
Fig. 1. Population structure and ancestry in 1534 global P. vivax isolates.
P. vivax isolates form distinct populations to sub-continental level. a Neighbour-Joining tree for 1534 isolates, constructed using a distance matrix based on 499,206 high-quality bi-allelic SNPs, and coloured based on sub-regional grouping. b Principal Component Analysis (PCA) plot of the 1534 isolates, with colours based on sub-regional groupings in (a). c ADMIXTURE inference of 10 ancestral populations (K = 10) in the global dataset, visualised by bar plot, coloured by K population grouping, and summarised as frequencies in (d). EAF East Africa, MSEA Maritime South-East Asia, OCE Oceania, SAM South America, SAS South Asia, SEA South-East Asia.
Fig. 2
Fig. 2. Evidence of selective sweeps on chromosome 10 at downstream pvmdr1 locus.
Selection at this locus is driving differentiation of Indonesian Papua isolates from P. vivax isolates across South-East Asia, South Asia, South America, and East Africa. Manhattan plots showing integrated haplotype homozygosity scores (iHS) for SNPs in a Indonesian isolates (N = 106) and the cross-population test, Rsb, showing SNPs under differential selection between Indonesian and b Thai (N = 119), c Peruvian (N = 82) d Afghan (N = 50) and e Ethiopian (N = 102) isolates. Loci in critical regions, defined here as SNPs with an iHS score of P < 1 × 10−4 or Rsb score of P < 1 × 10−5 (two-sided tests), are highlighted in blue (iHS) and red (Rsb).
Fig. 3
Fig. 3. Median joining haplotype network constructed using pvmdr1 gene sequences from 1238 global isolates.
Each node represents a unique haplotype. Segments within nodes represent isolates from the 6 different subregional groupings and coloured accordingly. Node size is in proportion to the number of samples represented by that haplotype. The number of ticks between nodes represents the number of SNP differences between the two haplotypes.
Fig. 4
Fig. 4. Recent directional selection in Indonesian Papua (N = 104) isolates.
Manhattan plots showing integrated haplotype homozygosity scores (iHS) for SNPs in a pre-2014 isolates (N = 75), b post-2014 isolates (N = 29), d 2008–2009 isolates (N = 18), e 2016–2017 isolates (N = 10), and the cross-population test, Rsb, showing SNPs under differential selection between c pre-2014 vs. post-2014 isolates and f 2008–2009 vs. 2016–2017 isolates. Loci in critical regions, defined here as SNPs with an iHS score of P < 1 × 10−4 or Rsb score of P < 1 × 10−5 (two-sided tests), are highlighted in blue (iHS) and red (Rsb).
Fig. 5
Fig. 5. Temporal trends in pvmrp1 haplotypes in Indonesian Papua (N = 104) isolates.
a Change in frequency of non-synonymous mutations in pvmrp1 across five time periods (2008–2009, 2010–2011, 2012–2013, and 2016–2017). b Proportion of major pvmrp1 haplotypes from the same time periods.

References

    1. World Health Organisation. World Malaria Report 2023.
    1. Bermúdez, M., Moreno-Pérez, D. A., Arévalo-Pinzón, G., Curtidor, H. & Patarroyo, M. A. Plasmodium vivax in vitro continuous culture: the spoke in the wheel. Malar. J.17, 301 (2018). - PMC - PubMed
    1. Chu, C. S. & White, N. J. Management of relapsing Plasmodium vivax malaria. Expert Rev. Anti Infect. Ther.14, 885–900 (2016). - PMC - PubMed
    1. Price, R. N., Commons, R. J., Battle, K. E., Thriemer, K. & Mendis, K. Plasmodium vivax in the Era of the Shrinking P. falciparum Map. Trends Parasitol.36, 560–570 (2020). - PMC - PubMed
    1. Price, R. N. et al. Global extent of chloroquine-resistant Plasmodium vivax: a systematic review and meta-analysis. Lancet Infect. Dis.14, 982–991 (2014). - PMC - PubMed

Publication types

MeSH terms

LinkOut - more resources