. 2024 Dec 30;15(1):10854.
doi: 10.1038/s41467-024-55195-w.

MaizeCODE reveals bi-directionally expressed enhancers that harbor molecular signatures of maize domestication

Affiliations

MaizeCODE reveals bi-directionally expressed enhancers that harbor molecular signatures of maize domestication

Jonathan Cahn et al. Nat Commun. .

Erratum in

Abstract

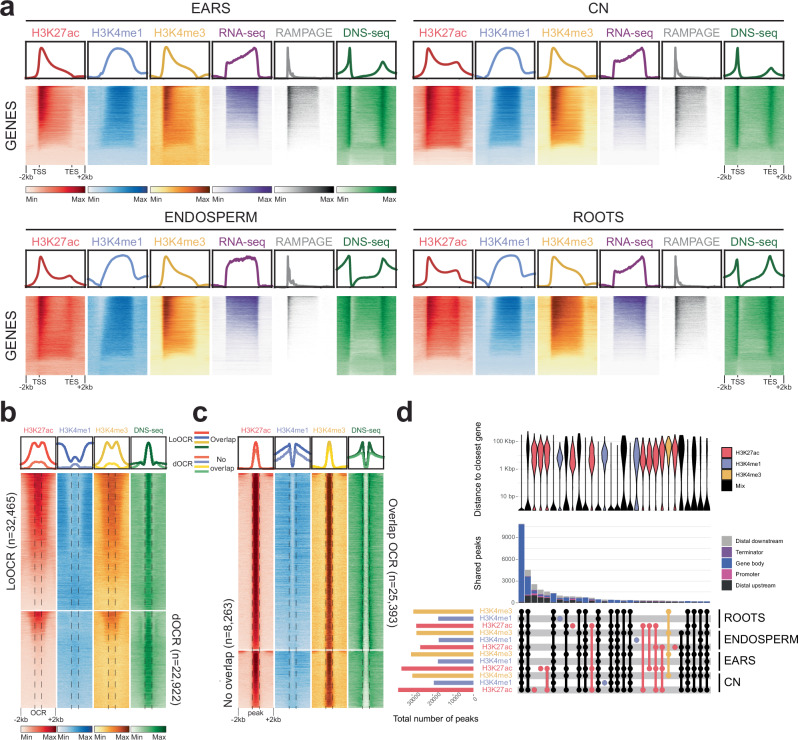
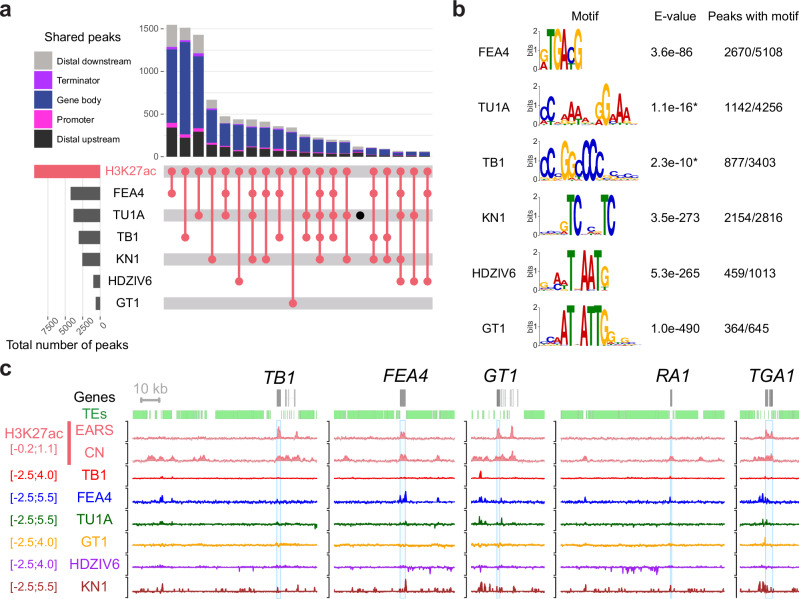
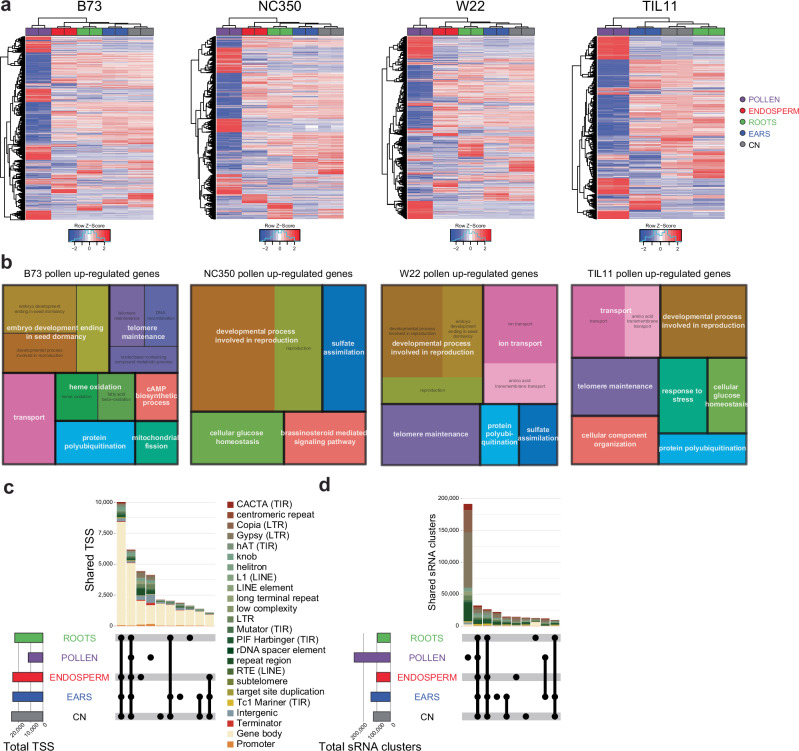
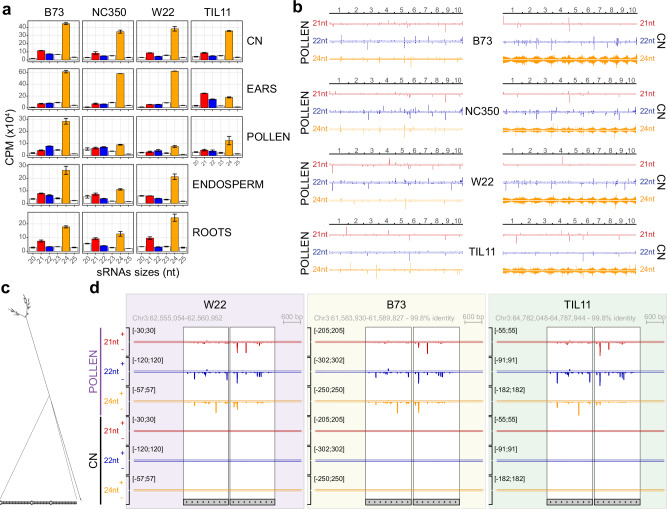
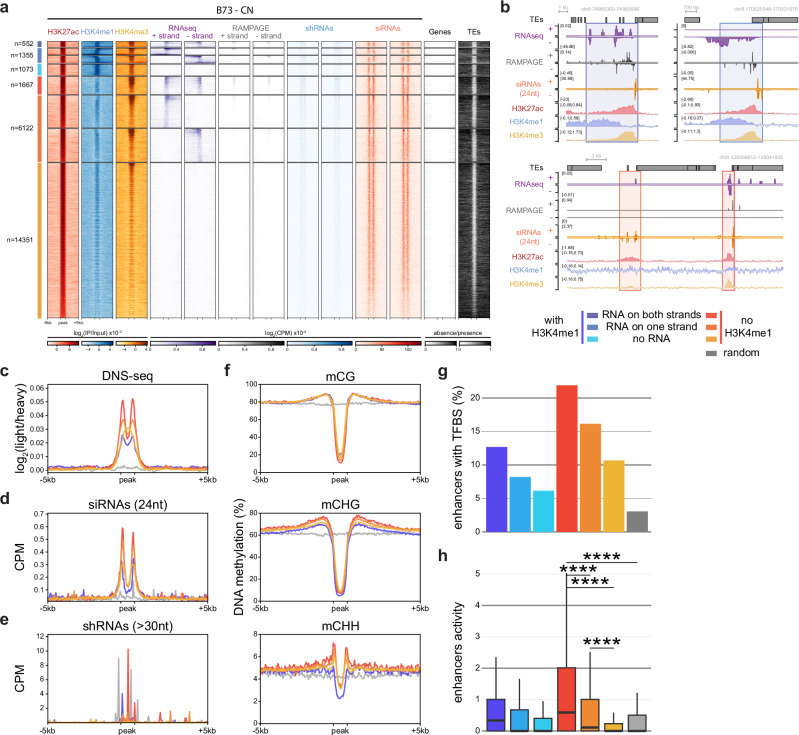
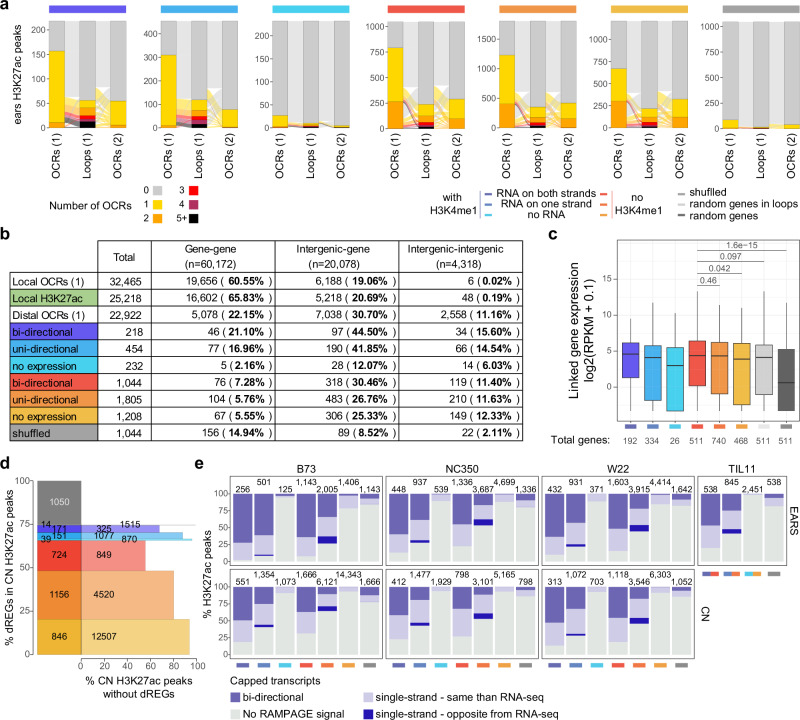
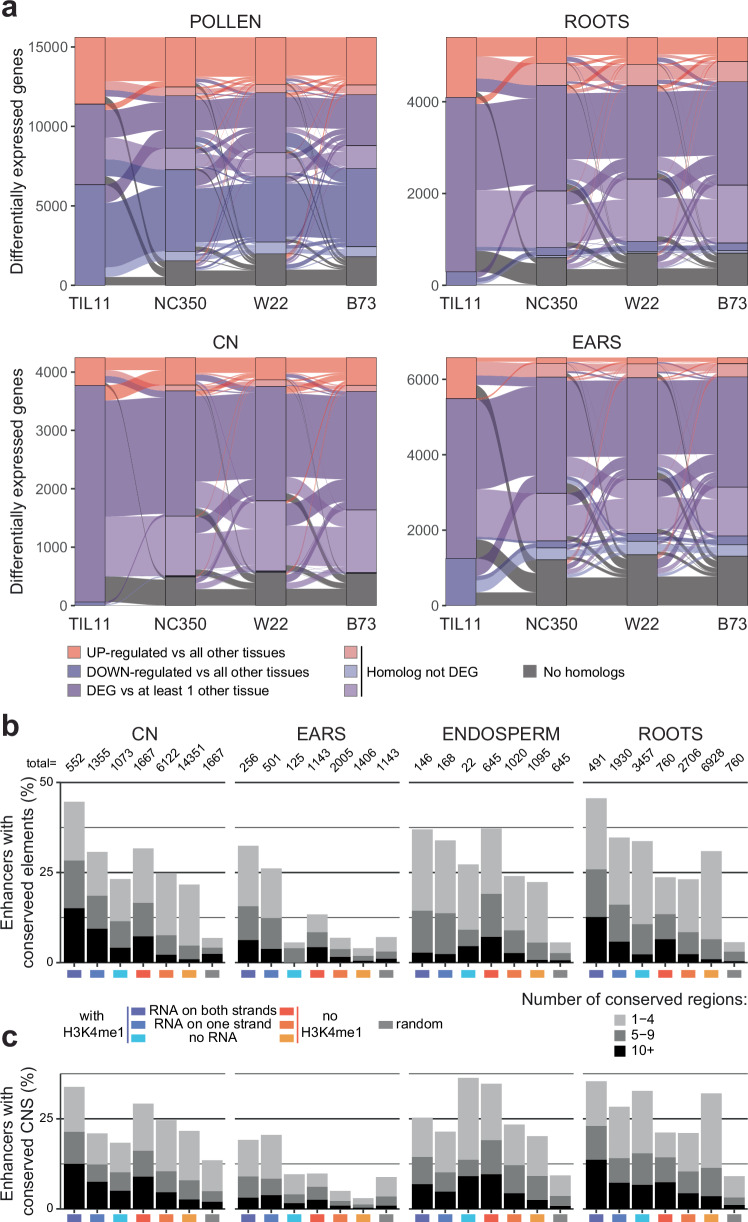
Modern maize (Zea mays ssp. mays) was domesticated from Teosinte parviglumis (Zea mays ssp. parviglumis), with subsequent introgressions from Teosinte mexicana (Zea mays ssp. mexicana), yielding increased kernel row number, loss of the hard fruit case and dissociation from the cob upon maturity, as well as fewer tillers. Molecular approaches have identified transcription factors controlling these traits, yet revealed that a complex regulatory network is at play. MaizeCODE deploys ENCODE strategies to catalog regulatory regions in the maize genome, generating histone modification and transcription factor ChIP-seq in parallel with transcriptomics datasets in 5 tissues of 3 inbred lines which span the phenotypic diversity of maize, as well as the teosinte inbred TIL11. Transcriptomic analysis reveals that pollen grains share features with endosperm, and express dozens of "proto-miRNAs" potential vestiges of gene drive and hybrid incompatibility. Integrated analysis with chromatin modifications results in the identification of a comprehensive set of regulatory regions in each tissue of each inbred, and notably of distal enhancers expressing non-coding enhancer RNAs bi-directionally, reminiscent of "super enhancers" in animal genomes. Furthermore, the morphological traits selected during domestication are recapitulated, both in gene expression and within regulatory regions containing enhancer RNAs, while highlighting the conflict between enhancer activity and silencing of the neighboring transposable elements.


Conflict of interest statement

Competing interests: The authors declare no competing interests.

Figures

Fig. 1
Fig. 1. Histone H3 modifications mark DNA regulatory elements in maize inbred lines.
a Heatmaps and metaplots of H3K27ac, H3K4me1, H3K4me3, RNA-seq, RAMPAGE and differential nucleosome sensitivity (DNS-seq) over all annotated genes in each tissue of B73 (NAM reference genome), scaled to the same size, with 2 kb upstream and downstream. CN = coleoptilar node. b Heatmaps and metaplots of B73 ears H3K27ac, H3K4me1, H3K4me3 and DNS-seq in local and distal open chromatin regions (LoOCR and dOCR, respectively) previously identified by ATAC-seq. Bona fide regulatory elements are enriched for H3K27Ac and H3K4me3 but not H3K4me1. c Heatmaps and metaplots of H3K27ac, H3K4me1, H3K4me3 and DNS-seq at all H3K27ac peaks (regulatory elements) in B73 ears. 25,393 peaks intersect previously identified OCRs (20,334 LoOCRs and 5059 dOCRs) but 8263 peaks do not overlap. d Summary of shared ChIP-seq peaks in W22 (v2 reference genome). The Upset plot (lower panel) displays the overlap between H3K27ac, H3K4me1 and H3K4me3 peaks in the four tissues. The total number of peaks in each sample is shown on the histogram on the left-hand side of the intersection matrix, while the number of shared peaks between samples is shown above (middle panel), color coded by genomic feature. The violin plot (upper panel) compares the distance between peaks and the closest gene. Tissue specific peaks are mostly at distal elements, whereas loci with several histone marks in multiple tissues are mostly at annotated genes. Distal regulatory elements lie between 2 kb and 100 kb from the nearest gene.
Fig. 2
Fig. 2. Enhancers at domestication genes are bound by transcription factor networks.
a Upset plot showing the overlap between H3K27ac peaks identified in B73 and binding sites of six transcription factors (TFBS) analyzed in this study. The total number of peaks called for each sample is shown on the histogram on the left-hand side. The number of shared peaks between the different samples are shown above the intersection matrix, each peak being colored by the genomic feature it intersects with. The majority of the TFBS are indeed within H3K27ac peaks, mostly overlapping gene bodies or at distal regions (>2 kb from a gene) and highlights the interplay between these TFs. b Best binding motif identified in each TF peaks with meme or streme (*). The motifs correspond to the respective family of each TF. c Browser screenshots at major domestication loci (TB1, GT1, RA1 and TGA1) as well as FEA4, which regulates a domestication trait, showing complex regulation of these developmental TFs with often co-regulation and auto-regulation.
Fig. 3
Fig. 3. Pollen has a unique transcriptional profile compared to other tissues.
a Heatmap of all differentially expressed genes (DEGs) in each inbred and their expression level in each tissue (normalized z-score). b Gene ontology (GO) terms enriched in genes up-regulated in pollen versus all other tissues for each inbred. NC350 is missing DEGs involved in telomere maintenance. This difference is shared with endosperm (Supplementary Fig. 2) c Upset plot of transcription start sites (TSS) identified by RAMPAGE in B73. The total number of TSS in each tissue is shown on the histogram on the left-hand side. The number of shared TSS between the different tissues are shown above the intersection matrix, color coded by genomic feature (including transposable element families). d Upset plot of the sRNA clusters identified in shRNA-seq in B73. The total number of clusters in each tissue is shown on the histogram on the left-hand side. The number of shared sRNA clusters between the different tissues are shown above the intersection matrix, color coded by genomic feature (including transposable element families).
Fig. 4
Fig. 4. Small RNA size distributions differ among tissues and inbreds.
a Size distributions of sRNAs were calculated in each tissue of each inbred line (CPM, count per million mapped reads). Maize and teosinte inbreds have similar size distributions in coleoptilar nodes (CN), but differ in other tissues. In pollen, more 24nt sRNA (orange) accumulates in B73 relative to other inbreds, while in ears TIL11 has reduced levels of 24nt and increased levels of 21nt sRNAs (red). In root tips and endosperm, NC350 has reduced levels of 24nt siRNAs. Error bars are standard error between two biological replicates. b Whole-genome browsers of 21, 22 and 24nt siRNAs expressed in pollen and coleoptilar node (CN) in each inbred, highlighting the presence of hairpins producing high levels of 22 and 24nt sRNAs in pollen and only 22nt in CN. Each track is scaled to its maximum CPM. At this scale the 21nt sRNAs mostly show expression of the most highly expressed microRNAs. c Secondary structure of a representative pollen-specific hairpin made with RNAfold. 50 bp of the 3 kb stem is shown at the bottom. d Browser screenshots of a representative pollen-specific hairpin (same as in c), present in W22, B73 and TIL11, producing high levels of stranded 22nt sRNAs, as well as 21 and 24nt sRNAs in all pollen inbreds in a very similar pattern. The gray boxes represent the two repeated halves of the hairpin.
Fig. 5
Fig. 5. Enhancers with bi-directional enhancer RNAs are associated with stronger activity and higher RdDM at their boundaries.
a Heatmap of ChIP-seq and transcriptomic signals in B73 coleoptilar node (CN) at distal H3K27ac peaks and ±5kb surrounding regions. Six classes of regulatory regions were identified based on the presence (blue) or the absence (red) of H3K4me1 peaks within 1 kb, and on the presence of RNA-seq reads mapping to both strands, one strand, or none (from darker to lighter shades). The short RNA-seq datasets were split into longer fragments (>30nt) and canonical siRNAs (24 nt). Presence (black) and absence (white) of annotated genes and TEs surrounding the peaks are shown, demonstrating the absence of annotated features within regulatory regions. b Browser screenshots of representative examples of uni- and bi-directionally expressed H3K27ac peaks (boxed), with (upper) and without (lower) H3K4me1 peaks. H3K4me1 peaks indicate the presence of unannotated genes. c–f Metaplots at the three clusters without H3K4me1 peaks (red, as in a), the three clusters with H3K4me1 peaks merged together (blue), and random control regions (gray) of DNA accessibility (c) in differential nucleosome sensitivity (DNS-seq) from CN, 24nt siRNAs (d) and short RNAs (>30nt) (e) generated in CN in this study, as well as DNA methylation in each sequence context (f) from seedlings. These metaplots show that the bi-directional enhancers are more accessible regions with higher transcription levels of shRNAs, depleted of DNA methylation, but also more protected from neighboring TEs by targeting of RNA-directed DNA methylation by 24nt siRNAs. g Percentage of peaks containing at least one transcription factor binding site (TFBS) from the TFs analyzed in this study. h Measure of enhancer activity for each cluster by STARR-seq. Bi-directionally expressed enhancers drive statistically higher transcription (STARR-seq value within the enhancer) than uni-directional, not expressed or control regions (two-sided t test, **** p < 10−5). Data shows distribution of median STARR-seq value at all B73 CN enhancers (numbers shown in a), with the boxplot showing the mean and ranging from first to third quartiles, whiskers mark 1.5×IQR, and outliers are not shown.
Fig. 6
Fig. 6. Enhancer RNA-expressing regions are enriched in chromatin loops.
a Alluvial plots showing the number of open chromatin regions (OCRs) intersecting H3K27ac peaks, split by the presence of H3K4me1 peak within 1 kb, and the presence of RNA within the peaks. H3K27ac peaks identified in B73 immature ears were compared to OCRs from ATAC-seq and to chromatin loops from Hi-C from (1) Sun et al. and to OCRs from (2) Ricci et al. . The highest overlap is between Sun et al. OCRs and enhancers with bi-directional enhancer RNAs (eRNAs). b Table summarizing the number of enhancers found in the chromatin loop anchors identified by Hi-C. H3K27ac peaks within 2 kb of a gene body (local H3K27ac, green) are more often in a loop than local OCRs. Distal H3K27ac peaks are included in intergenic loops to similar levels than OCRs. The presence of H3K4me1 however increases the percentage of these regions to be within loops, which support their classification as misannotated genes. c Expression level in immature ears (log2(RPKM + 0.1)) of the genes linked by chromatin loops to the different types of enhancers described in (a). Genes linked to enhancers with bi-directional eRNAs are more highly expressed than random genes, but marginally more highly expressed than random genes in loops (two-sided t test). d Intersection between elements with bi-directional nascent transcripts identified by discriminative regulatory-element (dREGs) in maize GRO-seq data and H3K27ac peaks in the coleoptilar node (CN). e Percentage of H3K27ac peaks with RAMPAGE signal, in immature ears and CN of each inbred. From 30 to 70% of enhancer RNAs are capped in bi-directional enhancers, while 10 to 30% of enhancers with stranded RNA-seq transcripts also have bi-directional RAMPAGE signal, suggesting an underestimation of the total number of bi-directional enhancers.
Fig. 7
Fig. 7. Domestication had a greater impact on transcription profiles and enhancersin ears.
a Alluvial plot showing the differentially expressed genes (DEGs) in four tissues of TIL11, and whether their homologs in modern maize maintain this differential expression. These plots show high level of transcription profile conservation in pollen, moderate levels in coleoptilar nodes (CN) and root tips, and low levels in immature ears, in addition to more genes not having a homolog (“Methods”). b Percentage of enhancers containing conserved regions in the pan-andropoganeae clade identified by PhastCons (“Methods”). c Percentage of enhancers containing conserved regions identified by Conservatory CNS (“Methods”). In both conservation analyses, misannotated genes show high levels of conservation as do the enhancers, especially the ones with bi-directional enhancer RNAs, in all tissues but in immature ears.

Similar articles

Cited by

References

    1. Matsuoka, Y. et al. A single domestication for maize shown by multilocus microsatellite genotyping. Proc. Natl. Acad. Sci. USA99, 6080–6084 (2002). - PMC - PubMed
    1. Hufford, M. B. et al. Comparative population genomics of maize domestication and improvement. Nat. Genet.44, 808–811 (2012). - PMC - PubMed
    1. Stitzer, M. C. & Ross-Ibarra, J. Maize domestication and gene interaction. N. Phytol.220, 395–408 (2018). - PubMed
    1. Wang, B. et al. Genome-wide selection and genetic improvement during modern maize breeding. Nat. Genet.52, 565–571 (2020). - PubMed
    1. Chen, L. et al. Genome sequencing reveals evidence of adaptive variation in the genus Zea. Nat. Genet.54, 1736–1745 (2022). - PubMed

Publication types

Substances

Associated data