. 2024 Dec 30;15(1):10788.
doi: 10.1038/s41467-024-55084-2.

Alcohol-induced gut microbial reorganization and associated overproduction of phenylacetylglutamine promotes cardiovascular disease

Affiliations

Alcohol-induced gut microbial reorganization and associated overproduction of phenylacetylglutamine promotes cardiovascular disease

Zhen Li et al. Nat Commun. .

Abstract

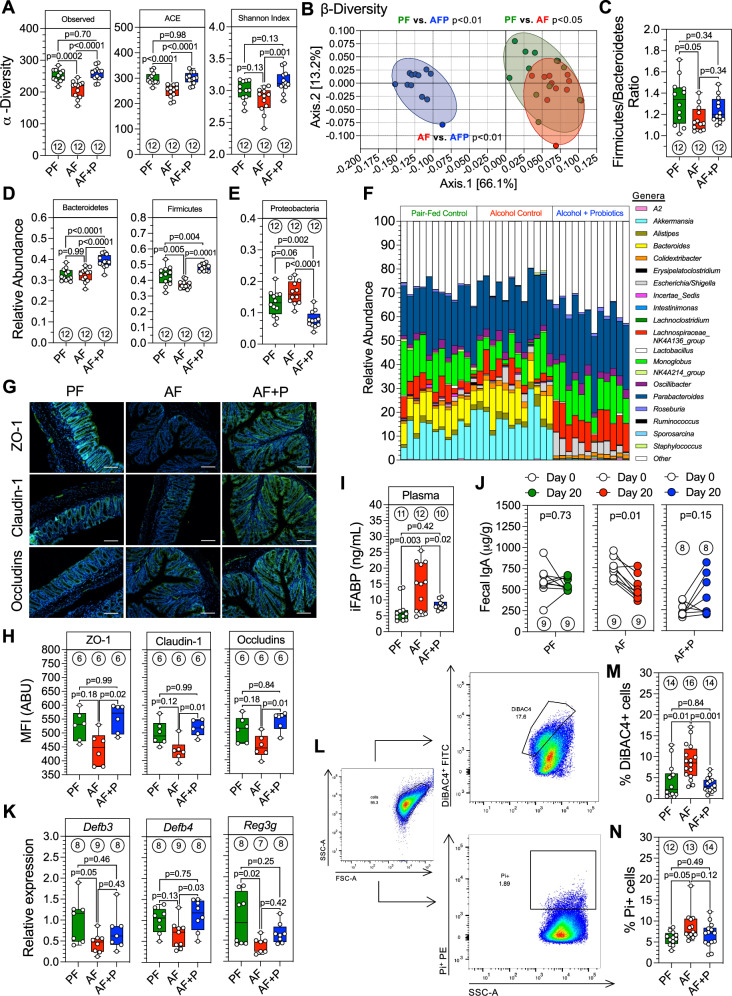
The mechanism(s) underlying gut microbial metabolite (GMM) contribution towards alcohol-mediated cardiovascular disease (CVD) is unknown. Herein we observe elevation in circulating phenylacetylglutamine (PAGln), a known CVD-associated GMM, in individuals living with alcohol use disorder. In a male murine binge-on-chronic alcohol model, we confirm gut microbial reorganization, elevation in PAGln levels, and the presence of cardiovascular pathophysiology. Fecal microbiota transplantation from pair-/alcohol-fed mice into naïve male mice demonstrates the transmissibility of PAGln production and the CVD phenotype. Independent of alcohol exposure, pharmacological-mediated increases in PAGln elicits direct cardiac and vascular dysfunction. PAGln induced hypercontractility and altered calcium cycling in isolated cardiomyocytes providing evidence of improper relaxation which corresponds to elevated filling pressures observed in vivo. Furthermore, PAGln directly induces vascular endothelial cell activation through induction of oxidative stress leading to endothelial cell dysfunction. We thus reveal that the alcohol-induced microbial reorganization and resultant GMM elevation, specifically PAGln, directly contributes to CVD.


Conflict of interest statement

Competing interests: Z.W. reports being named as co-inventor on pending and issued patents held by the Cleveland Clinic relating to cardiovascular diagnostics and therapeutics. Z.W. also reports having received royalty payments for inventions or discoveries related to cardiovascular diagnostics or therapeutics from Cleveland Heart Lab, a fully owned subsidiary of Quest Diagnostics and Procter & Gamble. C.M.T. consults for Abbott Laboratories. S.L.H. reports being named as co-inventor on pending and issued patents held by the Cleveland Clinic relating to cardiovascular diagnostics and therapeutics, being a paid consultant for Procter & Gamble and Zehna Therapeutics, having received research funds from Procter & Gamble, Zehna Therapeutics, and Roche Diagnostics, and being eligible to receive royalty payments for inventions or discoveries related to cardiovascular diagnostics or therapeutics from Cleveland HeartLab and Procter & Gamble. All other authors: Z.L., M.G., A.Z., X.F., K.M., M.M., X.S.L., Z.Y., J.M., T.T., K.C., M.H., L.H., K.G., T.T.V., D.W., A.M.G., P.Q., C.A.M., J.M.B., D.J.L., D.A.W., and T.E.S. have no competing interests.

Figures

Fig. 1
Fig. 1. PAGln levels in patients with alcohol use disorder.
A Healthy controls (HC, green) and heavy drinkers (HD, red) serum levels of phenylacetylglutamine (PAGln). B Association between PAGln levels and self-reported AUDIT-C scores upon admission. Linear regression analysis was performed demonstrating the line of best-fit with the 95% confidence interval. C, D Serum PAGln levels in male (blue) and female (pink) HC (green) and HD, respectively. All data (A, C and D) are presented as box and whisker plots (mean, max, and min.) with individual measurement dot plots unless otherwise stated. Number of patients enrolled in each measurement is found in open circle. Significance (p < 0.05) was determined by Kruskal-Wallis Test with Dunn’s multiple comparisons test (two-sided) unless stated otherwise.
Fig. 2
Fig. 2. Alcohol-related organ damage and cardiovascular dysfunction.
A Experimental protocol of murine 20-day binge-on-chronic alcohol (BoCA) model. Three treatment cohorts were enrolled: pair-fed (PF, green); alcohol-fed (AF, red); alcohol-fed + probiotics L3B2 (AF + P, blue). Created in BioRender. Sharp, T. (2024) https://BioRender.com/x77k051. BD Echocardiographic measurements of structure and function. LVPWd left ventricular posterior wall-diastole. LVIDd left ventricular internal diameter-diastole. LVEF left ventricular ejection fraction from a single cohort of mice. E Systemic invasive hemodynamics, systolic and diastolic blood pressure from two separate experiments. F Left ventricular end-diastolic pressure from two separate experiments. G Quantification of Masson’s Trichrome stain as a percentage of total tissue area from a single experiment. Statistical analysis was determined by repeated measures two-way ANOVA with a Bonferroni’s multiple comparisons test (two-sided). H Representative 20× magnification brightfield microscopy of Masson’s Trichrome staining (blue) of myocardium. Scale bar = 100 μm. I, J Aortic vasorelaxation to acetylcholine (ACh) and sodium nitroprusside (SNP). Statistical analysis was determined by repeated measures two-way ANOVA with a Bonferroni’s multiple comparisons test (two-sided). (*) p-value < 0.05 PF vs. AF + P [blue line]; (**) p-value < 0.0001 PF vs. AF [red line], PF vs. AF + P [blue line]; (##) p-value < 0.01 AF + P vs. AF [blue line]. Non-linear fit lines for each treatment were plotted using log(agonist) vs response four-parameter variable slope. KM Plasma (from multiple studies), cardiac, and liver (from a single study) nitrite levels. N Plasma cytokine levels as fold change compared to pair-fed. Statistical significance determined by two-way ANOVA with Geisser-Greenhouse correction with Tukey’s multiple comparison test. N = 7 per group. O Representative microscopy of cardiac vascular cell adhesion molecule (VCAM-1, brown) at 20× magnification. Scale bar = 50 μm. Magnification of the vessel. P Quantification of cardiac VCAM-1 positive blood vessels as percentage of total tissue area. Q Representative microscopy of liver VCAM-1 at 20× magnification. Scale bar = 50 μm. Magnification of vessel. R Quantification of liver VCAM-1 positive blood vessels as percentage of total tissue area. All data (2B-G, 2K-M, 2P and 2R) are presented as box and whisker plots (mean, max, and min.) with individual measurement dot plots unless otherwise stated. Number of mice enrolled in each measurement is found in open circle. Significance (p < 0.05) was determined by Kruskal-Wallis Test with Dunn’s multiple comparisons test (two-sided) unless stated otherwise.
Fig. 3
Fig. 3. Alcohol consumption disrupts gut homeostasis through microbial community reorganization, gut leak, and altered gut immunity.
A Alpha diversity—observed, ACE, and Shannon Index. B Beta diversity—unweighted unique fraction metric (UniFrac) beta-diversity of PF, AF, and AF + P. Dots represent individual samples. Statistical analysis was determined using PERMANOVA. C Firmicutes/Bacteriodetes ratio. D Individual relative abundance of Firmicutes and Bacteriodetes. E Relative abundance of Proteobacteria. F Bar graph of top 20 genera relative abundance altered between PF, AF, and AF + P. G, H Representative fluorescent images at 20× magnification of tight junction protein 1 (ZO-1), Claudin-1, and Occludins (green). DAPI nuclear stain (blue). Scale bar = 100 μM. Quantification of mean fluorescent intensity of each target per group. i Plasma levels of intestinal fatty-acid binding protein (iFABP). J Fecal immunoglobulin A (IgA) levels. Data presented as independent biological replicates. Number of mice enrolled in each measurement is found in open circle. Statistical significance (p < 0.05) was determined by paired Student’s T-test (two-tailed) between baseline and day 20. Dot plots represent individual measurements. K Relative mRNA expression of βDefensin-3, βDefensin-4, and Reg-3r in fecal samples at day 20. l Representative flow cytometric gating for analysis of bacterial cell damage and death. M Bis-(1,3-Dibutylbarbituric Acid) Trimethine Oxonol (DiBAC4) positive bacterial cell quantification per group as a percentage of total cells. N Propidium Iodide (Pi) positive bacterial cell quantification per group as a percentage of total cells. All data (A, CE, H, I, KN) are presented as box and whisker plots (mean, max, and min.) with individual measurement dot plots unless stated otherwise from a single experiment. Pair-fed (PF, green); alcohol-fed (AF, red); alcohol-fed + probiotics L3B2 (AF + P, blue) unless otherwise stated. Number of mice enrolled in each measurement is found in open circle. Significance (p < 0.05) was determined by one-way ANOVA with Holm-Šídák multiple comparisons test (two-sided) unless stated otherwise.
Fig. 4
Fig. 4. Elevated PAGln is associated with cardiac and vascular pathophysiology.
A Representative illustration of phenylalanine metabolism in the gut and host to generate phenylacetylglycine (PAGly) or phenylacetylglutamine (PAGln). Microbiome-mediated metabolism (orange) and host-mediated metabolism (black). Created in part by BioRender. Sharp, T. (2024) https://BioRender.com/i94x574. BD Plasma phenylacetic acid (PAA), PAGly, and PAGln levels measured by LC-MS/MS. Pair-fed (PF, green); alcohol-fed (AF, red); alcohol-fed + probiotics L3B2 (AF + P, blue). Number of mice enrolled in each measurement is found in open circle from a single experiment. All data are presented as box and whisker plots (mean, max, and min.) with individual measurement dot plots. Significance (p < 0.05) was determined by Kruskal-Wallis Test, Dunn’s multiple comparisons test (two-sided) unless stated otherwise. E Association of mean relative abundance of Staphylococcus, plasma PAGln and nitrite levels, and either LVEDP or ACh. Maximal relaxation. Association of mean relative abundance of Lactobacillus, plasma PAGln, and nitrite levels, and either LVEDP or ACh. Maximal relaxation.
Fig. 5
Fig. 5. Alcohol-associated PAGln production and cardiovascular dysfunction are transmissible traits.
A Experimental protocol of fecal microbiota transplantation (FMT) model. Two treatment cohorts were enrolled; pair-fed (PF-FMT, gray); and alcohol-fed (AF-FMT, blue). Created in BioRender. Sharp, T. (2024) https://BioRender.com/x77k051. BD Echocardiographic measurements of structure and function. LVPWd left ventricular posterior wall-diastole. LVIDd left ventricular internal diameter-diastole. LVEF, left ventricular ejection fraction. E Systemic invasive hemodynamics, systolic and diastolic blood pressure. F Left ventricular end-diastolic pressure. G, H Aortic vasorelaxation to acetylcholine (ACh) and sodium nitroprusside (SNP). Statistical significance (p < 0.05) analysis was determined by repeated measures two-way ANOVA with a Bonferroni’s multiple comparisons test (two-sided). (*) p-value < 0.05; (**) p-value < 0.01, PF-FMT vs. AF-FMT [blue line], respectively. Non-linear fit lines for each treatment were plotted using log(agonist) vs. response four-parameter variable slope. IK Plasma, cardiac, and liver nitrite levels. l Plasma PAGln levels measured via LC-MS/MS. M Cardiac LC-MS/MS PAGln levels. All data (BF, IM) are presented as box and whisker plots (mean, max, and min.) with individual measurement dot plots unless otherwise stated from a single experiment. Number of mice enrolled in each measurement is found in open circle. Significance (p < 0.05) was determined by nonparametric Mann-Whitney Test compare ranks (two-sided) unless stated otherwise.
Fig. 6
Fig. 6. PAGln is sufficient to cause cardiovascular dysfunction.
A Experimental protocol of pharmacological increases in PAGln. Two treatment cohorts were enrolled: vehicle, orange; and PAGln (50 mg/kg; twice daily, I.P., purple). Created in BioRender. Sharp, T. (2024) https://BioRender.com/x77k051. BF Echocardiographic measurements of structure and function. LVPWd left ventricular posterior wall-diastole. LVIDd left ventricular internal diameter-diastole. LVEF left ventricular ejection fraction. E Systemic invasive hemodynamics, systolic and diastolic blood pressure. F Left ventricular end-diastolic pressure. G, H Aortic vasorelaxation to acetylcholine (ACh) and sodium nitroprusside (SNP). Statistical significance (p < 0.05) analysis was determined by repeated measures two-way ANOVA with a Bonferroni’s multiple comparisons test (two-sided). (***) p-value < 0.001 Vehice [orange line] vs. PAGln [purple line]. Non-linear fit lines for each treatment were plotted using log(agonist) vs. response four-parameter variable slope. IK Plasma, cardiac, and liver nitrite levels. L, M Plasma and Cardiac PAGln levels measured via LC-MS/MS. All data (BF, IM) are presented as box and whisker plots (mean, max, and min.) with individual measurement dot plots unless otherwise stated from a single experiment. Number of mice enrolled in each measurement is found in open circle. Significance (p < 0.05) was determined by nonparametric Mann-Whitney Test compare ranks (two-sided) unless stated otherwise.
Fig. 7
Fig. 7. PAGln induces hypercontractility and altered Ca2+ handling in cardiomyocytes.
A Illustration of experimental protocol for isolation and measurement of cardiomyocyte sarcomere length and calcium transients under varying conditions (i.e., baseline [gray]), isoproterenol (iso, 10 nM [light blue]) ± carvedilol (carv., 1 μM [green]), or PAGln (2 μM [pink]) ± carv. (yellow). Created in BioRender. Sharp, T. (2024) https://BioRender.com/v51f310. B Representative field stimulation tracings of baseline and exposure to iso. or PAGln ± carv. C Sarcomere fractional shortening as a percentage change of baseline. D, E Departure and return velocities, change in length over change in time. F Representative calcium transients during field stimulation at baseline and following exposure to iso. ± carv. or PAGln ± carv. G Baseline intracellular diastolic calcium in each condition. H Peak intracellular calcium transients in each condition. I Tau, transient decay rate, at baseline and after exposure to PAGln. J, K Phospholamban (PLN) total abundance and phosphorylation (p) at serine 16 (S16) normalized to total PLN protein in isolated cardiomyocyte lysate post incubation with PAGln, isoproterenol (10 nM), carvedilol (1 μM), or combination in a single experiment with (2) replicates. Quantification of total PLN and pS16 PLN. PAGln phenylacetylglutamine. All data (CE, GI) are presented as individual independent biological replicate dot plots. Normality was assessed using the Shapiro-Wilk test. Statistical significance (p < 0.05) was determined by (two-tailed) unpaired t-Test performed on parametric data sets while Mann-Whitney test was used to compare ranks on nonparametric data unless otherwise stated.
Fig. 8
Fig. 8. PAGln induces endothelial cell activation through increased reactive oxygen species leading to endothelial dysfunction.
AE Messenger RNA expression levels of markers of endothelial cell activation in vehicle (black/gray) or PAGln-treated (10, orange; 20, green; 100, purple). TEK tyrosine kinase (Tie2); interleukin 6 (Il6); Intercellular adhesion molecule, vascular cell adhesion molecule, and endothelial-leukocyte adhesion molecule (Icam1, Vcam1, Elam1, respectively); – chemokine ligand 16 (Cxcl16); nuclear factor erythroid 2-related factor 2 (Nrf2); nitric oxide synthase 3 (Nos3). Number of independent biological replicates enrolled in each measurement is found in open circle. All data are presented as box and whisker plots (mean, max, and min.) with individual measurement dot plots. Significance (p < 0.05) was determined by Kruskal-Wallis Test, Dunn’s multiple comparisons test (two-sided) unless stated otherwise. F Representative 20× magnified phase-contrast photomicrographs with fluorescent overlay of ROS sensor in HCAECs under three conditions: (1) control or (2) PAGln (100 μM, purple) incubation. Quantification of GFP+ as a percentage of total image normalized to baseline (time 0). N = 5–6 independent biological replicates were performed per treatment. Plotted the mean + SEM with group across time. Shaded area represents the total area under the curve per treatment group. Scale bar = 200 μm. G, H Representative western blot images of interleukin-1B, interleukin-18, catalase-1, superoxide dismutase-1 (SOD-1) and heme oxygenase-1 (HO-1) across time in vechile-treated or PAGln-treated HCAECs (n = 3 independent biological replicates [i.e., wells], each per timepoint per condition). Relative abundance of the vehicle, normalized to vehicle 1-h and PAGln-treated HCAECs normalized to the respective vehicle timepoint. Data are presented as the mean ± SEM. Dot plots show independent biological replicates. Multiple student t-test (two-tailed) were performed for statistical significance (p < 0.05) analysis. I, J Representative 4× magnified photomicrographs of scratch assay wells from vehicle (black), 24 h PAGln incubation (light purple), and PAGln 48 h pre-incubation (inc.)(dark purple) at baseline, 12-h post, and 24-h post injury. N = 5–6 independent biological replicates were performed per treatment. Quantification of wound healing as a percentage of original scratch over 24-h presented as the mean ± SEM. Linear regression analysis was performed for each condition to provide the slope and y-intercept for each condition. Significance (p < 0.05) was determined for the slope between groups. Scale bar = 200 μm.
Fig. 9
Fig. 9. Illustration summarizing how alcohol-induced microbial reorganization and associated phenylacetylglutamine production leads to cardiovascular disease.
Consumption of alcohol leads to various pathological alterations in the gut including microbial reorganization, loss of gut barrier function, and altered gut immunity. Furthermore, this leads to an increase in host levels of phenylacetylglutamine (PAGln) which through fecal transplant studies and direct injection demonstrates consistent pathophysiological effects similar to that of alcohol on the cardiovascular system—including the heart, cardiomyocytes, vasculature, and endothelial cells. These results provide a gut-centric mechanism by which alcohol consumption leads to increased susceptibility to cardiovascular disease. Created in BioRender. Sharp, T. (2024) https://BioRender.com/q32a230.

References

    1. Piano, M. R. Alcohol’s effects on the cardiovascular system. Alcohol Res.38, 219–241 (2017). - PMC - PubMed
    1. Biddinger, K. J. et al. Association of habitual alcohol intake with risk of cardiovascular disease. JAMA Netw. Open5, e223849 (2022). - PMC - PubMed
    1. Whitman, I. R. et al. Alcohol abuse and cardiac disease. J. Am. Coll. Cardiol.69, 13–24 (2017). - PMC - PubMed
    1. Matyas, C. et al. Chronic plus binge ethanol feeding induces myocardial oxidative stress, mitochondrial and cardiovascular dysfunction, and steatosis. Am. J. Physiol. Heart Circ. Physiol.310, H1658–H1670 (2016). - PMC - PubMed
    1. Singal, A. K. & Mathurin, P. Diagnosis and treatment of alcohol-associated liver disease: a review. JAMA326, 165–176 (2021). - PubMed

Publication types

MeSH terms

Associated data

Grants and funding

LinkOut - more resources