. 2024 Dec 30;15(1):10850.
doi: 10.1038/s41467-024-55148-3.

DNA replication initiation drives focal mutagenesis and rearrangements in human cancers

Affiliations

DNA replication initiation drives focal mutagenesis and rearrangements in human cancers

Pierre Murat et al. Nat Commun. .

Abstract

The rate and pattern of mutagenesis in cancer genomes is significantly influenced by DNA accessibility and active biological processes. Here we show that efficient sites of replication initiation drive and modulate specific mutational processes in cancer. Sites of replication initiation impede nucleotide excision repair in melanoma and are off-targets for activation-induced deaminase (AICDA) activity in lymphomas. Using ductal pancreatic adenocarcinoma as a cancer model, we demonstrate that the initiation of DNA synthesis is error-prone at G-quadruplex-forming sequences in tumours displaying markers of replication stress, resulting in a previously recognised but uncharacterised mutational signature. Finally, we demonstrate that replication origins serve as hotspots for genomic rearrangements, including structural and copy number variations. These findings reveal replication origins as functional determinants of tumour biology and demonstrate that replication initiation both passively and actively drives focal mutagenesis in cancer genomes.


Conflict of interest statement

Competing interests: The authors declare no competing interests.

Figures

Fig. 1
Fig. 1. Pan-cancer analysis of mutation distribution across the genome reveals enrichment at constitutive origins.
a Mutation rates associated with the six pyrimidine substitutions at constitutive origins. Mutation rates were computed from aggregated mutation calls from 86 ICGC cancer projects, corrected for local variation in base composition and background values. b Averaged and background adjusted mutation rates stratified by cancer types. Acronyms of cancer types are detailed in the Methods section. c Distribution of origins / origin flanks mutation density ratios of individual cancer samples stratified by cancer type and primary sites. Density ratios were computed by considering origin domains (origin midpoints ± 500 bp) and origin flanking domains (origin midpoints ± 10 kb excluding origin domains). Box plots show medians and interquartile ranges. Individual cancer samples are shown as grey dots. Only whole-genome-sequenced cancer samples with at least 5,000 mutations were considered for experiments reported in (b, c).
Fig. 2
Fig. 2. Signature analysis uncovers distinct mutagenic processes focused at constitutive origins.
a Cancer sample clustering based on the cosine similarity of their origin trinucleotide mutational signature. Each signature at origin domains was corrected to adjust for local trinucleotide composition and background values from neighbouring origin flanking domains. Only whole-genome-sequenced cancer samples with at least 50 mutations at origins were considered. b Distribution of cancer types and primary sites within the five identified clusters of tumours. c Origin-associated mutational signatures for tumour clusters. Signatures were computed from aggregated mutation calls at origin domains for clustered cancer samples and corrected as previously. d Local exposure to mutational signatures associated with clustered tumours. Signature contributions are corrected for background origin flank values. e Total mutation count at origins and (f) origin/origin flanks mutation density ratios for individual cancer samples grouped by clusters. Box plot show medians and interquartile ranges. Individual cancer samples are represented as grey dots.
Fig. 3
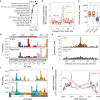
Fig. 3. Differential DNA repair and off-target AID deamination underlie mutation hotspots at origins.
Nucleotide excision repair in ultraviolet-irradiated human cells inversely mirrors mutation density at origins in skin melanomas. a Average melanoma mutation density for cluster 1 tumour samples (red line) and strand-resolved XR-seq profiles for CPD (blue lines) in CSB/ERCC6 mutant NHF1 skin fibroblasts at constitutive origins. b Number of mutations at origins as a function of XR-seq signals for CPD (blue line) or 6–4 PP (red line). XR-seq signals were binned by read coverage. Mutation data represent the means and standard errors to the mean of values for each XR-seq signal bin. c Strand-resolved cluster 1 mutational signature contribution to mutagenesis at the origins of cluster 1 tumours. Signature contribution was computed by considering aggregated mutation calls from cluster 1 tumours. Constitutive origins are off-targets for AID deamination in malignant B cell lymphomas. d Consensus contexts of mutations mapped within origin or origin flank domains for cluster 4 tumours. The central position represents the mutated bases. e Fraction of C > T mutations (orange line) or C residues (black line) overlapping the WRCY AID hotspot motif (where W represents weak bases, R purines, C the mutated bases and Y pyrimidines) at origins of cluster 4 tumours. f Pan-cancer origins/origin flanks mutation density ratios as a function of AID (AICDA) expression. Mutation density ratio values were computed for transcript per million (TPM) bins and represent the means and standard errors of the mean.
Fig. 4
Fig. 4. Polymerase δ behaviour at G-quadruplex structures drives origin mutagenesis in diverse cancer types.
a River plot illustrating the sequence contexts of T > G mutations at origins or origin flanks for cluster 2 tumour samples. b Distribution of the G-quadruplex (G4) propensity scores, G4H scores, associated with short 51 bp sequences encompassing T > G substitutions at origins and origin flanks, or any T residues at origins. c Distribution of G4H scores for all or T > G mutated sequences at origin domains, fitting the pattern N5G3+N1–12G3+N1–12G3+N1–12G3+N5 (where N is any base), representing potential G4 formation. Box plot report medians and interquartile ranges. Outliers are shown as grey dots. ***P < 0.001, Kolmogorov-Smirnov test. d Distribution at single-nucleotide resolution of mutations and G frequency at G4-forming sequences found within 1 kb domains centred on origins. The start of the G4s is defined as the first G from the first G tract of the previous pattern. G4-forming sequences were oriented toward the direction of replication. e Absolute contribution of COSMIC signatures SBS10b (blue, left hand Y-axis) and SBS10c (red, right hand Y-axis) to mutagenesis at origins, associated with the activity of POLE and POLD1, respectively. Both signatures are attributed to defective proofreading due to acquired mutations in the exonuclease domains of the polymerases.
Fig. 5
Fig. 5. Replicative stress exacerbates origin mutagenesis in pancreatic ductal adenocarcinoma.
a UMAP dimensionality reduction of transcriptomic profiles from 194 pancreatic ductal adenocarcinoma samples (PACA project) reveals three cancer subtypes denoted PACA 1 to 3. b Distribution of origins/origin flanks mutation density ratios for individual cancer samples categorised by PACA subtypes. Box plot report medians and interquartile ranges. Grey dots represent individual cancer samples. ***P < 0.001, Kolmogorov-Smirnov test. c Relative contribution of Cluster 2 signature to mutagenesis at origins. d Pathway enrichment analysis of genes dysregulated in PACA subtype 1 compared to subtypes 2 and 3. Normalised enrichment scores indicate the extent of upregulation of gene sets representing KEGG pathways in PACA 1 tumours. Selected dysregulated pathways are colour-coded: cancer and cell proliferation (blue), carbohydrate metabolism (orange), and DNA repair and replication (red). e Gene expression levels of replication stress biomarkers in pancreatic cancer, categorised by PACA subtypes, represented as Z scores computed from the distribution of gene expression values across all PACA samples.
Fig. 6
Fig. 6. Constitutive origins serve as focal points for structural and copy number variants.
a Analysis of DNA repair and replication pathways. Primary KEGG pathways were dissected into smaller components to identify specific processes downregulated in PACA subtype 1 compared to subtypes 2 and 3. b Distribution of structural variant (SV) break ends at origins across PACA tumour subtypes. Enrichment of break ends is presented as the fold change from background calculated from origin flank values. c Distribution of the number of copy number variation (CNV) segments in individual PACA samples categorised by PACA tumour subtypes. Box plots illustrate medians and interquartile ranges, with grey dots indicating individual cancer samples. n. s. non-significant, ***P < 0.001, Kolmogorov-Smirnov test. d Pan-cancer signatures of structural variation based on break ends mapped at origins or origin flanks, categorised by SV types and lengths. SV types are: INS (insertion), DEL (deletion), DUP (duplication), INV (inversion) and ITX (translocation). e Distribution of SV break ends at 5 nt resolution at G-quadruplex forming sequences within origin or origin flank domains. f Signatures of copy number variation for PACA tumour subtypes, classified by CNV types, copy number, and evidence of loss of heterozygosity (LOH) or not (Het). Each CNV type is further classified by increasing segment sizes (from left to right). Segment sizes were excluded from this plot to enhance clarity. Detailed information on segment sizes can be found in the Methods section. g Enrichment of origins within amplified CNV segments in PACA subtypes. Enrichment values were evaluated by partitioning CNV segments and their flanking domains (±2 Mb) into an equal number of windows, calculating the number of origins per segment and per window, and then determining the mean number of origins per window. This value was then adjusted by subtracting the mean values observed in segment flanking domains. The resulting origin enrichment value indicates the excess of origins within a given window.

References

    1. Hanahan, D. & Weinberg, R. A. Hallmarks of cancer: the next generation. Cell144, 646–674 (2011). - PubMed
    1. Dominguez-Sola, D. et al. Non-transcriptional control of DNA replication by c-Myc. Nature448, 445–451 (2007). - PubMed
    1. Di Micco, R. et al. Oncogene-induced senescence is a DNA damage response triggered by DNA hyper-replication. Nature444, 638–642 (2006). - PubMed
    1. Macheret, M. & Halazonetis, T. D. Intragenic origins due to short G1 phases underlie oncogene-induced DNA replication stress. Nature555, 112–116 (2018). - PMC - PubMed
    1. Hills, S. A. & Diffley, J. F. X. DNA replication and oncogene-induced replicative stress. Curr. Biol.24, R435–R444 (2014). - PubMed

Publication types

Associated data