. 2024 Dec 30;15(1):10842.
doi: 10.1038/s41467-024-55187-w.

The survival of B cells is compromised in kidney disease

Affiliations

The survival of B cells is compromised in kidney disease

Doureradjou Peroumal et al. Nat Commun. .

Abstract

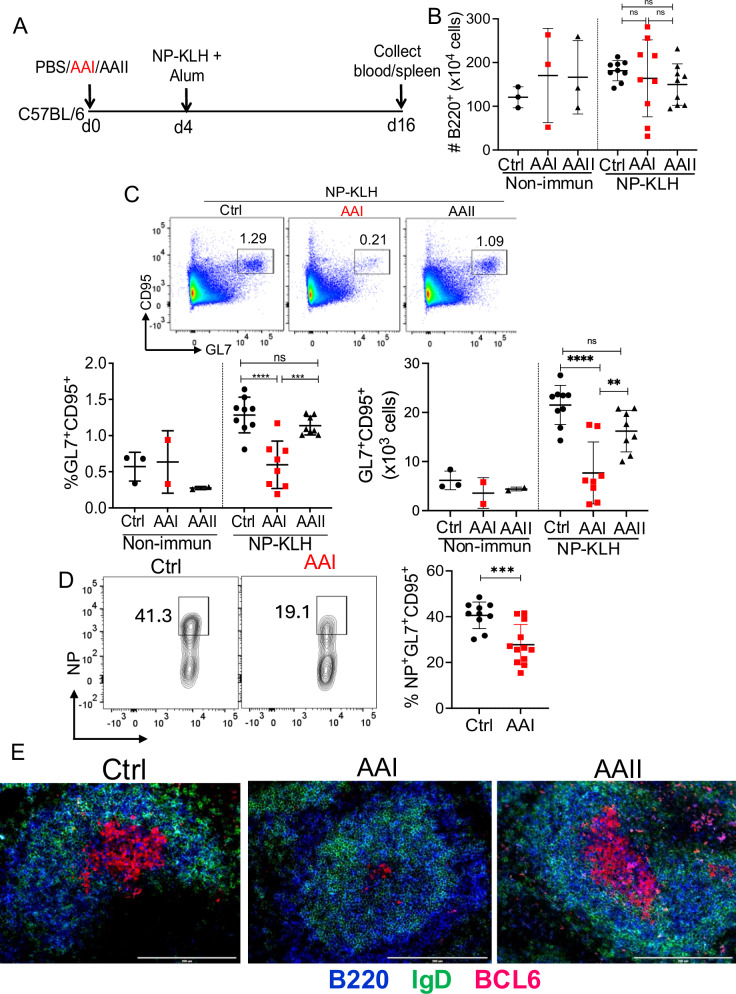
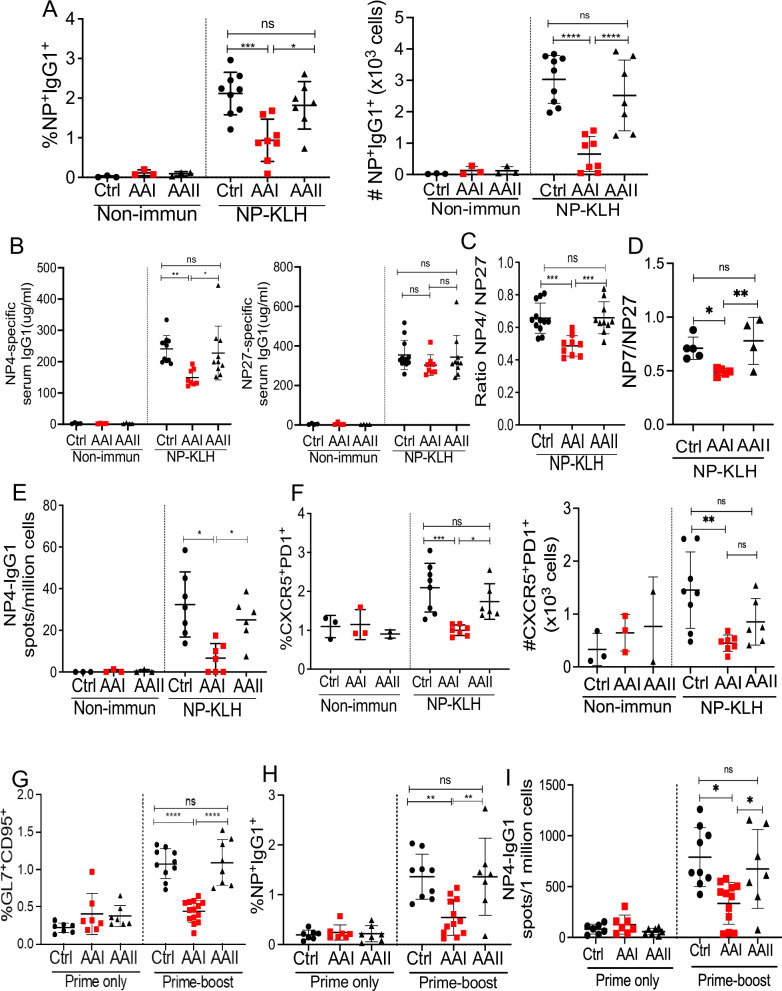
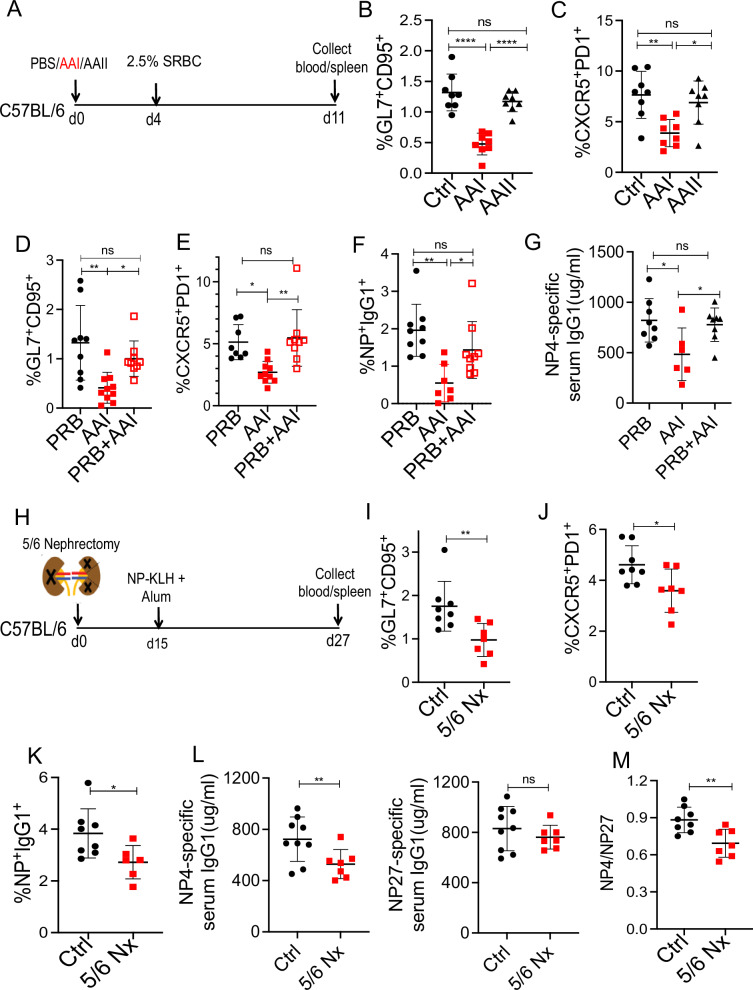
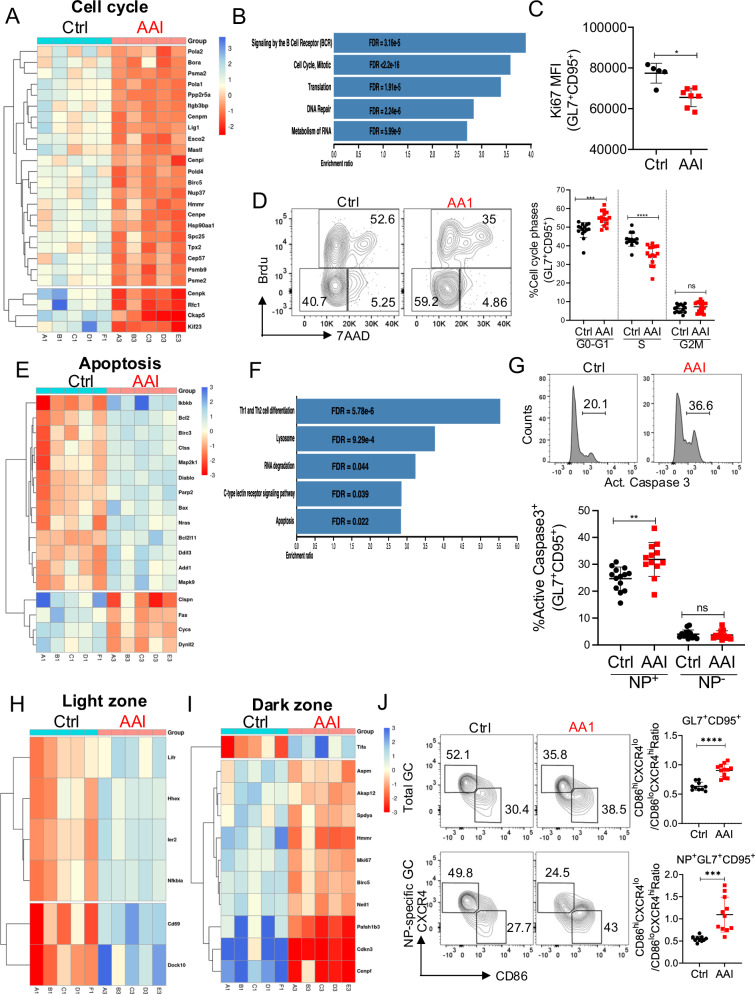
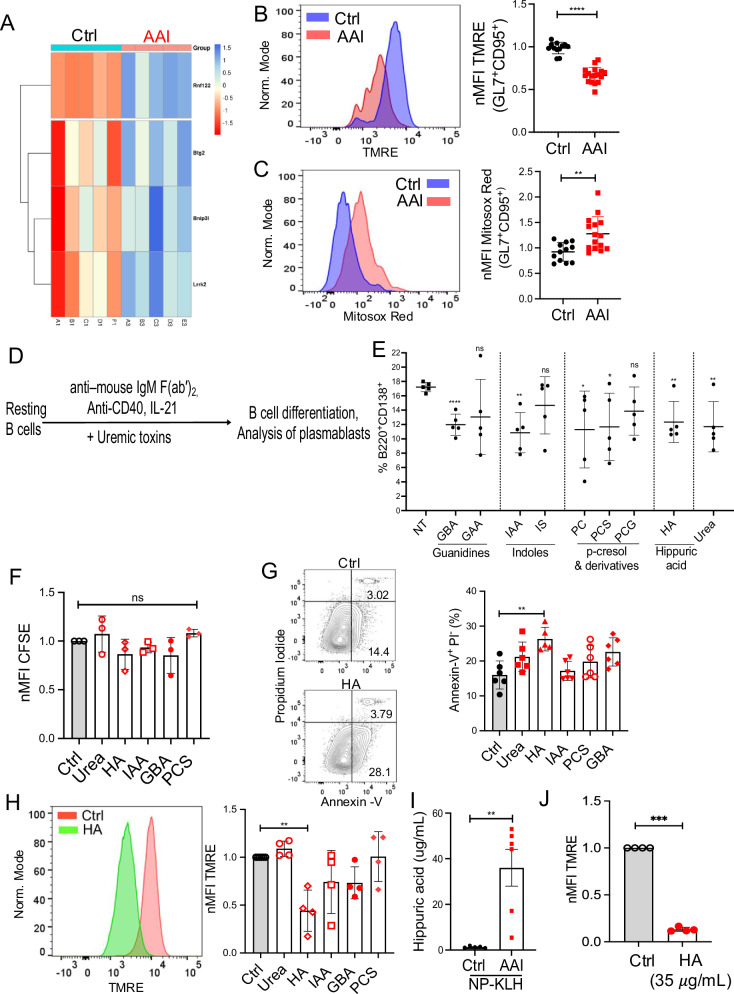
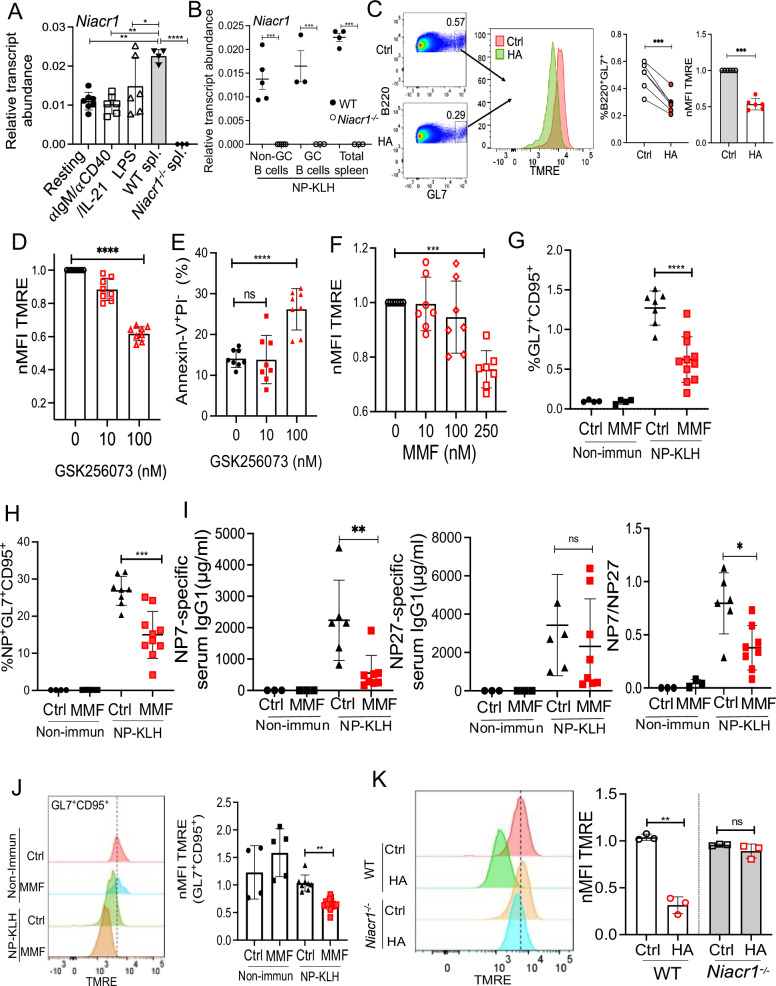
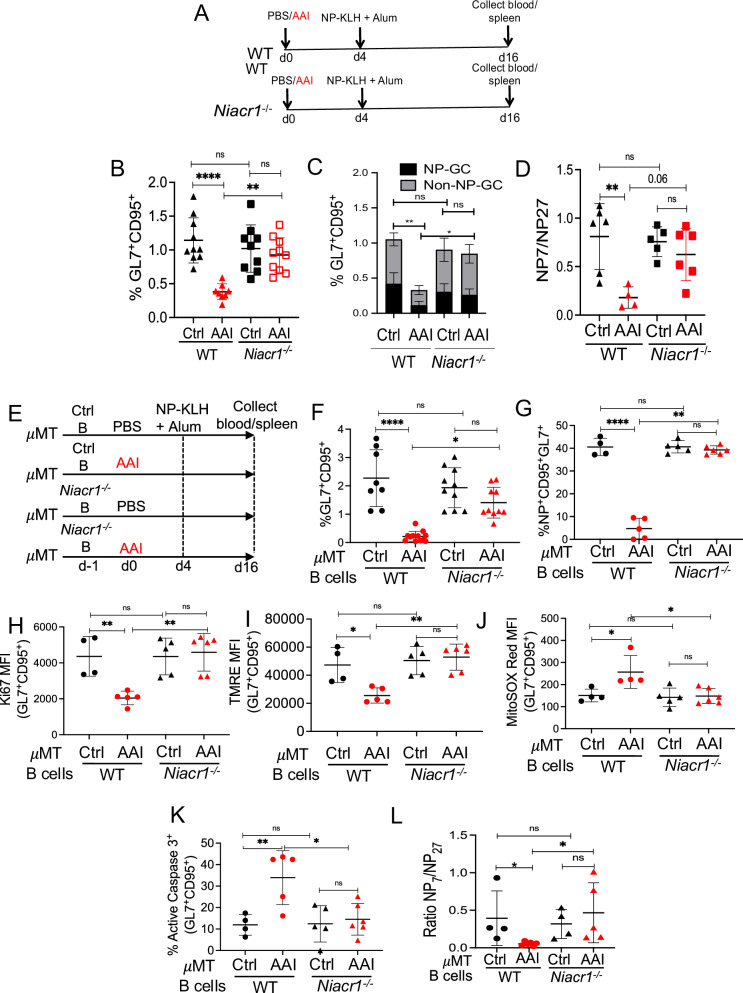
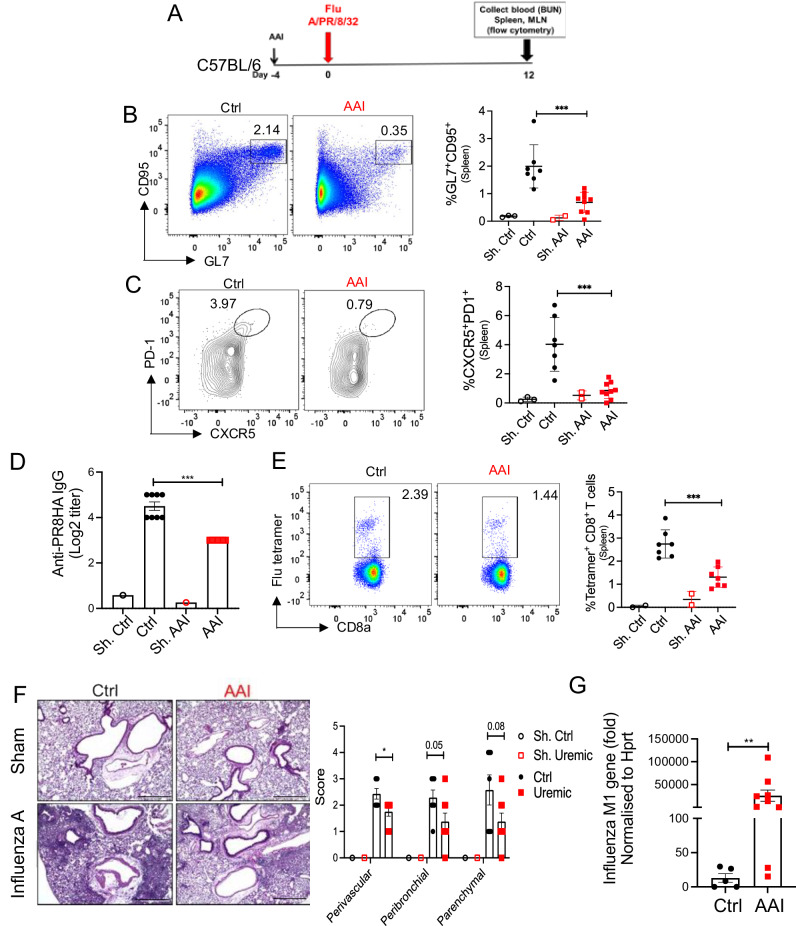
Antibody-mediated protection against pathogens is crucial to a healthy life. However, the recent SARS-CoV-2 pandemic has shown that pre-existing comorbid conditions including kidney disease account for compromised humoral immunity to infections. Individuals with kidney disease are not only susceptible to infections but also exhibit poor vaccine-induced antibody response. Using multiple mouse models of kidney disease, we demonstrate that renal dysfunction inhibits germinal center (GC) response against T-dependent antigens. GC B cells exhibit increased apoptosis in kidney disease. Uremic toxin hippuric acid drives loss of mitochondrial membrane potential, leading to increased apoptosis of GC B cells in a G-protein-coupled receptor 109A dependent manner. Finally, GC B cells and antibody titer are diminished in mice with kidney disease following influenza virus infection, a major cause of mortality in individuals with renal disorders. These results provide a mechanistic understanding of how renal dysfunction suppresses humoral immunity in patients with kidney disease.


Conflict of interest statement

Competing interests: The authors declare no competing interests.

Figures

Fig. 1
Fig. 1. Impaired GC formation in AAN mice.
A Schematic diagram of the experimental design. C57BL/6 (WT) mice were i.p. injected with a single dose of AAI, AAII (7.5 mg/kg b.wt), or PBS (Ctrl). Mice were either immunized with NP-KLH in alum or left non-immunized 4 days post-AAI injection. At 12 days post-immunization, spleens were assessed for B B cells (liveB220+) [Non-immun: Ctrl (3), AAI (3), AAII (3); NP-KLH: Ctrl (9), AAI (9), AAII (9)] C total GC B cells (liveB220+GL7+CD95+) [Non-immun: Ctrl (3), AAI (2), AAII (2); NP-KLH: Ctrl (9), AAI (8), AAII (8)], D NP-specific GC B cells (liveB220+NP+GL7+CD95+) [NP-KLH: Ctrl (10), AAI (12)] by flow cytometry, and (E) GC formation (n = 3) by immunofluorescence staining of spleen section. Scale bar = 50 μm. Each dot represents individual mice and data are pooled from at least 2–3 independent experiments (BD). Data expressed as Mean ± SD. Statistical analyses by One-way ANOVA (B, C) and two-sided t-test (D). C Ctrl vs. AAI ****P < 0.0001, AAI vs. AAII ***P = 0.0007 and Ctrl vs. AAI ****P < 0.0001, AAI vs. AAII **P = 0.0060. D *** P = 0.0008. ns: statistically not significant. Source data are provided as a Source Data file.
Fig. 2
Fig. 2. Mice with kidney disease show defects in affinity maturation, TFh, and secondary B cell response.
C57BL/6 (WT) mice were i.p. injected with a single dose of AAI, AAII (7.5 mg/kg b.wt), or PBS (Ctrl). Mice were either immunized with NP-KLH in alum or left non-immunized (non-immun) 4 days post-AAI injection. At day 12 post-immunization, spleens were assessed for A NP-specific switched IgG1+ B cells (liveIgDIgMCD138Gr1B220+NP+IgG1+) by flow cytometry [Non-immun: Ctrl (3), AAI (3), AAII (3); NP-KLH: Ctrl (9), AAI (8), AAII (7)], B serum NP4 and NP27-specific IgG1 by ELISA [Non-immun: Ctrl (4), AAI (4), AAII (4); NP-KLH Ctrl (12), AAI (8), AAII (10)], and C NP4/NP27-specific IgG1 ratio was determined to measure antibody affinity maturation at day 12 post-immunization [NP-KLH: Ctrl (12), AAI (8), AAII (10)]. D NP7/NP27-specific IgG1 ratio was determined to measure antibody affinity maturation at day 21 post-immunization [NP-KLH: Ctrl (5), AAI (5), AAII (4)]. E NP4-specific antibody-secreting plasma cells generation in the spleen by ELISPOT assay [Non-immun: Ctrl (3), AAI (3), AAII (3); NP-KLH: Ctrl (7), AAI (7), AAII (6)]. F The frequency of TFh (liveCD4+CD44+CXCR5+PD1+) cells in the spleen was determined by flow cytometry at day 12 post-immunization [Non-immun: Ctrl (3), AAI (3), AAII (2); NP-KLH: Ctrl (8), AAI (7), AAII (6)]. AAN and control mice were primed with NP-KLH in alum followed by NP-KLH boost 36 days later. Primed only and boosted mice spleens were evaluated for G total GC (liveB220+GL7+CD95+) [Prime only: Ctrl (7), AAI (7), AAII (7); Prime-boost: Ctrl (10), AAI (14), AAII (8)], H NP-specific switched IgG1+ B cells (liveIgDIgMCD138 Gr1B220+NP+IgG1+) [Prime only: Ctrl (7), AAI (7), AAII (7); Prime-boost: Ctrl (9), AAI (12), AAII (7)], and I NP4-specific IgG1-producing plasma cells 6 days later [Prime only: Ctrl (7), AAI (7), AAII (7); Prime-boost: Ctrl (9), AAI (12), AAII (7)]. Each dot represents individual mice and data are pooled from at least 2–3 independent experiments (AI). Data expressed as Mean ± SD. Statistical analyses by One-way ANOVA (AI). A Ctrl vs. AAI ***P = 0.0007, AAI vs. AAII *P = 0.0252 and Ctrl vs. AAI ****P < 0.0001, AAI vs. AAII ****P < 0.0001. B Ctrl vs. AAI **P = 0.0069, AAI vs. AAII *P = 0.0247. C Ctrl vs. AAI ***P = 0.0004, AAI vs. AAII ***P = 0.0005. D Ctrl vs. AAI *P = 0.0565, AAI vs. AAII **P = 0.0063. E Ctrl vs. AAI *P = 0.020, AAI vs. AAII *P = 0.0299. F Ctrl vs. AAI ***P = 0.0007, AAI vs. AAII *P = 0.0276 and Ctrl vs. AAI **P = 0.0038. G Ctrl vs. AAI ****P < 0.0001, AAI vs. AAII ****P < 0.0001. H Ctrl vs. AAI **P = 0.0038, AAI vs. AAII **P = 0.0073. I Ctrl vs. AAI *P = 0.036, AAI vs. AAII *P = 0.0492. ns: statistically not significant. Source data are provided as a Source Data file.
Fig. 3
Fig. 3. Kidney disease inhibits B cell response during T-dependent immunization.
A Schematic diagram of the experimental plan. AAN and control mice were i.p. immunized with 2.5% SRBC (n = 8) 4 days post-AAI injection. Seven days later, B total GC (liveB220+GL7+CD95+) [SRBC: Ctrl (8), AAI (8), AAII (8)], and C TFh (liveCD4+CD44+CXCR5+PD1+) cells were measured by flow cytometry [SRBC: Ctrl (8), AAI (8), AAII (8)]. AAN mice were either treated with probenecid (PRB + AAI) once on day 0 (relative to AAI injection) or left untreated. Control mice received probenecid only (PRB). Four days later, mice received NP-KLH immunization and assessed for D total GC B cells [PRB (9), AAI (7), PRB + AAI (9)], E TFh cells [PRB (9), AAI (10), PRB + AAI (9)], F NP-specific switched IgG1+ B cells (liveIgDIgMCD138 Gr1B220+ NP+IgG1+) by flow cytometry [PRB (9), AAI (7), PRB + AAI (9)], and G serum NP4-specific IgG1 level by ELISA [PRB (8), AAI (6), PRB + AAI (8)]. H Diagram of the experimental design. WT mice were either subjected to 5/6 nephrectomy (5/6 Nx) (n = 7) or sham-operated (Ctrl) (n = 8). Two weeks after surgery, mice were immunized with NP-KLH and assessed for I total GC [Ctrl (8), 5/6 Nx (7)], J TFh cells [Ctrl (8), 5/6 Nx (7)], K NP-specific switched IgG1+ B cells [Ctrl (8), 5/6 Nx (6)], L serum NP4 and NP27-specific IgG1 levels [Ctrl (8), 5/6 Nx (7)], and M NP4/NP27- IgG1 ratio to measure affinity maturation [Ctrl (8), 5/6 Nx (7)]. Each dot represents individual mice and data are pooled from at least 2–3 independent experiments (BG and IM). Data expressed as Mean ± SD. Statistical analyses by One-way ANOVA (BG) and two-sided t-test (IM). B Ctrl vs. AAI **** P < 0.0001, AAI vs. AAII ****P < 0.0001. C Ctrl vs. AAI **P = 0.0027, AAI vs. AAII *P = 0.0160. D PRB vs. AAI **P = 0.0018, AAI vs. PRB + AAI *P = 0.0472. E PRB vs. AAI *P = 0.0112, AAI vs. PRB + AAI **P = 0.0029. F PRB vs. AAI **P = 0.0012, AAI vs. PRB + AAI *P = 0.0415. G PRB vs. AAI * P = 0.0222, AAI vs. PRB + AAI *P = 0.0484. I **P = 0.0096. J *P = 0.0278. K *P = 0.0295. L **P = 0.0028. M **P = 0.0049. ns: statistically not significant. Source data are provided as a Source Data file.
Fig. 4
Fig. 4. Kidney dysfunction triggers apoptosis in GC B cells.
NP-specific GC B cells from the control and AAN spleen (n = 5) were flow sorted on day 12 post-immunization and subjected to RNA-Seq analysis. A Relative expression of significantly differentially expressed genes (q-value < 0.05) related to cell cycle, and B Over-representation pathway analysis of significantly downregulated genes in AAN GC B cells. C MFI of Ki67+ GC B cells [NP-KLH: Ctrl (5), AAI (7)]. D Cell cycle status of GC B cells was analyzed at day 12 post-immunization [NP-KLH: Ctrl (15), AAI (15)]. E Relative expression of significantly differentially expressed genes (q-value < 0.05) related to apoptosis and F Over-representation pathway analysis of upregulated genes in GC B cells from AAN mice. G NP+ and NP GC B cells staining for active caspase3 expression (n = 12–14) at day 12 post-immunization [NP-KLH: Ctrl (14), AAI (12)]. Relative expression of significantly differentially expressed genes (q-value < 0.05) related to H Light zone (LZ), and I Dark zone (DZ) GC B cells. J Number of LZ centrocytes (CXCR4loCD86hi) and DZ centroblasts (CXCR4hiCD86lo) at day 12 post-immunization [NP-KLH: Ctrl (10), AAI (12)]. Each dot represents individual mice and data pooled from at least 2–3 experiments (C, D, G, and J). Data expressed as Mean ± SD. Statistical analyses by two-sided t-test (C, D, G, and J). C *P = 0.0228. D G0-G1 ***P = 0.0001, S ****P < 0.0001. G **P = 0.0023. J ****P < 0.0001 and ***P = 0.0003. Source data are provided as a Source Data file.
Fig. 5
Fig. 5. HA drives loss of mitochondrial membrane potential in B cells.
A NP-specific GC B cells from the control and AAN spleen (n = 5) were flow sorted on day 12 post-immunization for RNA-Seq analysis. Relative expression of significantly differentially expressed genes (q-value < 0.05) related to mitochondrial membrane potential. At day 12 post-immunization, B mitochondrial membrane potential [NP = KLH: Ctrl (12), AAI (17)], and C mitoROS production [NP = KLH: Ctrl (12), AAI (15)] were measured in GC B cells by TMRE and MitoSox Red staining, respectively. D Schematic diagram of in vitro B cell assay. E WT resting splenic B cells (n = 5) ± uremic toxins were stimulated with αIgM/αCD40/IL-21 and the number of B220+CD138+ plasmablasts was determined by flow cytometry at 96 h. WT B cells ± αIgM/αCD40/IL-21 ± uremic toxins and F proliferation (CFSE dilution) of plasmablasts was assessed at 48 h (n = 3), G apoptosis (n = 6), and H mitochondrial membrane potential was measured in plasmablasts at 24 h (n = 4). I HA concentration in the serum of mice was measured by LC-MS/MS [Ctrl (5), AAI (6)]. J WT splenic B cells + αIgM/αCD40/IL-21 ± HA (35 μg/ml) were assessed for the loss of mitochondrial membrane potential in plasmablasts at 24 h. Each dot represents individual mice (B, C, and I) and 5 (E), 3 (F), 6 (G), and 4 (H, J) experiments. Data pooled from 2–3 experiments (B, C, and I). Data expressed as Mean ± SD. Statistical analyses by One-way ANOVA (EH) and two-sided t-test (B, C, I, and J). B ****P < 0.0001. C **P = 0.0029. E NT vs. GBA ****P < 0.0001, NT vs. IAA **P = 0.0011, NT vs. PC *P = 0.0398, NT vs. PCS *P = 0.0307, NT vs. HA **P = 0.0059, NT vs. Urea **P = 0.0084. G Ctrl vs. HA **P = 0.0019. H Ctrl vs. HA **P = 0.0032. I **P = 0.0037. J ***P = 0.0004. ns: statistically not significant. Source data are provided as a Source Data file.
Fig. 6
Fig. 6. HA causes apoptosis of B cells via GPR109A.
A Resting splenic B cells (n = 5–6) ± αIgM/αCD40/IL-21 or LPS were assessed for Niacr1 mRNA expression by RT-qPCR at 24 h. Total splenocytes from WT and Niacr1/ mice (n = 3) were used as positive and negative controls, respectively. B Niacr1 transcript expression was assessed by RT-qPCR on NP-KLH immunized and FACS-sorted non-GC (liveB220+GL7CD95), total GC (liveB220+GL7+CD95+) (2 mice pooled together) and total spleen cells from WT and Niacr1/ mice (n = 6) at day 12 post-immunization. C Purified total WT B cells from NP-KLH immunized mice (at day 12 post-immunization) were incubated with HA for six hours and assessed for the loss of mitochondrial membrane potential of GC B cells by TMRE staining (B220+GL7+) cells. B cells ± αIgM/αCD40/IL-21± (D and E) GSK256073/± (F) MMF and mitochondrial membrane potential and apoptosis of plasmablasts were measured. Immunized WT mice were i.p. injected with MMF or left untreated (Ctrl) every alternate day and evaluated for G total GC [Non-immun: Ctrl (4), MMF (4); NP-KLH: Ctrl (7), MMF (11)], H NP-specific GC [Non-immun: Ctrl (4), MMF (4); NP-KLH: Ctrl (7), MMF (11)], I serum NP7 and NP27-specific IgG1 titers and affinity maturation (NP7/NP27-IgG1 ratio) [Non-immun: Ctrl (3), MMF (3); NP-KLH: Ctrl (6), MMF (8)] and J loss of mitochondrial membrane potential of GC B cells [Non-immun: Ctrl (4), MMF (5); NP-KLH: Ctrl (8), MMF (13)]. K Resting splenic B cells (n = 3) from WT and Niacr1/ mice were stimulated with αIgM/αCD40/IL-21 in the presence or absence of HA. The B220+CD138+ cells were analyzed for the loss of mitochondrial membrane potential by TMRE staining 24 h later. Each dot represents individual mice (B and GJ) and individual experiments (A, CF, and K). Data pooled from 2–3 independent experiments (B and GJ) and individual experiments A (5), C, D (8), E, F (7) and K (3). Data expressed as Mean ± SD. Statistical analyses by One-way ANOVA (A, B, and DK) and two-sided t-test (C). A Resting vs. WT spleen **P = 0.0015, αIgM/αCD40/IL-21 vs. WT spleen **P = 0.0010, LPS vs WT spleen *P = 0.0523, WT spleen vs. Niacr1/ spleen ****P < 0.0001. B Non-GC B cells ***P = 0.0005, GC B cells ***P = 0.0004, Total Spleen ***P = 0.0002. C ***P = 0.0004 and ****P = 0.0005. D ****P < 0.0001. E ****P < 0.0001. F ***P = 0.0008. G ****P < 0.0001. H ***P = 0.0002. I **P = 0.0067 and NP7/NP27: *P = 0.0106. J **P = 0.0015. K **P = 0.0134. ns: statistically not significant. Source data are provided as a Source Data file.
Fig. 7
Fig. 7. B cell-specific GPR109A expression induces apoptosis in kidney disease.
A Diagram of the experimental design. WT and Niacr1/ mice (n = 8–10) were subjected to AAN followed by NP-KLH in alum immunization. B Total GC B cells (liveB220+GL7+CD95+) [NP-KLH: WT Ctrl (10), AAI (8); Niacr1/ Ctrl (9), AAI (10)], C NP-specific GC B cells (liveB220+NP+GL7+CD95+) by flow cytometry [NP-KLH: WT Ctrl (11), AAI (9); Niacr1/ Ctrl (11), AAI (10)], and D antibody affinity maturation as assessed by NP7/NP27-specific serum IgG1 ratio was evaluated at day 12 post-immunization [NP-KLH: WT Ctrl (6), AAI (4); Niacr1/ Ctrl (5), AAI (6)]. E Resting splenic B cells from WT or Niacr1/ mice were adoptively transferred into control or AAN μMT mice one day before AAI injection. Mice were immunized with NP-KLH in alum four days post-AAI-injection. At day 12 post-immunization, spleens were assessed for F total GC formation [NP-KLH: WT Ctrl (8), AAI (12); Niacr1/ Ctrl (10), AAI (10)], G NP-specific GC formation [NP-KLH: WT Ctrl (4), AAI (5); Niacr1/ Ctrl (5), AAI (6)], H proliferation [NP-KLH: WT Ctrl (4), AAI (5); Niacr1/ Ctrl (5), AAI (6)], I loss of mitochondrial membrane potential [NP-KLH: WT Ctrl (4), AAI (5); Niacr1/ Ctrl (5), AAI (6)], J mitochondrial ROS generation by total GC B cells [NP-KLH: WT Ctrl (4), AAI (5); Niacr1/ Ctrl (5), AAI (6)], K apoptotic NP-specific GC B cells by flow cytometry [NP-KLH: WT Ctrl (4), AAI (5); Niacr1/ Ctrl (5), AAI (6)], and L antibody affinity maturation as assessed by NP7/NP27-specific serum IgG1 ratio [NP-KLH: WT Ctrl (4), AAI (6); Niacr1/ Ctrl (4), AAI (5)]. Each dot represents individual mice (BD and FL). Data pooled from 2–3 independent experiments (BD, and FL). Data expressed as Mean ± SD. Statistical analyses by One-way ANOVA (BD, and FL). B WT Ctrl vs AAI ****P < 0.0001, WT AAI vs Niacr1/ AAI **P = 0.0017. C WT Ctrl vs AAI **P = 0.005, WT AAI vs Niacr1/ AAI *P = 0.04852. D WT Ctrl vs AAI **P = 0.0060. F WT Ctrl vs AAI ****P < 0.0001, WT AAI vs Niacr1/ AAI *P = 0.0142. G WT Ctrl vs AAI ****P < 0.0001, WT AAI vs Niacr1/ AAI **P = 0.006. H WT Ctrl vs AAI **P = 0.0093, WT AAI vs Niacr1/ AAI **P = 0.0018. I WT Ctrl vs AAI *P = 0.0162, WT AAI vs Niacr1/ AAI **P = 0.0010. J WT Ctrl vs AAI *P = 0.0243, WT AAI vs Niacr1/ AAI *P = 0.0110. K WT Ctrl vs AAI **P = 0.0096, WT AAI vs Niacr1/ AAI *P = 0.0115. L WT Ctrl vs AAI *P = 0.0653, WT AAI vs Niacr1/ AAI *P = 0.0150. ns: statistically not significant. Source data are provided as a Source Data file.
Fig. 8
Fig. 8. Diminished B and T cells response in influenza-infected mice in kidney disease.
A Schematic representation of the experimental design. Mice were either injected with AAI or PBS (Ctrl). Four days post-AAI injection, mice were infected with 1000 PFU of mouse-adapted influenza H1N1 strain A/PR/8/34 via oropharyngeal aspiration (n = 7–9) or left sham infected (n = 3). At day 12 p.i., spleen of infected and sham mice was assessed for B GC (liveB220+GL7+CD95+) [Sham: Ctrl (3), AAI (2); Influenza: Ctrl (7), AAI (9)], and C TFh (liveCD4+CD44+CXCR5+PD1+) cells by flow cytometry [Sham: Ctrl (3), AAI (2); Influenza: Ctrl (7), AAI (9)], D serum anti-PR8HA IgG titer by HAI assay [Sham: Ctrl (1), AAI (1); Influenza: Ctrl (8), AAI (7)], and E influenza-specific CD8+ T cells by tetramer staining [Sham: Ctrl (2), AAI (2); Influenza: Ctrl (7), AAI (7)]. F Influenza A virus infected and sham lungs were subjected to H&E staining and peri-vascular, peri-bronchiolar, and parenchymal inflammation were scored [Sham: Ctrl (1), AAI (1); Influenza: Ctrl (7), AAI (8)]. Scale bar = 50 μm. G Viral load in the lung was quantified by assessing Influenza A virus M1 gene expression by Taqman qPCR assay [Influenza: Ctrl (5), AAI (9)]. Data is normalized to the HPRT gene. Each dot represents individual mice and data are pooled from 2–3 independent experiments (BG). Data expressed as Mean ± SD. Statistical analyses by One-way ANOVA (B, C, and E), two-sided t-test (F), Mann–Whitney test (G), and Kruskal–Wallis test (D). B ***P = 0.0007. C ***P = 0.0003. D ***P = 0.0002. E ***P = 0.0005. F Peri-vascular *P = 0.020521. G **P = 0.007. Source data are provided as a Source Data file.

References

    1. Valderas, J. M., Starfield, B., Sibbald, B., Salisbury, C. & Roland, M. Defining comorbidity: implications for understanding health and health services. Ann. Fam. Med.7, 357–363 (2009). - PMC - PubMed
    1. Gijsen, R. et al. Causes and consequences of comorbidity: a review. J. Clin. Epidemiol.54, 661–674 (2001). - PubMed
    1. Kovesdy, C. P. Epidemiology of chronic kidney disease: an update 2022. Kidney Int. Suppl. (2011)12, 7–11 (2022). - PMC - PubMed
    1. Mahalingasivam, V. et al. COVID-19 and kidney disease: insights from epidemiology to inform clinical practice. Nat. Rev. Nephrol.18, 485–498 (2022). - PMC - PubMed
    1. Brogan, M. & Ross, M. J. COVID-19 and kidney disease. Annu Rev. Med74, 1–13 (2023). - PubMed

Publication types

Associated data