. 2024 Dec 30;15(1):10860.
doi: 10.1038/s41467-024-55164-3.

Aging-induced immune microenvironment remodeling fosters melanoma in male mice via γδ17-Neutrophil-CD8 axis

Affiliations

Aging-induced immune microenvironment remodeling fosters melanoma in male mice via γδ17-Neutrophil-CD8 axis

Runping Duan et al. Nat Commun. .

Abstract

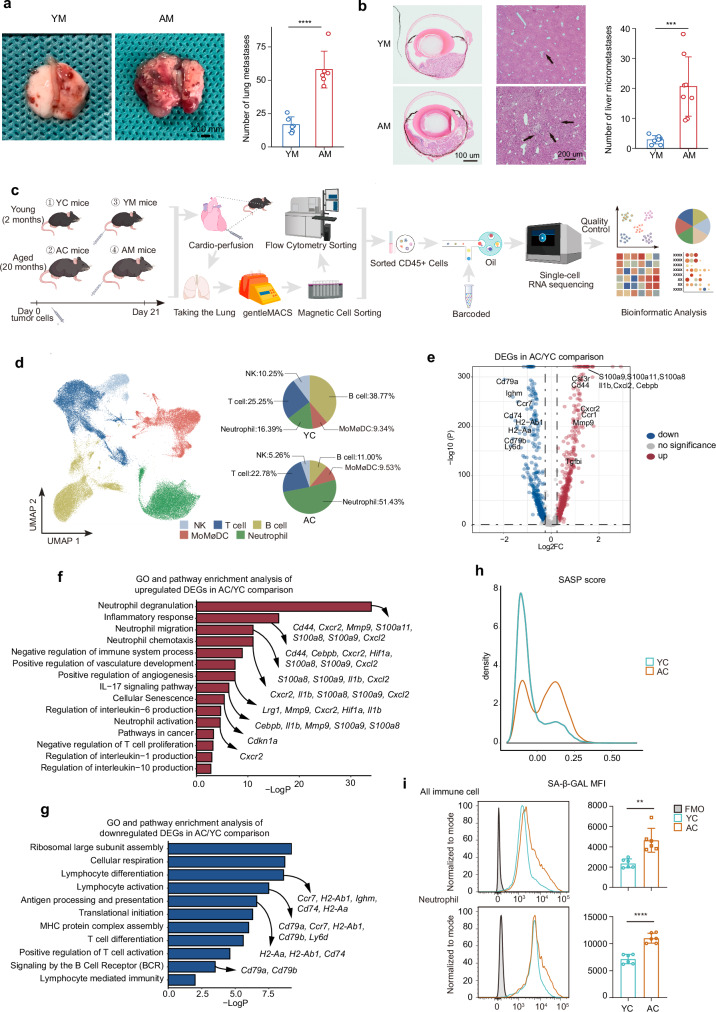
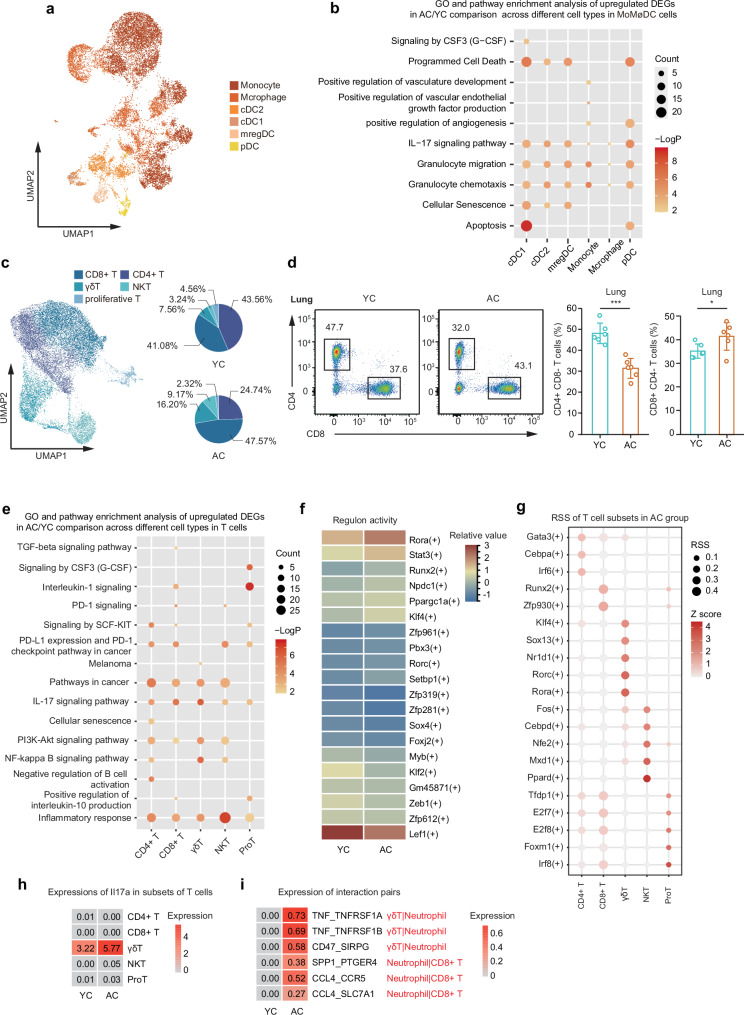
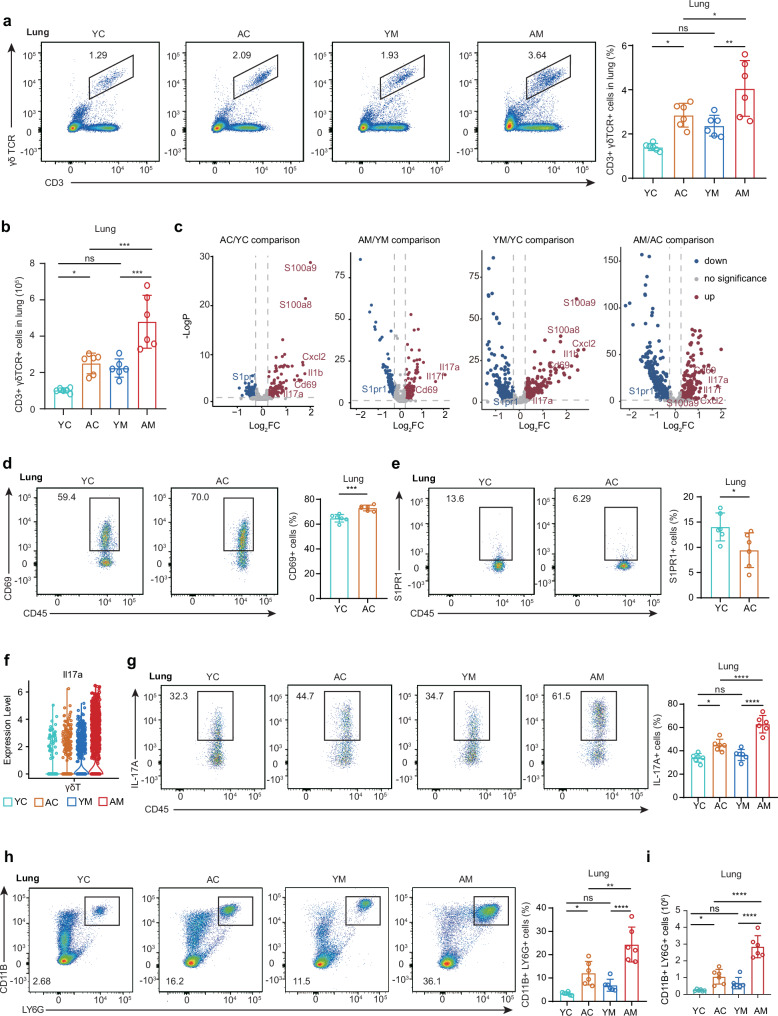
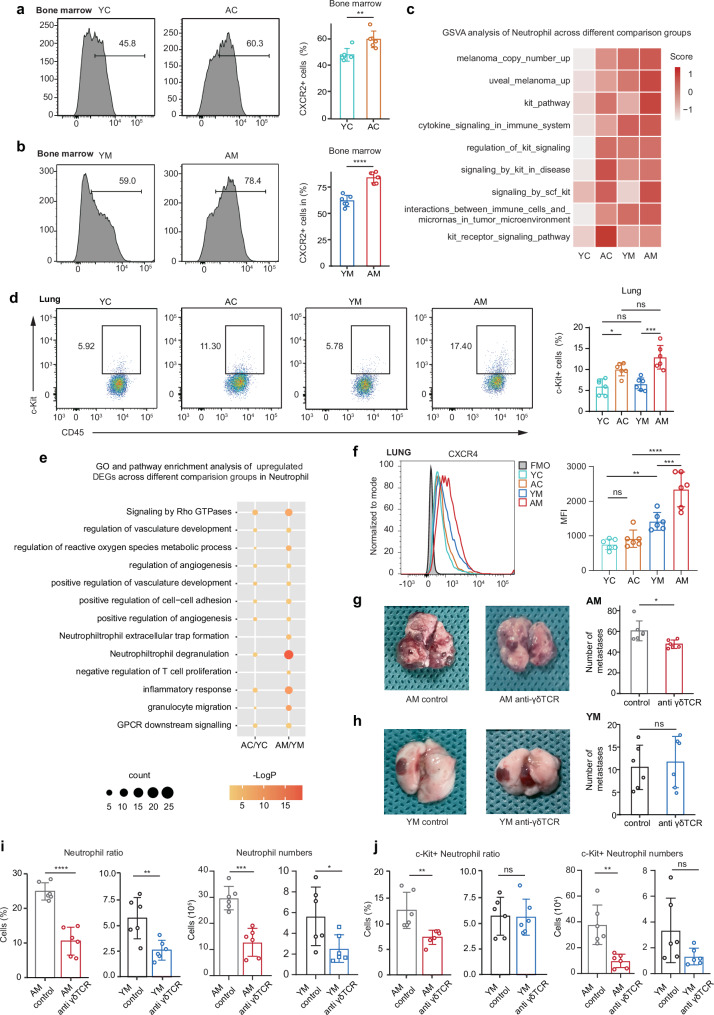
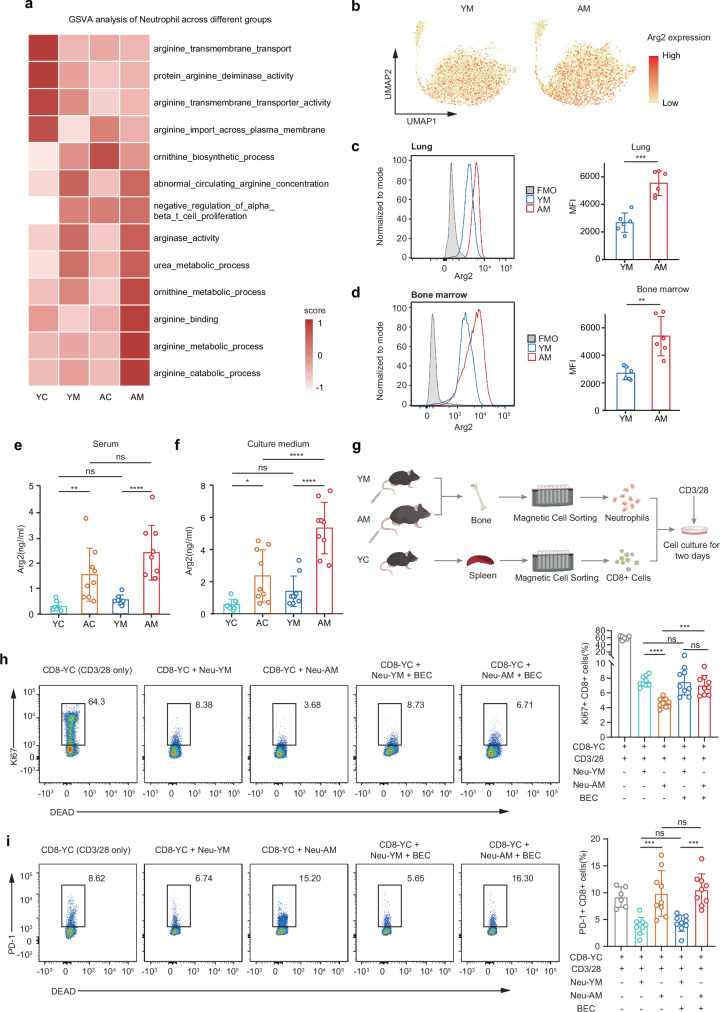
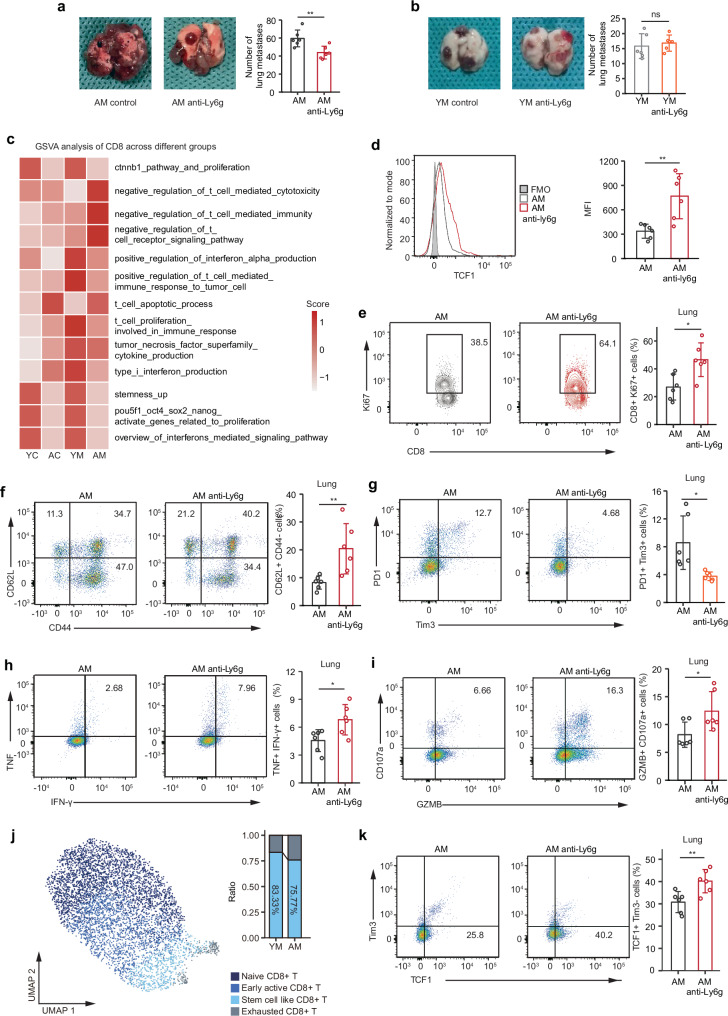
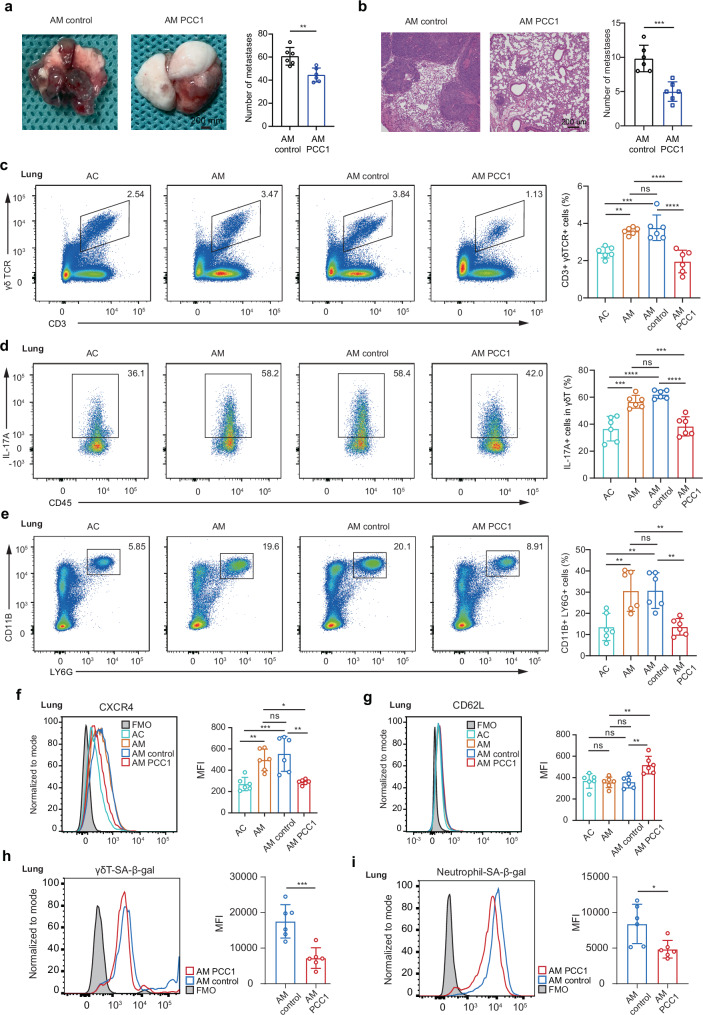
Aging is associated with increased tumor metastasis and poor prognosis. However, how an aging immune system contributes to the process is unclear. Here, single-cell RNA sequencing reveals that in male mice, aging shifts the lung immune microenvironment towards a premetastatic niche, characterized by an increased proportion of IL-17-expressing γδT (γδ17) and neutrophils. Mechanistically, age-dependent downregulation of the immune trafficking receptor S1pr1 drives the expansion of γδ17. Compared to young mice, expanded γδ17 recruit tumor-promoting neutrophils with lower expression levels of CD62L and higher levels of C-kit and CXCR4. These neutrophils suppress the stemness and tumor-killing functions of CD8+ T cells in aged male mice. Accordingly, antibody-mediated depletion of γδT or neutrophils reduces tumor metastatic foci in aged animals, and the administration of the senolytic agent procyanidin C1 reverses the observed immune-mediated, tumor-promoting effects of aging. Thus, we uncover a γδ17-Neutrophil-CD8 axis that promotes aging-driven tumor metastasis in male mice and provides potential insights for managing metastatic tumors.


Conflict of interest statement

Competing interests: The authors declare no competing interests.

Figures

Fig. 1
Fig. 1. Study design and scRNA-seq analysis of aged lung immune microenvironment.
a Representative images and quantitative results of lung metastases in young and aged mice. Each mouse was injected with 5 × 105 B16F10 cells via the tail vein. Each group contains six mice. Young mice are 2 months old, aged mice are 20 months old. Data expressed as mean ± SD. P = 5.0E−05. Significance was determined using unpaired two-tailed Student’s t test. ****P < 0.0001. YM young model, AM aged model. Scale bars: 200 mm. b Representative images and quantitative results of liver metastases (arrow) after intraocular tumor establishment in young and aged mice. Each mouse was injected with 2.5 × 105 B16F10 cells via subretina. Young mice are 2 months old, aged mice are 20 months old. Each group contains eight mice. Data expressed as mean ± SD. P = 1.7E−04. Significance was determined using an unpaired two-tailed Student’s t test. ***P < 0.001. Scale bars: 100 um, 200 um. c Schematic of the experimental design for scRNA-seq. YM and AM groups were respectively injected with B16F10 cells via the tail vein at day 0, and then the lung immune cells of YC, AC, YM, and AM groups were sorted for scRNA-seq at day 21. YC young control, AC aged control. Each image was drawn by PaintTool SAI (version 1.2) and Adobe illustrator 2023 (version 27.0). d Uniform manifold approximation and projection (UMAP) plot showing the cluster of cell types, pie charts showing the percentages of the immune cells in AC and YC groups. MoMøDC macrophages, monocytes and dendritic cells, NK natural killer cells. e Volcano plot showing upregulated and downregulated DEGs of all immune cells (as a whole) between AC and YC mice. Significance was determined using “FindMarkers” functions of Seurat package with Wilcoxon Rank Sum test and adjusted by Bonferroni correction. Representative GO terms and KEGG pathways enriched in upregulated DEGs (f) and downregulated DEGs (g) of all immune cells (as a whole) in the AC/YC comparison. Significance was calculated based on the accumulative hypergeometric distribution by Metascape webtool. h Kernel density estimation plot showing the shift of senescence-associated secretory phenotype (SASP) gene set score with age in total immune cells from mouse lung, calculated based on gene expression. The x-axis shows the range of scores, the y-axis indicates the calculated density, representing the likelihood of data falling within each range on the x-axis SASP: Senescence-associated secretory phenotype. i MFI of SA-β-Gal in all immune cells and neutrophils in lungs from YC/AC groups, which were measured by flow cytometry, calculated on CD45+ cells or CD45+CD11B+LY6G+ cells. Each group contains six mice. Data expressed as MFI of SA-β-Gal (mean ± SD). All immune cell (P = 1.2E−03), neutrophil (P = 2.0E−05). Significance was determined using unpaired two-tailed Student’s t test. SA-β-Gal senescence-associated β-galactosidase, MFI mean fluorescence intensity. ****P < 0.0001, **P < 0.01. Source data are provided as a Source Data file.
Fig. 2
Fig. 2. scRNA-seq reveals the changes in aged myeloid and T cell subsets.
a UMAP plot of myeloid cell subsets. cDC1 type 1 conventional dendritic cells, cDC2 type 2 conventional dendritic cells, mregDC mature dendritic cells enriched in immunoregulatory molecules, pDC plasmacytoid dendritic cells. b Dot plot showing representative GO terms and KEGG pathways enriched in upregulated DEGs of myeloid cell subsets in the AC/YC comparison. Significance was calculated based on the accumulative hypergeometric distribution by Metascape webtool. c UMAP plot of T cell subsets and Pie charts showing the percentages of the T cell subsets in AC and YC groups. NKT natural killer T cells, γδT gamma delta T cells. d Proportions of lung CD4+ and CD8+ T cells were measured by flow cytometry, gated on CD45+CD3+ cells. Each group contains six mice. Data expressed as % of CD4+ T cells or CD8+ T cells (mean ± SD). CD4+ (P = 1.3E−04), CD8+ (P = 0.04). Significance was determined using unpaired two-tailed Student’s t test. *P < 0.05, ***P < 0.001. e Dot plot showing representative GO terms and KEGG pathways enriched in upregulated DEGs of T cell subsets in the AC/YC comparison. Significance was calculated based on the accumulative hypergeometric distribution by Metascape webtool. f Heatmap exhibiting the top 10 active transcription factors of AC and YC groups, color key from blue to red indicates expression levels from low to high. g Dot plot showing top 5 regulon specificity score across T cell subsets in AC group. h Heatmap showing the average Il-17a expression levels across T cell subsets between AC and YC groups. i Cell-cell communication was analyzed by cellphoneDB, obtaining the expression level of interaction pairs among cell subtypes between AC and YC groups. Heatmap showing the expression of top three interaction pairs: TNF_TNFRSF1A, TNF_TNFRSF1B and CD47_SIRPG between γδT cells and neutrophils; SPP1_PTGER4, CCL4_CCR5 and CCL4_SLC7A1 between neutrophils and CD8+ T cells. Source data are provided as a Source Data file.
Fig. 3
Fig. 3. Aging facilitates the recruitment of tissue-resident γδ17 and neutrophils.
a Proportions of lung γδT cells were measured by flow cytometry, gated on CD45+ cells. Each group contains six mice. Data expressed as % of γδT cells (mean ± SD). YC-AC (P = 0.01), AC-AM (P = 0.04), YM-AM (P = 3.5E−03). Significance was determined using one-way ANOVA. *P < 0.05, **P < 0.01, ***P < 0.001, ns no significance, P > 0.05. b Quantity of γδT cells in per 0.1 g lung. Each group contains six mice. Data expressed as number of γδT cells (mean ± SD). YC-AC (P = 0.02), AC-AM (P = 6.0E−04), YM-AM (P = 2.0E−04). Significance was determined using one-way ANOVA. *P < 0.05, **P < 0.01, ***P < 0.001, ns no significance, P > 0.05. c Volcano plot showing DEGs in AC/YC, AM/YM, YM/YC, and AM/AC comparison. Significance was determined using the “FindMarkers” functions of the Seurat package with the Wilcoxon Rank Sum test and adjusted by Bonferroni correction. Proportions of lung CD69 + γδT (d) and S1PR1 + γδT (e) cells from AC and YC mice were measured by flow cytometry, gated on CD45+CD3+γδTCR+ cells. Each group contains six mice. Data expressed as % of CD69 + γδT or S1PR1 + γδT cells (mean ± SD). P = 3.4E−04 (d); P = 0.03 (e). Significance was determined using an unpaired two-tailed Student’s t test. *P < 0.05. f Violin plot showing average expression levels of IL-17A in γδT cells in each group, based on the scRNA-seq data. g Proportions of lung IL-17A + γδT cells were measured by flow cytometry, gated on CD45+CD3+γδTCR+ cells. Each group contains six mice. Data expressed as % of γδ17 cells (mean ± SD). YC-AC (P = 0.01), AC-AM (P = 7.1E−05), YM-AM (P = 2.8E−07). Significance was determined using one-way ANOVA. *P < 0.05, ****P < 0.0001, ns P > 0.05. h Proportions of lung neutrophils were measured by flow cytometry, gated on CD45+ cells. Each group contains six mice. Data expressed as % of neutrophils (mean ± SD). YC-AC (P = 0.02), AC-AM (P = 1.1E−03), YM-AM (P = 1.6E−05). Significance was determined using one-way ANOVA. *P < 0.05, **P < 0.01, ****P < 0.0001, ns P > 0.05. i Quantity of neutrophils in per 0.1 g lung. Each group contains six mice. Data expressed as number of neutrophils (mean ± SD). YC-AC (P = 0.02), AC-AM (P = 3.5E−06), YM-AM (P = 1.7E−07). Significance was determined using one-way ANOVA. *P < 0.05, ****P < 0.0001, ns P > 0.05. Source data are provided as a Source Data file.
Fig. 4
Fig. 4. γδ17 rendered neutrophils to present a more pro-tumoral phenotype in an aging state.
Proportions of CXCR2+ cells in neutrophils in bone marrow from AC/YC groups (a) and AM/YM groups (b), measured by flow cytometry, gated on CD45+CD11B+LY6G+ cells. Each group contains six mice. Data expressed as % of CXCR2+ neutrophils (mean ± SD). P = 4.8E−03 (a); P = 2.1E−05 (b). Significance was determined using unpaired two-tailed Student’s t test. **P < 0.01, ****P < 0.0001. c Based on the scRNA-seq data from lung, heatmap showing representative KEGG pathways of neutrophils across AC, YC, AM and YM groups, calculated by GSVA packages. Color key from white to red indicates expression levels from low to high. d Proportions of lung c-Kit+ neutrophils were measured by flow cytometry, gated on CD45+CD11B+LY6G+ cells. Each group contains six mice. Data expressed as % of c-Kit+ neutrophils (mean ± SD). YC-AC (P = 0.01), YM-AM (P = 1.0E−04). Significance was determined using one-way ANOVA. *P < 0.05, ***P < 0.001, ns P > 0.05. e Dot plot showing representative GO terms and KEGG pathways enriched in upregulated DEGs of neutrophils in the AC/YC and AM/YM comparison. Significance was calculated based on the accumulative hypergeometric distribution by Metascape webtool. f MFI of CXCR4 in neutrophils of lung from AM/YM/AC/YC groups, which were measured by flow cytometry, gated on CD45+CD11B+LY6G+ cells. FMO fluorescence minus one control. Each group contains six mice. Data expressed as MFI of CXCR4 (mean ± SD). YC-YM (P = 8.4E−03), AC-AM (P = 1.1E−06), YM-AM (P = 3.5E−04). Significance was determined using one-way ANOVA. **P < 0.01, ***P < 0.001, ****P < 0.0001, ns P > 0.05. Representative images and quantitative results of lung metastases in aged (g) and young (h) mice with anti-γδTCR or isotype (control) treated. Each group contains six mice. Data expressed as number of metastases (mean + SD). P = 0.01 (g); P = 0.7 (h). Significance was determined using unpaired two-tailed Student’s t test. *P < 0.05, ns P > 0.05. Proportions and quantity of neutrophils (i) and c-Kit+ neutrophils (j) were measured by flow cytometry, gated on CD45+ cells or CD45+CD11B+LY6G+ cells. Each group contains six mice. Data expressed as % or number of neutrophils, c-Kit+ neutrophils (mean ± SD). Neutrophils-ratio: AM (P = 2.3E−05), YM (P = 6.5E−03); Neutrophils-number: AM (P = 1.4E−04), YM (P = 0.03). c-kit+ neutrophils-ratio: AM (P = 6.74E−03), YM (P = 0.93); c-kit+ neutrophils-number: AM (P = 1.8E−03), YM (P = 0.08). Significance was determined using unpaired two-tailed Student’s t test. *P < 0.05, **P < 0.01, ***P < 0.001, ****P < 0.0001, ns P > 0.05. Source data are provided as a Source Data file.
Fig. 5
Fig. 5. Neutrophils inhibited the proliferation of CD8+ T cells through Arg2 in aged tumor-bearing mice.
a Heatmap showing representative GO terms of neutrophils across AC, YC, AM and YM groups, calculated by GSVA packages. Color key from white to red indicates expression levels from low to high. b Feature plots showing the expression levels Arg2 in neutrophils between AM and YM groups based on scRNA-seq. Arg2 arginase 2. MFI of Arg2 in neutrophils of lung (c) and bone marrow (d) from AM/YM groups, which were measured by flow cytometry, gated on CD45+CD11B+LY6G+ cells. FMO fluorescence minus one control. Each group contains six mice. Data expressed as MFI of Arg2 (mean ± SD). P = 1.0E−04 (c), P = 1.3E−03 (d). Significance was determined using unpaired two-tailed Student’s t test. ***P < 0.001. The expression of the Arg2 protein in serum (e) and supernatants from the neutrophil culture medium (f) was measured using enzyme-linked immunosorbent assay. Neutrophils were cultured 2 days for its supernatants collection. Each group contains nine mice. Data expressed as the concentration of Arg2 (mean ± SD). e YC-AC (P = 7.7E−03), YM-AM (P = 7.0E−05). f YC-AC (P = 0.02), AC-AM (P = 9.1E−05), YM-AM (P = 8.4E−07). Significance was determined using one-way ANOVA. *P < 0.05, **P < 0.01, ****P < 0.0001, ns P > 0.05. g The experimental workflow of neutrophils co-culture with CD8+ T cells. Each image was drawn by PaintTool SAI (version 1.2) and Adobe Illustrator 2023 (version 27.0). Proportions of Ki67+CD8+ T cells (h) and PD-1+CD8+ T cells (i) in the co-culture system were measured by flow cytometry, gated on CD45+CD8+ cells. BEC an Arg2 inhibitor, Neu neutrophil. Each group contains nine mice. Data expressed as % of Ki67+CD8+ or PD-1+CD8+ cells (mean ± SD). h Neu-YM vs. Neu-AM (P = 6.1E−05), Neu-AM vs. Neu-AM + BEC (P = 9.6E−04); i Neu-YM vs. Neu-AM (P = 4.0E−04), Neu-YM + BEC vs. Neu-AM + BEC (P = 2.6E−04). Significance was determined using one-way ANOVA. ***P < 0.001, ****P < 0.0001, ns P > 0.05. Source data are provided as a Source Data file.
Fig. 6
Fig. 6. Neutrophils of aged male mice suppress the stemness of CD8+ T cells.
Representative images and quantitative results of lung metastases in aged (a) and young (b) mice with anti-Ly6G or isotype (control) treated. Each group contains six mice. Data expressed as mean ± SD. P = 8.3E−03 (a), P = 0.63 (b). Significance was determined using an unpaired two-tailed Student’s t test. **P < 0.01, ns P > 0.05. c Heatmap showing representative GO terms and pathways of CD8+ T cells across AC, YC, AM, and YM groups, calculated by GSVA packages. The color key from white to red indicates expression levels from low to high. d MFI of TCF1 in lung CD8+ T cells from AM/AM-anti-Ly6G groups, which were measured by flow cytometry, gated on CD45+CD8+ cells. Each group contains six mice. Data expressed as MFI of TCF1 (mean ± SD). P = 4.7E−03. Significance was determined using an unpaired two-tailed Student’s t test. **P < 0.01. Flow plots showing the proportions of Ki67+ (e), CD62L+CD44− (f), PD-1+Tim3+ (g), TNF+IFN-γ+ (h), GZMB+CD107a+ (i) in lung CD8+ T cells from AM anti-Ly6G/control groups measured by flow cytometry, gated on CD45+CD8+ cells. Each group contains six mice. Data expressed as % of Ki67+CD8+, CD62L+CD44-CD8+, PD-1+Tim3+CD8+, TNF+IFN-γ+CD8+, GZMB+CD107a+CD8+ cells (mean ± SD). P = 0.01 (e), P = 9.7E−03 (f), P = 0.01 (g), P = 0.02 (h), P = 0.03 (i), P = 8.6E−03 (k). Significance was determined using an unpaired two-tailed Student’s t test. *P < 0.05, **P < 0.01. j UMAP plot of CD8+ T cells subsets from AM and YM groups, and stacked column chart showing the ratio of Stem cell like (PD-1+TCF1+TIM3−) and Exhausted (PD-1+TCF1-TIM3+) CD8+ T cells in AM and YM groups, based on scRNA-seq. The total population is the sum of stem cell-like and exhausted CD8+ T cells. k Flow plot showing the proportions of Stem cell like CD8+ T cells in lungs from AM anti-Ly6G/control groups measured by flow cytometry, gated on CD45+CD8+PD-1+ cells. Each group contains six mice. Data expressed as % of stem cell like cells (mean ± SD). Significance was determined using an unpaired two-tailed Student’s t test. **P < 0.01. Source data are provided as a Source Data file.
Fig. 7
Fig. 7. Procyanidin C1 could reverse the tumor-promoting effect of aging.
Four groups, AC mice, AM mice, and AM mice with PCC1 or solvent-treated group, were involved in this part. Each group contains six mice. AM mice were injected PCC1 or solvent from 16 months old. The tumor model was not constructed till 20 months old. PCC1 procyanidin C1. Representative images (a) and HE staining (b) results of lung metastases. Data expressed as number of metastases (mean ± SD). P = 2.2E−03 (a), P = 6.0E−04 (b). Significance was determined using an unpaired two-tailed Student’s t test. **P < 0.01, ***P < 0.001. Scale bars: 100 mm (a), 200 um (b). Proportions of γδT cells (c), γδ17 cells (d), and neutrophils (e) in the lung measured by flow cytometry, gated on CD45+ cells, CD45+CD3+γδTCR+ cells, and CD45+ cells, respectively. Data expressed as % of γδT cells, γδ17 cells, and neutrophils (mean ± SD). c AC-AM (P = 3.1E−03), AC-AM control (P = 7.7E−04), AM-AM PCC1 (P = 6.5E−05), AM control-AM PCC1 (P = 1.7E−05). d AC-AM (P = 1.5E−04), AC-AM control (P = 6.7E−06), AM-AM PCC1 (P = 4.4E−04), AM control-AM PCC1 (P = 1.8E−05). e AC-AM (P = 3.8E−03), AC-AM control (P = 3.5E−03), AM-AM PCC1 (P = 3.9E−03), AM control-AM PCC1 (P = 3.6E−03). Significance was determined using one-way ANOVA. **P < 0.01, ****P < 0.0001, ns P > 0.05. MFI of CXCR4 (f) and CD62L (g) in lung neutrophils measured by flow cytometry, gated on CD45+CD11B+LY6G+ cells. Data expressed as MFI of CXCR4 and CD62L (mean ± SD). f AC-AM (P = 5.0E−03), AC-AM control (P = 5.6E−04), AM-AM PCC1 (P = 0.01), AM control-AM PCC1 (P = 1.2E−03). g AM-AM PCC1 (P = 1.8E−03), AM control-AM PCC1 (P = 2.0E−03). Significance was determined using one-way ANOVA. *P < 0.05, **P < 0.01, ns P > 0.05. MFI of SA-β-gal in γδT (h) and neutrophils (i) in lungs measured by flow cytometry, gated on CD45+CD3+γδTCR+ or CD45+CD11B+LY6G+ cells. Each group contains six mice. Data expressed as MFI of SA-β-Gal (mean ± SD). P = 1.0E−03 (h), P = 0.02 (i). Significance was determined using unpaired two-tailed Student’s t test. ***P < 0.001, **P < 0.05. Source data are provided as a Source Data file.

Similar articles

Cited by

References

    1. Fane, M. & Weeraratna, A. T. Normal aging and its role in cancer metastasis. Cold Spring Harb. Perspect. Med. 10, a037341 (2020). - PMC - PubMed
    1. Siegel, R. L., Miller, K. D., Fuchs, H. E. & Jemal, A. Cancer statistics, 2022. CA Cancer J. Clin.72, 7–33 (2022). - PubMed
    1. López-Otín, C., Pietrocola, F., Roiz-Valle, D., Galluzzi, L. & Kroemer, G. Meta-hallmarks of aging and cancer. Cell Metab.35, 12–35 (2023). - PubMed
    1. Fane, M. & Weeraratna, A. T. How the ageing microenvironment influences tumour progression. Nat. Rev. Cancer20, 89–106 (2020). - PMC - PubMed
    1. López-Otín, C., Blasco, M. A., Partridge, L., Serrano, M. & Kroemer, G. The hallmarks of aging. Cell153, 1194–1217 (2013). - PMC - PubMed

Publication types

MeSH terms

Substances