

Infrared thermal modulation endoscopy for label-free tumor detection
- PMID: 39738048
- PMCID: PMC11685564
- DOI: 10.1038/s41598-024-76173-8
Infrared thermal modulation endoscopy for label-free tumor detection
Abstract
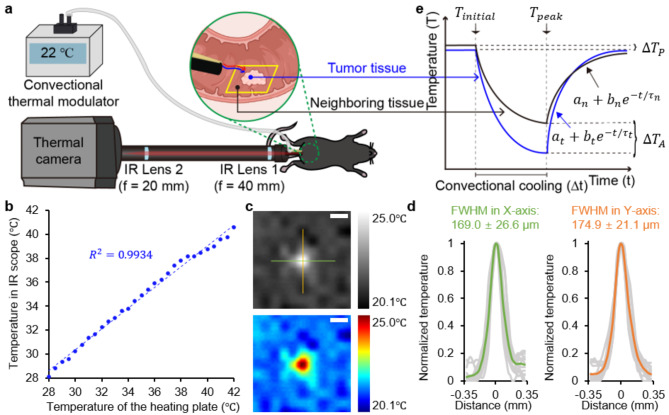
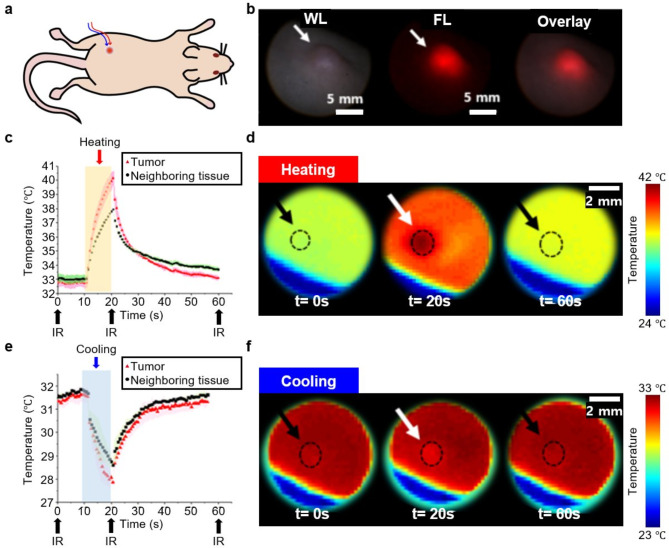
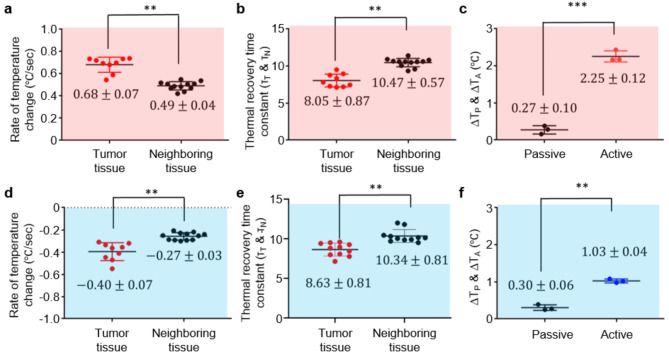
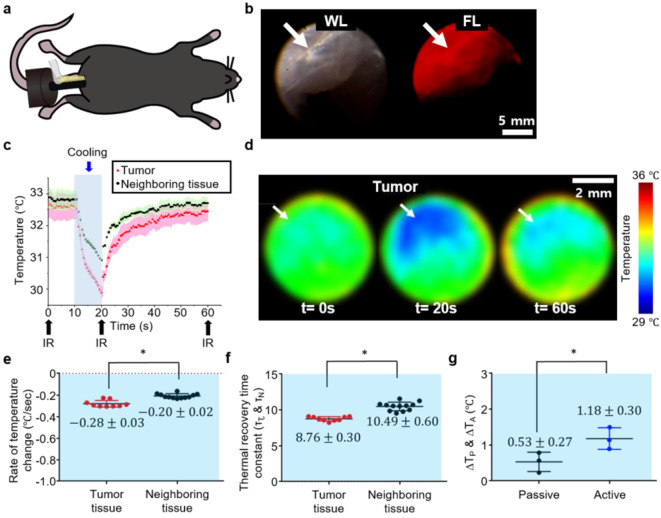
In optical imaging of solid tumors, signal contrasts derived from inherent tissue temperature differences have been employed to distinguish tumor masses from surrounding tissue. Moreover, with the advancement of active infrared imaging, dynamic thermal characteristics in response to exogenous thermal modulation (heating and cooling) have been proposed as novel measures of tumor assessment. Contrast factors such as the average rate of temperature changes and thermal recovery time constants have been investigated through an active thermal modulation imaging approach, yielding promising tumor characterization results in a xenograft mouse model. Here, to assess its clinical potential, we developed and deployed an endoscopic infrared thermal modulation imaging system, incorporating anti-reflection germanium lenses. Employing tissue cooling, we evaluated the feasibility of detecting in situ tumors in a syngeneic rectal tumor mouse model. Consequently, early-stage tumors were successfully localized and evaluated based on their heat signatures. Notably, tumors exhibited a higher rate of temperature change induced by thermal modulation compared to adjacent tissues. Through the introduction of this label-free technology, Infrared Thermal Modulation Endoscopy (ITME), our study showcased an effective method for optically delineating and assessing solid tumors. This innovative diagnostic technology holds significant promise for enhancing our ability to detect, classify, and characterize abnormal tissues.
Keywords: Infrared imaging; Rectal tumor model; Thermal contrast; Thermal endoscopy; Thermal modulation; Tumor detection.
© 2025. The Author(s).
Conflict of interest statement
Declarations. Competing interests: The authors declare no competing interests. Supplementary information: See Supplement file 1 for supporting content.
Figures
Similar articles
-
Active thermodynamic contrast imaging for label-free tumor detection in a murine xenograft tumor model.Biomed Opt Express. 2017 Oct 16;8(11):5013-5026. doi: 10.1364/BOE.8.005013. eCollection 2017 Nov 1. Biomed Opt Express. 2017. PMID: 29188098 Free PMC article.
-
A Novel Theranostic Combination of Near-infrared Fluorescence Imaging and Laser Irradiation Targeting c-KIT for Gastrointestinal Stromal Tumors.Theranostics. 2018 Mar 21;8(9):2313-2328. doi: 10.7150/thno.22027. eCollection 2018. Theranostics. 2018. PMID: 29721082 Free PMC article.
-
Molecular Fluorescence Endoscopy Targeting Vascular Endothelial Growth Factor A for Improved Colorectal Polyp Detection.J Nucl Med. 2016 Mar;57(3):480-5. doi: 10.2967/jnumed.115.166975. Epub 2015 Dec 17. J Nucl Med. 2016. PMID: 26678613
-
Recent advances in near-infrared II imaging technology for biological detection.J Nanobiotechnology. 2021 May 10;19(1):132. doi: 10.1186/s12951-021-00870-z. J Nanobiotechnology. 2021. PMID: 33971910 Free PMC article. Review.
-
Label-Free Optical Technologies to Enhance Noninvasive Endoscopic Imaging of Early-Stage Cancers.Annu Rev Anal Chem (Palo Alto Calif). 2024 Jul;17(1):289-311. doi: 10.1146/annurev-anchem-061622-014208. Epub 2024 Jul 2. Annu Rev Anal Chem (Palo Alto Calif). 2024. PMID: 38424030 Review.
References
-
- López-Gómez, M., Malmierca, E., de Górgolas, M. & Casado, E. Cancer in developing countries: the next most preventable pandemic. The global problem of cancer. Critical reviews in oncology/hematology 88, 117–122 (2013). - PubMed
-
- Song, C. et al. Thermographic assessment of tumor growth in mouse xenografts. Int. J. Cancer. 121, 1055–1058 (2007). - PubMed
Publication types
MeSH terms
Grants and funding
LinkOut - more resources
Full Text Sources
