. 2024 Dec 30;15(1):10839.
doi: 10.1038/s41467-024-55147-4.

SEAD reference panel with 22,134 haplotypes boosts rare variant imputation and genome-wide association analysis in Asian populations

Affiliations

SEAD reference panel with 22,134 haplotypes boosts rare variant imputation and genome-wide association analysis in Asian populations

Meng-Yuan Yang et al. Nat Commun. .

Abstract

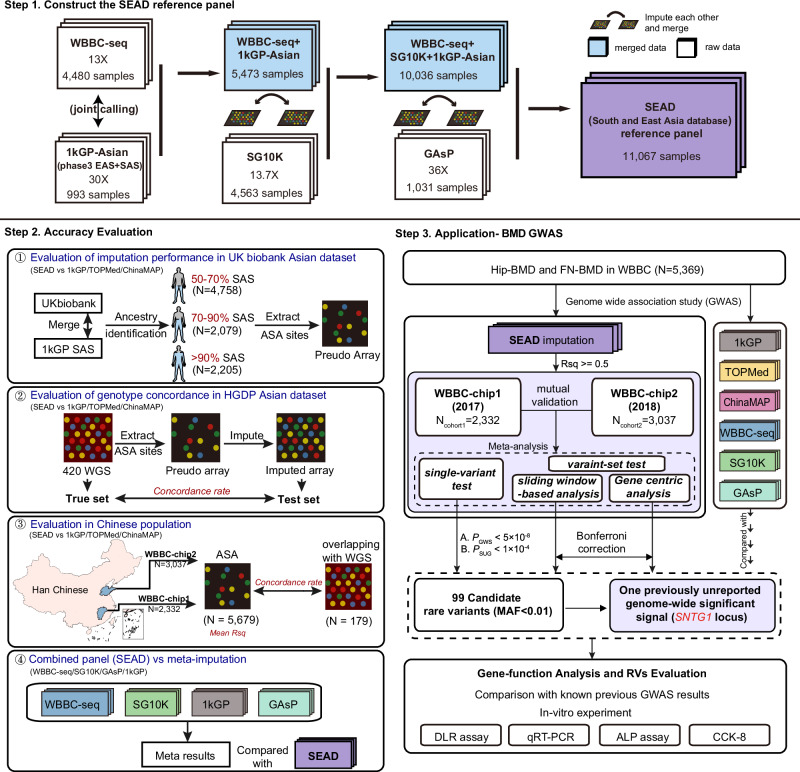
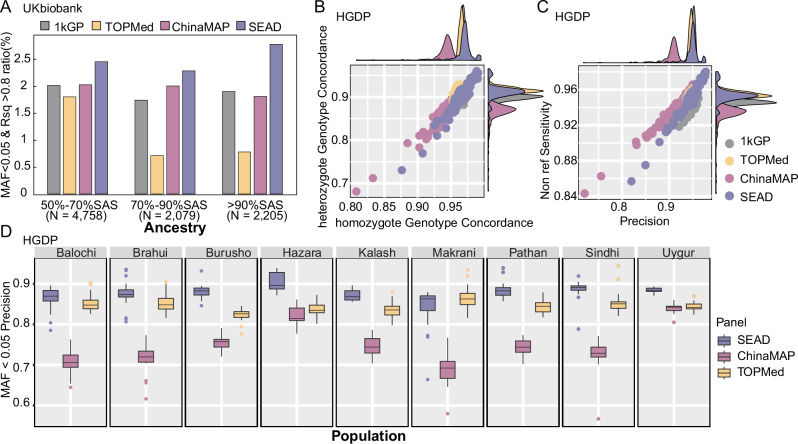
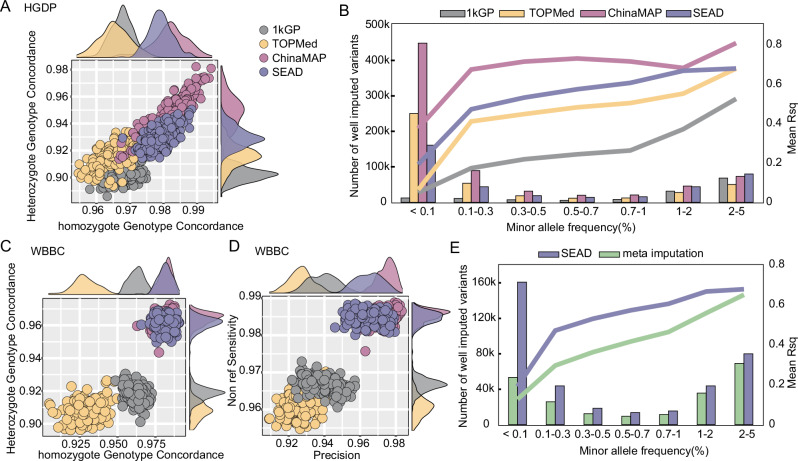
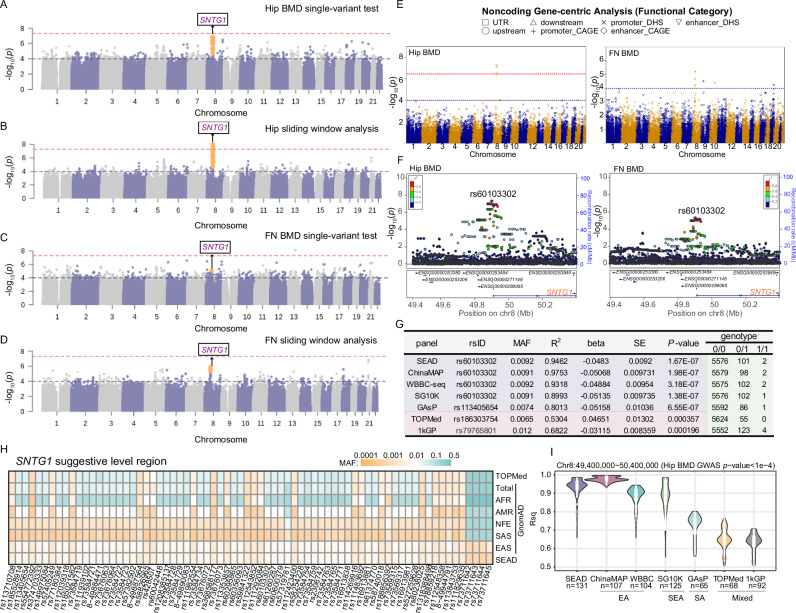
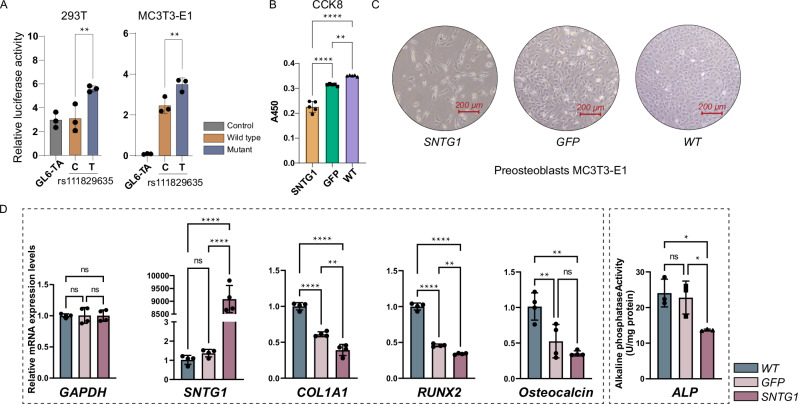
Limited whole genome sequencing (WGS) studies in Asian populations result in a lack of representative reference panels, thus hindering the discovery of ancestry-specific variants. Here, we present the South and East Asian reference Database (SEAD) panel ( https://imputationserver.westlake.edu.cn/ ), which integrates WGS data for 11,067 individuals from various sources across 17 Asian countries. The SEAD panel, comprising 22,134 haplotypes and 88,294,957 variants, demonstrates improved imputation accuracy for South Asian populations compared to 1000 Genomes Project, TOPMed, and ChinaMAP panels, with a higher proportion of well-imputed rare variants. For East Asian populations, SEAD shows concordance comparable to ChinaMAP, but outperforming TOPMed. Additionally, we apply the SEAD panel to conduct a genome-wide association study for total hip (Hip) and femoral neck (FN) bone mineral density (BMD) traits in 5369 genotyped Chinese samples. The single-variant test suggests that rare variants near SNTG1 are associated with Hip BMD (rs60103302, MAF = 0.0092, P = 1.67 × 10⁻⁷), and variant-set analysis further supports the association (Pslide_window = 9.08 × 10⁻⁹, Pgene_centric = 5.27 × 10⁻⁸). This association was not reported previously and can only be detected by using Asian reference panels. Preliminary in vitro experiments for one of the rare variants identified provide evidence that it upregulates SNTG1 expression, which could in turn inhibit the proliferation and differentiation of preosteoblasts.


Conflict of interest statement

Competing interests: S.-H.Y., W.-W.Z. and J.-Q.L. Y.S. are employee of KingMed Diagnostics Co., Ltd. The other authors have no competing interests to declare.

Figures

Fig. 1
Fig. 1. Study design.
Step 1, the construction process of the SEAD reference panel, we conducted SNP calling and joint calling to merge WBBC-seq (4480 samples) and 1kGP-Asian (993 samples, EAS + SAS) datasets by using DeepVariants and GLnexus, then imputed and merged the obtained panel with SG10K and GAsP panels successively by reciprocal imputation. Finally, the SEAD panel contained 11,067 samples with 88,294,957 variants. Step 2, the imputation performance was compared between SEAD panel and other panels (1kGP, TOPMed, ChinaMAP) in South Asian and East Asian populations, and between meta imputation and combined panel. The human characters in the plot are designed by Freepik (https://www.freepik.com/). Step 3, the application of SEAD reference panel in FN and Hip BMD GWAS analyses.
Fig. 2
Fig. 2. The imputation performance in imputing Central and South Asian populations.
A the ratio of well imputed low-frequency (MAF < 0.05) variants with SEAD, 1kGP, TOPMed, ChinaMAP panels in samples with 50–70%, 70–90% and >90% SAS ancestry composition from UKbiobank. B Non-reference allele (NR-allele) concordance rate distribution (imputed variants vs. WGS variants) in 197 Central and South Asian samples from HGDP. Each dot represents an individual. The plots on the top and right are the corresponding density distributions. C No-ref specificity and precision (imputed variants vs. WGS variants) in 197 Central and South Asian samples from HGDP. The plots on the top and right are the corresponding density distributions. D Precision of low-frequency (MAF < 0.05) variants in 9 Central and South populations from HGDP. The sample sizes for each population group are as follows: Balochi (n = 24), Brahui (n = 25), Burusho (n = 24), Hazara (n = 19), Kalash (n = 22), Makrani (n = 25), Pathan (n = 24), Sindhi (n = 24), and Uygur (n = 10). Box plots indicate median (middle line), 25th, 75th percentile (box) and 1.5 times the inter-quartile range from the first and third quartiles (whiskers) as well as outliers (single points). All calculation performed on chromosome 2.
Fig. 3
Fig. 3. The imputation performance in imputing East Asian populations.
A Non-reference allele (NR-allele) concordance rate distribution (imputed variants vs. WGS variants) in 223 East Asian samples from HGDP. Each dot represents an individual. The plots on the top and right are the corresponding density distributions. B The average imputed r-square (Rsq) (line plot) and number of well-imputed (Rsq > 0.8) variants (bar plot) of four reference panels among 7 MAF bins including <0.1%, 0.1%–0.3%, 0.3%–0.5%, 0. 5%–0.7%, 0.7%–1%, 1%-2%, and 2%–5%. C Non-reference allele (NR-allele) concordance rate distribution (imputed variants vs. WGS variants) in 179 overlapping samples (both sequenced in WBBC-seq and genotyped in WBBC-chip). Each dot represents an individual. The plots on the top and right are the corresponding density distributions. D Non-reference specificity and precision (imputed variants vs. WGS variants) in 179 overlapping samples. The plots on the top and right are the corresponding density distributions. E The average Rsq (line plot) and number of well-imputed (Rsq > 0.8) variants (bar plot) of SEAD reference panel and meta imputation with 1kGP, WBBC-seq, SG10K and GAsP among 7 MAF bins including <0.1%, 0.1%–0.3%, 0.3%–0.5%, 0.5%–0.7%, 0.7%–1%, 1%–2%, and 2%–5%. All evaluations conducted on chromosome 2.
Fig. 4
Fig. 4. Detecting rare locus of Hip and FN BMD in GWAS.
A, C Meta results of the single-variant test of Hip and FN BMD. The P-value of significance threshold of 5 × 10−8 delineated by red lines, while the P-value of significance threshold of 1 × 10−4 delineated by blue lines. B, D The sliding window analysis of Hip and FN BMD. The P-value of significance threshold of 5 × 10−8 delineated by red lines, while the P-value of significance threshold of 3.55 × 10−8 (0.05/1,400,000) delineated by blue lines. The SNTG1 gene can be detected by four approaches and labeled with a rectangle. E Noncoding Gene-centric analysis of Hip and FN BMD. F Locuszoom plots of SNTG1 gene in Hip and FN BMD single-variant test imputed by SEAD panel. The most significant SNP is rs60103302 at the SNTG1 locus. SNPs were plotted based on their GWAS −log10 (P-values) and genomic position. The color scale of r2 values is used to label SNPs based on their degree of linkage disequilibrium with the most significant SNP. Recombination rates calculated from SEAD reference data are also displayed in a blue line corresponding to the right vertical axis. G Information of top associated SNPs with Hip BMD in single-variant test imputed by seven panels. H SNP frequency comparison in SNTG1 gene regions. The databases contained TOPMed and GnomAD. I Violin plot of Rsq distribution in all GWAS P-value < 1 × 10−4 variants imputed by seven reference panels. Box plots indicate median (middle line), 25th, 75th percentile (box) and 1.5 times the inter-quartile range from the first and third quartiles (whiskers) as well as outliers (single points).
Fig. 5
Fig. 5. Preliminary in vitro analysis of SNTG1 gene on osteogenesis.
A The impact of rs111829635 alleles C and T on the expression of SNTG1 in 293 T and MC3T3-E1 cells. n = 3. The statistic test is T-test. B, C The overexpression of SNTG1 alone inhibits cell proliferation. n = 5. The statistic test is one-way anova in (B). D The overexpression of SNTG1 inhibits cell differentiation. with COL1A1, RUNX2, and Osteocalcin serving as indicators of cell differentiation. n = 4. ALP refers to alkaline phosphatase. n = 3. The statistic test is one-way anova in D. Data are presented as mean + standard deviation (SD). P-values are two-sided and adjustments were not made for multiple comparisons. *P < 0.05; ** P < 0.01; ***P < 0.001; **** P < 0.0001. Source data are provided as a Source Data file.

Similar articles

Cited by

References

    1. Mahajan, A. et al. Fine-mapping type 2 diabetes loci to single-variant resolution using high-density imputation and islet-specific epigenome maps. Nat. Genet50, 1505–1513 (2018). - PMC - PubMed
    1. Zheng, H. F. et al. Meta-analysis of genome-wide studies identifies MEF2C SNPs associated with bone mineral density at forearm. J. Med. Genet.50, 473–478 (2013). - PMC - PubMed
    1. Zhu, X. W. et al. Comprehensive assessment of the association between FCGRs polymorphisms and the risk of systemic lupus erythematosus: evidence from a meta-analysis. Sci. Rep.6, 31617 (2016). - PMC - PubMed
    1. Hoffmann, T. J. et al. Imputation of the rare HOXB13 G84E mutation and cancer risk in a large population-based cohort. PLoS Genet11, e1004930 (2015). - PMC - PubMed
    1. Handsaker, R. E. et al. Large multiallelic copy number variations in humans. Nat. Genet47, 296–303 (2015). - PMC - PubMed

Publication types

LinkOut - more resources