. 2024 Dec 30;15(1):10888.
doi: 10.1038/s41467-024-55248-0.

INSIHGT: an accessible multi-scale, multi-modal 3D spatial biology platform

Affiliations

INSIHGT: an accessible multi-scale, multi-modal 3D spatial biology platform

Chun Ngo Yau et al. Nat Commun. .

Abstract

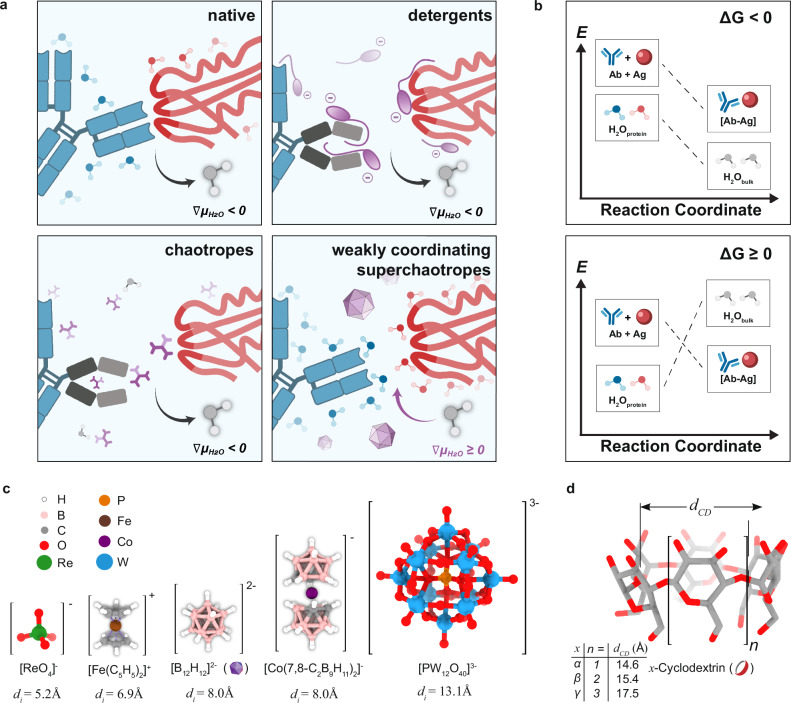
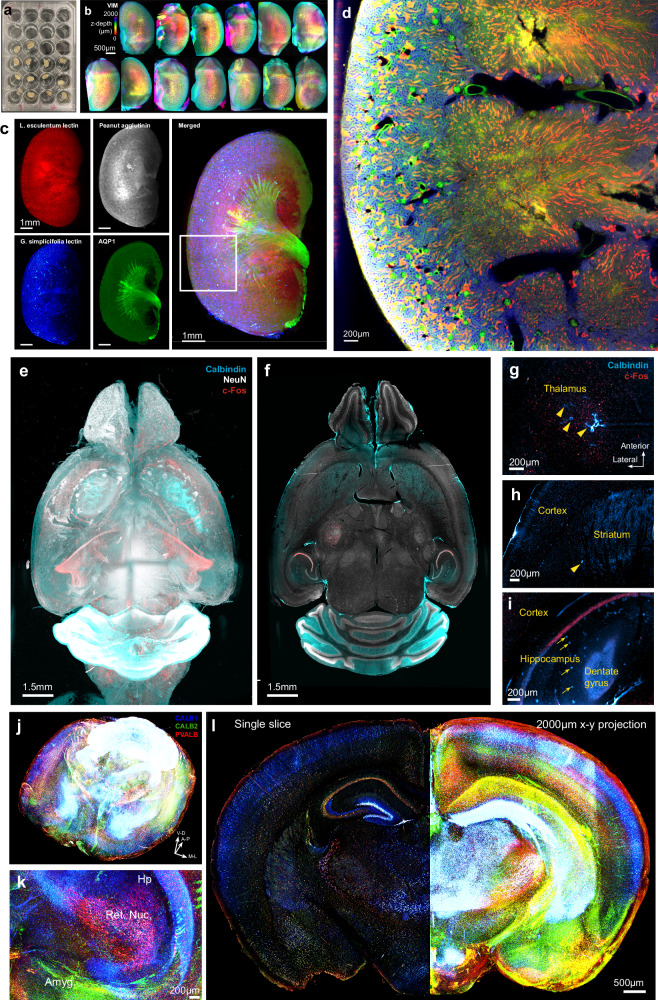
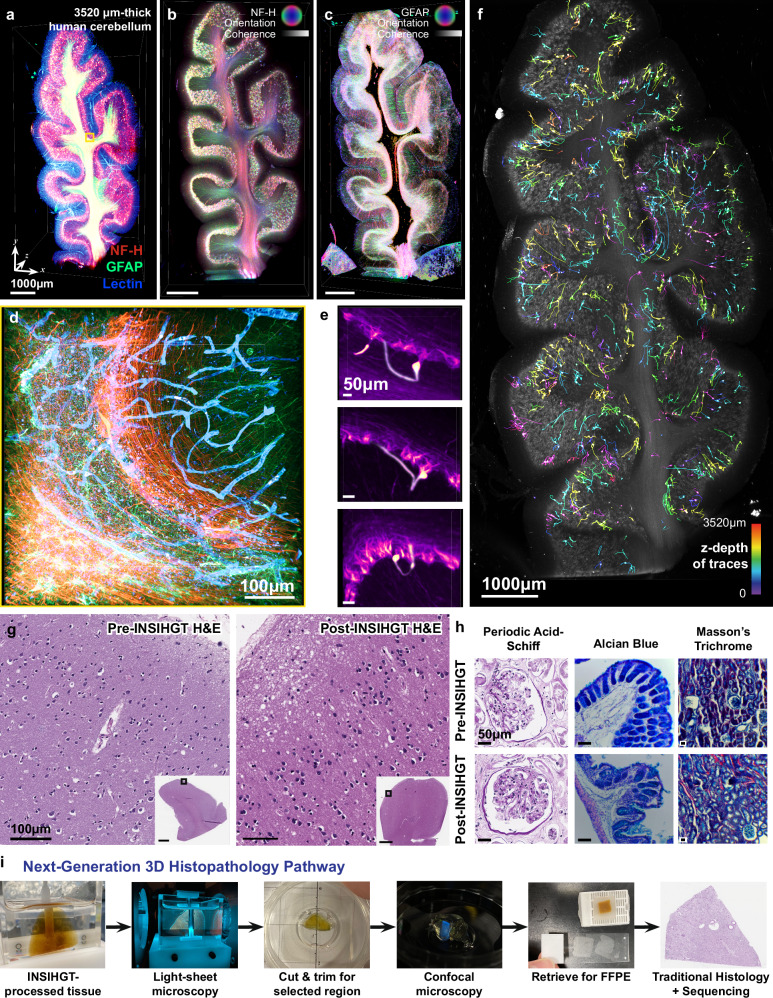
Biological systems are complex, encompassing intertwined spatial, molecular and functional features. However, methodological constraints limit the completeness of information that can be extracted. Here, we report the development of INSIHGT, a non-destructive, accessible three-dimensional (3D) spatial biology method utilizing superchaotropes and host-guest chemistry to achieve homogeneous, deep penetration of macromolecular probes up to centimeter scales, providing reliable semi-quantitative signals throughout the tissue volume. Diverse antigens, mRNAs, neurotransmitters, and post-translational modifications are well-preserved and simultaneously visualized. INSIHGT also allows multi-round, highly multiplexed 3D molecular probing and is compatible with downstream traditional histology and nucleic acid sequencing. With INSIHGT, we map undescribed podocyte-to-parietal epithelial cell microfilaments in mouse glomeruli and neurofilament-intensive inclusion bodies in the human cerebellum, and identify NPY-proximal cell types defined by spatial morpho-proteomics in mouse hypothalamus. We anticipate that INSIHGT can form the foundations for 3D spatial multi-omics technology development and holistic systems biology studies.


Conflict of interest statement

Competing interests: C.U.H.K. filed a patent application in part based on the invention described in this paper with H.M.L. and C.N.Y. as the inventors. The associated patent, owned by C.U.H.K., was exclusively licensed to Illumos Limited, of which H.M.L. is a co-founder. The remaining authors declare no competing interests.

Figures

Fig. 1
Fig. 1. INSIHGT conceptualization and key components.
a, b Reconceptualization of the biomolecular binding phenomena. a Microscopic view. Native antibody-antigen binding (left upper, in an aqueous medium) requires the desolvation of their solvation shells (∇μH2O < 0). Detergents (right upper) and chaotropes (left lower) solubilize proteins by masking binding sites (and displacing the solvent shell), but they may lead to protein denaturation in high concentrations (black arm of the antibody). Weakly coordinating superchaotropes (right lower, WCS, e.g., [B12H12]2-) instead solubilizes proteins by favoring solvent-protein interactions (∇μH2O ≥ 0), striking a balance between protein solubilization and stabilization. Created with Biorender.com. b Energetic view. Antibody-antigen binding without WCS (upper panel), occurs spontaneously with ΔGtot < 0, while with WCA (bottom panel), is unfavorable with ΔGtot ≥ 0. Created with Biorender.com. c Structures and ionic diameters (di) of weakly coordinating ions tested. d General structure of cyclodextrins and their cavity opening diameter (dCD).
Fig. 2
Fig. 2. Homogeneous and deep staining with INSIHGT.
a Experimental steps and principle of INSIHGT for immunostaining. Top row: Tissue is infiltrated with antibodies and a weakly coordinating superchaotrope ([B12H12]2-, purple dodecahedron) in the 1st staining solution and then transferred into the 2nd solution containing a complexation agent (CD, red ring). Bottom row: The molecular principles of INSIHGT. Weakly coordinating superchaotropes prevents antibody-antigen interactions, removing penetration obstacles. After homogeneous infiltration, subsequent γCD infiltration complexes the [B12H12]2- ions, allowing deep tissue immunostaining. Reproduced with permission from Illumos Limited. b Benchmark results of four buffers used in deep immunostaining. Enlarged views of smaller areas are shown in insets. Parvalbumin (PVALB) immunostaining signals on cut surface: magenta, bulk-staining signal; green: cut-staining PVALB signal (refer to Supplementary Fig. 1). c Quantification of bulk:cut-staining signal ratio against penetration distance for segmented cells. Each dot represents a cell. Lines are single-term exponential decay regression curves. The signal decay distance constants (τ) are shown in Supplementary Table 1. Hypothetical ideal method performance is shown as a gray line (τ→0+). d Correlation of INSIHGT signal with reference (cut-staining intensity) signal, illustrating 3D quantitative immunostaining. r: Pearson correlation coefficient. e Timeline illustration for a whole mouse brain processing experiment with the different benchmarked methods (drawn to scale). *indicates methods where in principle the use of secondary antibody Fab fragments can lead to halved immunostaining times.
Fig. 3
Fig. 3. High-throughput whole-organ deep immunostaining with dense mapping using INSIHGT.
a Parallelized sample processing with INSIHGT, exemplified with whole mouse kidneys. b Whole organ imaging results with parallelized INSIHGT for the samples shown in (a), showing vimentin INSIHGT signals color-coded by z-depth. One sample was dropped due to manual errors. c,d Whole mouse kidney densely multiplexed visualization with Lycopersicon esculentum lectin (red), Peanut agglutinin (gray), Griffonia simplicifolia lectin I (blue), and AQP-1 (green). d Enlarged 2D view of the white boxed area in (c). e, f Rendered view of whole mouse brain multiplexed Calbindin, NeuN, and c-Fos mapping of a 3-year-old mouse. gi Age-related structural and molecular changes in the thalamus (g) and striatum (h) with cavitations (indicated by yellow arrowheads), and the hippocampus (i) with CALB1-positive deposits (indicated by yellow arrows). j Whole brain multiplexed staining of the calcium-binding proteins calbindin (CALB1), calretinin (CALB2), and parvalbumin (PVALB) with 3 days of INSIHGT staining. k Zoomed in 3D rendering view on the hippocampus (Hp), reticular nucleus of thalamus (Ret. Nuc.), and amygdala (Amyg.). l A single coronal slice view (left) and a 2 mm-thick anteroposterior projection (right) of the same sample.
Fig. 4
Fig. 4. Multi-modality INSIHGT for generality.
a Number of validated antibodies compatible with each benchmarked method. bd INSIHGT’s compatibility in revealing the 3D location of various features. b Epigenetic markers based on histone post-translational modifications and isoforms. c Neurotransmitters. LC: locus ceruleus. d Structural features, using one-step multiplexed supramolecular histochemistry, multiplexed supramolecular lectin histochemistry, and the supramolecular dye complex [PO-PRO1⊂SBEβCD]. e Nucleic acid probe (NAP, DAPI structure shown) complexation by SBEβCD for improved tissue penetration. f Thermodynamic scheme of NAP’s complexation reaction with SBEβCD. SBEβCD neither redissolves DAPI/[B12H12]2- precipitates nor precipitates DAPI out from the [DAPI⊂SBEβCD] complex, suggesting kinetic stabilization. g Quantification of penetration depths of [DAPI⊂SBEβCD] compared to traditional DAPI staining. h Multimodal 3D molecular phenotyping in a 1 mm-thick mouse cerebellum slice for proteins (CNP1), nucleic acids (car8, DAPI), epigenetic modifications (H3K27 acetylation), and glycosylations ([GlcNAc]1-3) with INSIHGT. Imaging was limited to 200 μm due to working distance constraints.
Fig. 5
Fig. 5. Centimeter-scale INSIHGT.
a A human cortex block (1.5 cm × 1.5 cm × 3 cm), processed with INSIHGT and cut in the middle for confocal imaging to confirm penetration depth. b Confocal tiled image of the cut face from (a), stained with [DAPI⊂SBEβCD], G. simplicifolia lectin I (GSL-I), and for parvalbumin (PVALB). Inset: penetration depth over the imaging surface. c Enlarged view of the yellow boxed area in (b). d A human cerebellum tissue block (1.75 cm × 2.0 cm × 2.3 cm) processed with INSIHGT, stained with GSL-I lectin and NF-H. Inset: penetration depth over the imaging surface. e Illustrated tissue processing steps: tissue is stained for 7 days in INSIHGT buffer A (with [B12H12]2−), washed in INSIHGT buffer B (with 2HPγCD), and sliced perpendicular to the thinnest dimension at the midpoint. f Enlarged view of the yellow boxed area in (d). g T2-weighted magnetic resonance imaging (MRI) of a patient’s brain with dementia with Lewy bodies (DLB). A hemi-brainstem region spanning the pons to substantia nigra was stained for phosphorylated α-synuclein at serine 129 (αSyn-pS129). h αSyn-pS129 staining intensity color-coded in z-depth. Inset shows the specimen photograph. LC: locus ceruleus complex, IC inferior colliculus, RN red nucleus, SC superior colliculus, SN substantia nigra. i Zoomed-in view of the yellow boxed area showing Lewy neurites (arrow) and Lewy bodies (triangle).
Fig. 6
Fig. 6. Multi-round multiplexed INSIHGT.
a Schematics of the processing steps for a 1mm-thick mouse hypothalamus sample. b A selection of multi-round immunostaining signals (for nine targets) displayed for the multi-round multiplexed INSIHGT-processed sample. c Enlarged view of the yellow boxed area in (b) with a complementary panel of markers. d Schematics of the image analysis process. e Illustrated results of a segmented image subset. The images below show corresponding cell segmentation and quantification results. f Left panel: Nested UMAP embedding of all segmented cells from both tiles of the image stack. Middle panel: The spatial locations of the different color-coded clusters. Right panel: Similar to the middle panel but with cellular morphology. g Color-coded z-projection of neuropeptide Y (NPY) staining signals. A higher magnification view for the left white boxed area is shown in the inset. h Schematic representation of distance measurement from NPY fibers to cell bodies via distance transformation. Created with Biorender.com. i NPY signal in a periventricular region (right white boxed area in g) is shown in the left panel, and with selected markers staining in the right panel. j Quantification of distance from NPY-expressing fibers for each cell type shown in violin plots, based on the 3D spatial locations of somas and NPY fibers.
Fig. 7
Fig. 7. INSIHGT reveals previously undescribed intercellular filaments traversing the Bowman space in mouse kidneys.
a Original image of multiplexed image of whole mouse glomerulus with full Bowman capsule. WGA Wheat germ agglutinin, PHA-E Phaseolus vulgaris hemagglutinin, GSL-I Griffonia simplicifolia lectin I. b Segmentation of microfilaments with en bloc preservation of native morphologies and spatial relationships in 3D Euclidean space. c Global representation of the 3D spatial distribution of microfilaments across the entire Bowman space. d Distinct and protean morphologies of the podocyte-to-parietal epithelial cell (PEC) microfilaments. e Schematic representation of reachers (contacting PEC surface) and stayers (remaining in the Bowman space) originating from podocyte surfaces with the related physical parameters. f Descriptive statistics of microfilament subtypes per analyzed glomeruli. N = 14 glomeruli analyzed across four mice (where three mice has four glomeruli imaged, one mouse has two glomeruli imaged, and the results were plotted together). g Correlation between the path length of each microfilament and the geodesic distance between its podocytic attachment point and its nearest neighbor. The data points were color-coded based on their glomerulus of origin in the dataset. Source data are provided as a Source Data file.
Fig. 8
Fig. 8. INSIHGT enables non-destructive characterization and analysis of human clinical samples.
a A 3.5mm-thick human cerebellum triplex-stained for glial filaments (GFAP), neurofilament (NF-H) and blood vessels (G. simplicifolia lectin I). Orientation and coherence (or fractional anisotropy) visualization of neurofilament (b, NF-H) and glial filament (c, GFAP) via structure tensor analysis. d Enlarged view of the boxed area in a via post-hoc confocal microscopy. e Prototypical morphology of human cerebellar neurofilament inclusions, where their extensions may loop back to the Purkinje layer and occasionally to another inclusion body (lowest image). f Overview of the 1078 manually traced neurofilament inclusions across the cerebellar sample, color-coded by z-depth. Traditional 2D histology with special stains on pre-INSIHGT and post-INSIHGT processed samples. g H&E staining of human brain, h Left to right: Periodic acid-Schiff (PAS), Alcian blue, and Masson’s trichrome staining of human kidney, mouse colon, and mouse kidney sections respectively. i The Next-Generation Histopathology Pathway. INSIHGT is compatible with traditional histological pipelines, empowering a multi-pronged approach to maximizing the information extracted from clinical samples.

Similar articles

Cited by

References

    1. Moses, L. & Pachter, L. Museum of spatial transcriptomics. Nat. Methods19, 534–546 (2022). - PubMed
    1. Hickey, J. W. et al. Spatial mapping of protein composition and tissue organization: a primer for multiplexed antibody-based imaging. Nat. Methods19, 284–295 (2021). - PMC - PubMed
    1. Cho, W., Kim, S. & Park, Y.-G. Towards multiplexed immunofluorescence of 3D tissues. Mol. Brain16, 37 (2023). - PMC - PubMed
    1. Liu, J. T. C., Glaser, A. K., Poudel, C. & Vaughan, J. C. Nondestructive 3D pathology with light-sheet fluorescence microscopy for translational research and clinical assays. Annu. Rev. Anal. Chem.16, 231–252 (2023). - PubMed
    1. Richardson, D. S. et al. Tissue clearing. Nat. Rev. Methods Prim.1, 1–24 (2021). - PMC - PubMed

Publication types

LinkOut - more resources