The expression of CCL17 and potential prognostic value on tumor immunity in thyroid carcinoma based on bioinformatics analysis
- PMID: 39738081
- PMCID: PMC11686015
- DOI: 10.1038/s41598-024-75750-1
The expression of CCL17 and potential prognostic value on tumor immunity in thyroid carcinoma based on bioinformatics analysis
Abstract
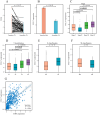
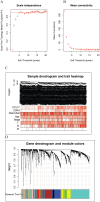
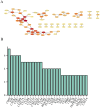
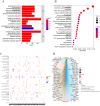
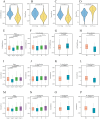
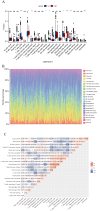
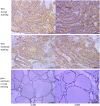
Although CCL17 has been reported to exert a vital role in many cancers, the related studies in the thyroid carcinoma have never reported. As a chemokine, CCL17 plays a positive role by promoting the infiltration of immune cells into the tumor microenviroment (TME) to influence tumor invasion and metastasis. Therefore, this study is aimed to investigate the association of CCL17 level with potential prognostic value on tumor immunity in the thyroid carcinoma (THCA) based on the bioinformatics analysis. GEPIA database was applied to analyze CCL17 mRNA expression in THCA data from TCGA database. Through the collection of the data, totally 500 tumor and 57 normal tissue samples were taken for the study. According to survival status and survival time in 500 tumor samples and CCL17 expression from RNA-seq data, all patients were categorized as high- expression (n = 64) and low-expression (n = 436) groups using X-tile program. Next, the association of CCL17 with survival in the thyroid carcinoma patients was examined by using the Kaplan-Meier plotter database. Then, weighted gene co-expression network (WGCNA) was employed to analyze the 1424 DEGs to classify 9 modules. Besides, STRING database was used to obtain the hub genes. GO and KEGG database were employed to explore blue module genes enrichment situations. In addition, TISIDB was used to analyze the relationship of CCL17 expression with tumor-infiltrating lymphocytes proportion, immunostimulators, and major histocompatibility complexes in THCA. The correlation of CCL17 with 22 TIIC subtypes was evaluated by ESTIMATE and CIBERSORT databases. The association of CCL17 level with gene marker of immune cells in THCA was analyzed by GEPIA and TIMER databases. Finally, immunohistochemistry was applied to validate CCL17 expression in 21 tumor and para-carcinoma tissue samples. CCL17 expression in tumors was significantly up-regulated relative to non-carcinoma samples. Patients from CCL17 high-expression group had significantly decreased overall survival compared with low-expression group, which has a significantly importantly potential prognostic value. Moreover, CCL17 and clinical characteristics were analyzed, suggesting that CCL17 expression significantly increased among patients of advanced stage, with advanced T classification, advanced N classification, and higher CCR4 expression. Based on WGCNA, expression of 1424 DEGs in blue module with 258 genes was negatively related to dismal survival and clinical lymph node metastasis in THCA patients. Moreover, CCR4 and CCL17 genes were identified as hub genes within blue module. CCL17 high-expression had greater ImmuneScore, StromalScore and ESTIMATEScore, while lower TumorPurity compared to the CCL17 low-expression. Then, GO and KEGG database were used to analyze blue module genes enrichment situations. The result showed that genes in blue module were associated with cytokine-cytokine receptor interaction, chemokine, and PI3K - Akt pathways. The results of tumor-infiltrating lymphocytes proportion, immunostimulators, and major histocompatibility complexes were significantly positive in CCL17 high-expression. Our findings showed that B cells naïve, T cells CD4 memory resting, T cells CD8, T cells regulatory (Tregs), and dendritic cells resting were the main immune components of THCA tumor microenvironment (TME). CCL17 high-expression in TC was significantly positively related to expression of immune cell gene markers. The result of immunohistochemistry demonstrated that CCL17 expression in tumor tissues significantly increased compared with para-carcinoma tissues. CCL17 high-expression was significantly positively associated with age and advanced N classification, suggesting that CCL17 could accelerate tumor progression by promoting the lymph node metastasis. CCL17 high-expression in THCA tumor microenvironment (TME) accelerates local infiltration of immune cells and enhances anticancer immunity, resulting in worse survival of patients and exerting potential prognostic value on tumor immunity in THCA.
Keywords: Biomarker; Chemokine CCL17; Prognosis; Thyroid papillary carcinoma.
© 2024. The Author(s).
Conflict of interest statement
Declarations. Competing interests: The authors declare no competing interests. Ethical approval: The studies involving human participants were reviewed and approved by the institutional ethics board of the Affiliated Hospital of Guizhou Medical University. The patients/participants provided their written informed consent to participate in this study. We confirm that all research was performed in accordance with relevant guidelines/regulations. Consent to publish: All authors consent to publish this paper.
Figures






Similar articles
-
Identification of disulfidptosis-associated genes and characterization of immune cell infiltration in thyroid carcinoma.Aging (Albany NY). 2024 Jun 4;16(11):9753-9783. doi: 10.18632/aging.205897. Epub 2024 Jun 4. Aging (Albany NY). 2024. PMID: 38836761 Free PMC article.
-
Chemokine CCL17 Affects Local Immune Infiltration Characteristics and Early Prognosis Value of Lung Adenocarcinoma.Front Cell Dev Biol. 2022 Mar 7;10:816927. doi: 10.3389/fcell.2022.816927. eCollection 2022. Front Cell Dev Biol. 2022. PMID: 35321241 Free PMC article.
-
Prognostic value of EMT-related genes and immune cell infiltration in thyroid carcinoma.Front Immunol. 2024 Nov 4;15:1463258. doi: 10.3389/fimmu.2024.1463258. eCollection 2024. Front Immunol. 2024. PMID: 39559351 Free PMC article.
-
Identify potential prognostic indicators and tumor-infiltrating immune cells in pancreatic adenocarcinoma.Biosci Rep. 2022 Feb 25;42(2):BSR20212523. doi: 10.1042/BSR20212523. Biosci Rep. 2022. PMID: 35083488 Free PMC article. Review.
-
Discovery of paradoxical genes: reevaluating the prognostic impact of overexpressed genes in cancer.Front Cell Dev Biol. 2025 Jan 22;13:1525345. doi: 10.3389/fcell.2025.1525345. eCollection 2025. Front Cell Dev Biol. 2025. PMID: 39911323 Free PMC article. Review.
References
-
- Siegel, R. L. et al. 2023 Cancer statistics. CA Cancer J. Clin.73(1), 17–48 (2023). - PubMed
-
- Cabanillas, M. E., McFadden, D. G. & Durante, C. Thyroid cancer. Lancet (London, England)388(10061), 2783–2795 (2016). - PubMed
-
- Rindi, G. et al. Overview of the 2022 WHO classification of neuroendocrine neoplasms. Endocr. Pathol.33(1), 115–154 (2022). - PubMed
Publication types
MeSH terms
Substances
Grants and funding
LinkOut - more resources
Full Text Sources
Medical
Research Materials

