. 2024 Dec 30;15(1):10870.
doi: 10.1038/s41467-024-55155-4.

Epidemic Zika virus strains from the Asian lineage induce an attenuated fetal brain pathogenicity

Affiliations

Epidemic Zika virus strains from the Asian lineage induce an attenuated fetal brain pathogenicity

Maïlis Darmuzey et al. Nat Commun. .

Abstract

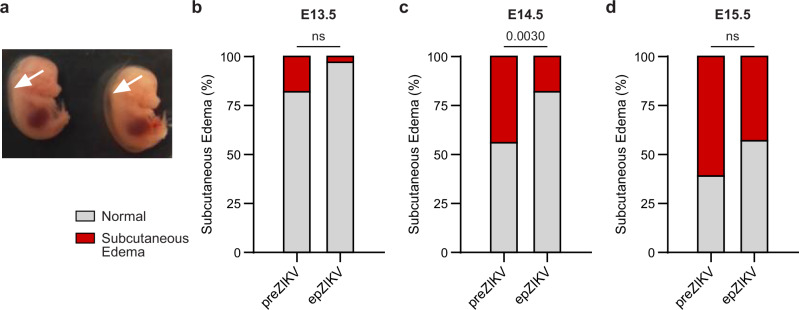
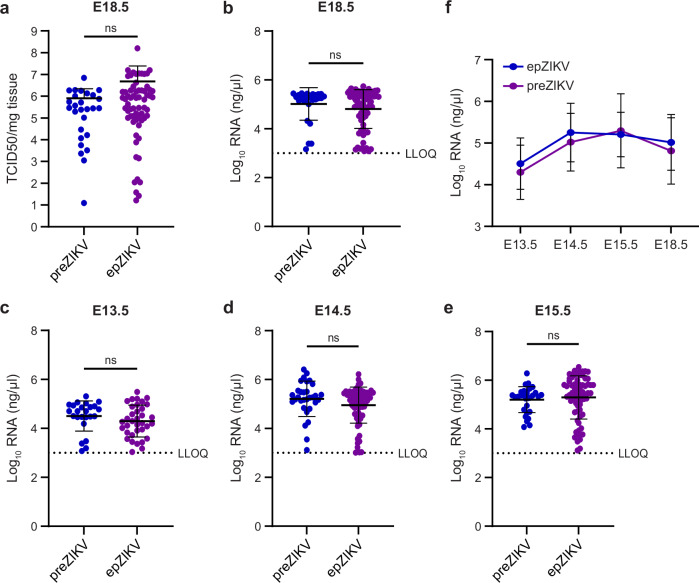
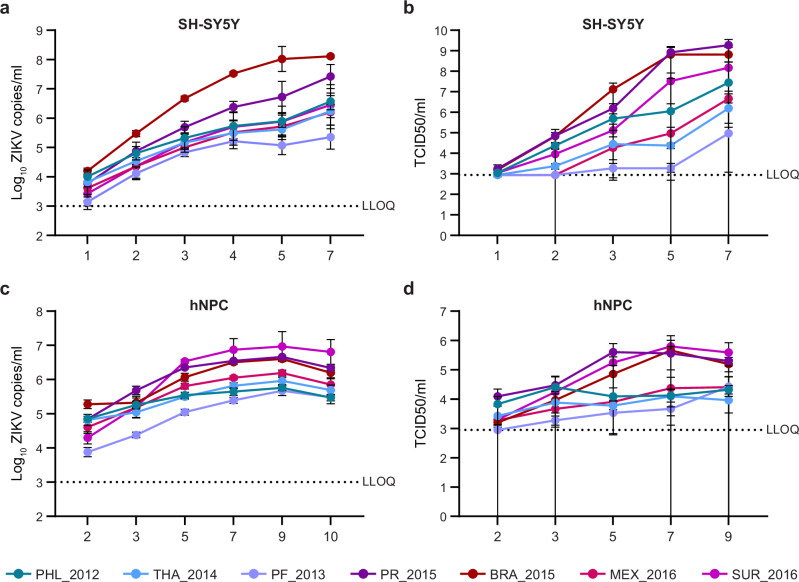
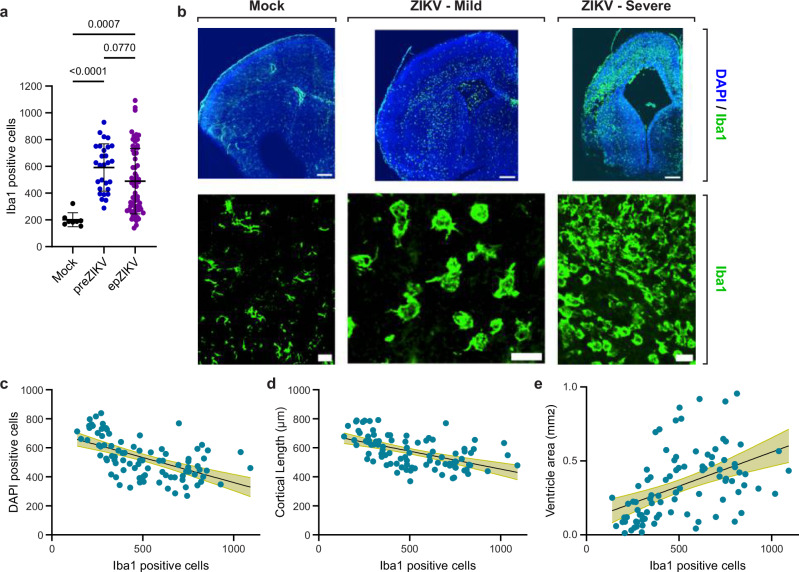
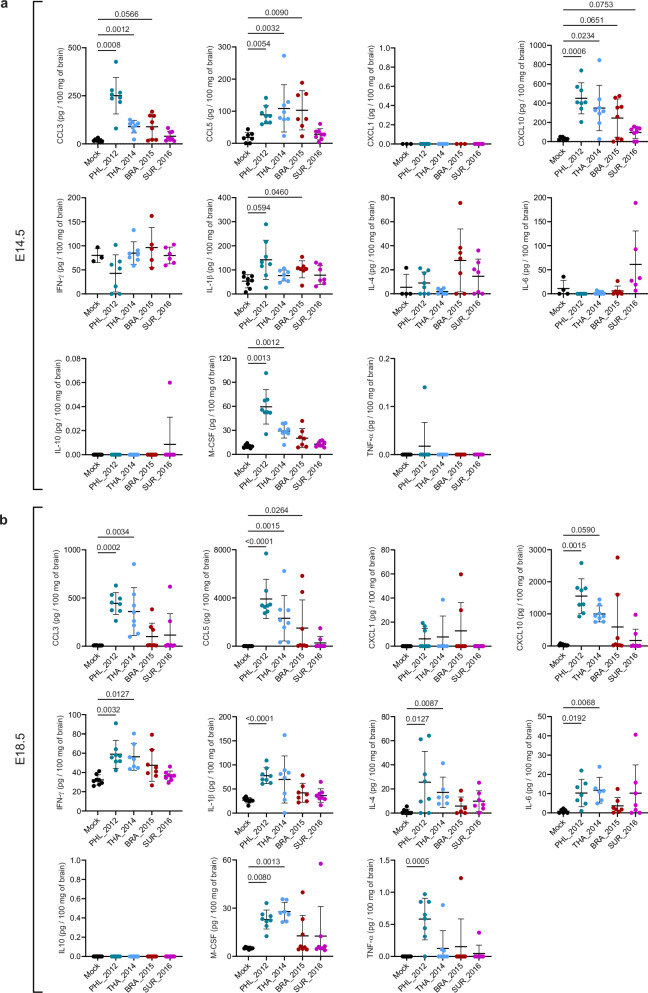
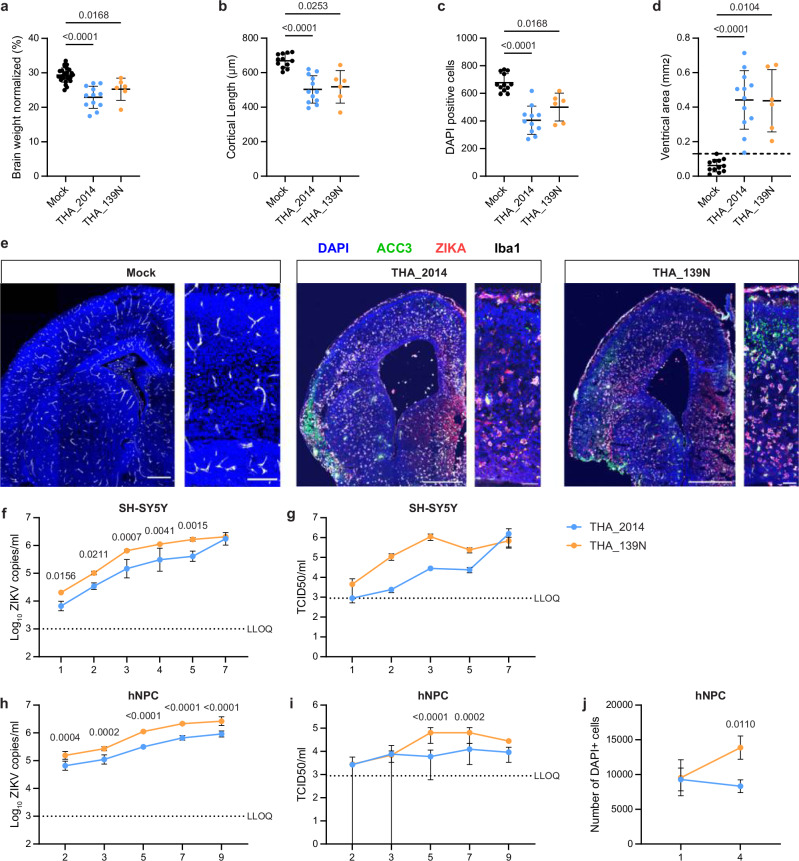
The 2015-2016 Zika virus (ZIKV) outbreak in the Americas revealed the ability of ZIKV from the Asian lineage to cause birth defects, generically called congenital Zika syndrome (CZS). Notwithstanding the long circulation history of Asian ZIKV, no ZIKV-associated CZS cases were reported prior to the outbreaks in French Polynesia (2013) and Brazil (2015). Whether the sudden emergence of CZS resulted from an evolutionary event of Asian ZIKV has remained unclear. We performed a comparative analysis of the pathogenicity of pre-epidemic and epidemic Asian ZIKV strains in mouse embryonic brains using a female immunocompetent intraplacental infection mouse model. All studied Asian ZIKV strains are neurovirulent, but pre-epidemic strains are consistently more pathogenic in the embryos than their epidemic equivalents. Pathogenicity is not directly linked to viral replication. By contrast, an influx of macrophages/microglial cells is noted in infected fetal brains for both pre-epidemic and epidemic ZIKV strains. Moreover, all tested ZIKV strains trigger an immunological response, whereby the intensity of the response differs between strains, and with epidemic ZIKV strains generally mounting a more attenuated immunostimulatory response. Our study reveals that Asian ZIKV strains evolved towards pathogenic attenuation, potentially resulting in CZS emergence in neonates rather than premature death in utero.


Conflict of interest statement

Competing interests: The authors declare no competing interests.

Figures

Fig. 1
Fig. 1. Brain abnormalities in embryonic mice caused by pre-epidemic and epidemic ZIKV strains.
ad Measured brain defects in embryonic mouse brains at E18.5 following mock-infection (black, n = 26 for brain weight; n = 12 for the others) or after infection by either pre-epidemic ZIKV strains (blue, n = 28) or epidemic ZIKV strains (purple, n = 68). Embryonic brains were examined morphologically by measuring the brain weight normalized to the head weight (a). Microcephaly-like phenotypes were assessed by measuring the cortical length (b) and the number of DAPI-positive cells (c). Ventriculomegaly was estimated by measuring the ventricle area (d). e Representative images of E18.5 embryonic mouse brains after mock-infection (left, n = 12) or infection with ZIKV BRA_2015 (middle, right, n = 12). Blue, green, red and white indicate DAPI, anti-cleaved caspase3 (ACC3), Zika virus, and Iba1 staining, respectively. The scale bars represent 500 µm and 50 µm. In (ad), data are presented as mean ± standard deviation. Statistical significance of differences was determined by Brown-Forsythe and Welch ANOVA, followed by Dunnett’s T3 multiple comparisons test for (a, c), or by one-way ANOVA, followed by Kruskal-Wallis’ multiple comparisons test for (b, d). Source data are provided as a Source Data file.
Fig. 2
Fig. 2. Embryos infected with ZIKV develop subcutaneous edema.
a Picture showing representative E14.5 mouse embryos with mild (arrow left embryo) and severe (arrow right embryo) subcutaneous edema. b Percentage of mouse embryos presenting subcutaneous edema at E13.5 after infection with either pre-epidemic (n = 17 in total) or epidemic (n = 33 in total) ZIKV strains. c, d Percentage of mouse embryos presenting subcutaneous edema at E14.5 (c) or E15.5 (d) after infection with either pre-epidemic (n = 43 and n = 31, respectively, in total) or epidemic (n = 82 and n = 53, respectively, in total) ZIKV strains. Statistical significance of differences was determined by the two-sided Fisher’s exact test (bd). Source data are provided as a Source Data file.
Fig. 3
Fig. 3. Replication kinetics of the pre-epidemic and epidemic ZIKV strains in the embryonic brain.
a Infectious virus in brain at E18.5, depicted as log10-transformed 50% tissue culture infectious dose (TCID50) per mg of tissue. b-e Brain viral RNA loads are shown as log10-transformed viral genome copies at various time points: E18.5 (b), E13.5 (c), E14.5 (d), E15.5 (e). f Replication kinetics of the pre-epidemic and epidemic ZIKV strains in embryonic brains at E13.5 to E18.5. Data are summarized data of (be). Blue dots/lines represent data of the pre-epidemic ZIKV strains and purple dots/lines represent data of the epidemic ZIKV strains. N numbers are shown in Supplementary Table 2. Data are represented as mean ± standard deviation. Statistical significance of differences was determined by one-way ANOVA, followed by Kruskal-Wallis’ multiple comparisons test. Statistically significant differences are displayed in Supplementary Fig. 4. ns, not significant. Source data are provided as a Source Data file.
Fig. 4
Fig. 4. Replication kinetics of the pre-epidemic and epidemic ZIKV strains in human brain cells in vitro.
a Viral loads in neuroblastoma cells are shown as log10-transformed viral genome copies at different days post-infection (all strains n = 9, except for PF_2013 n = 6). b Infectious virus in neuroblastoma cells is depicted as log10-transformed TCID50 per ml of supernatant at different days post-infection (all strains n = 3). c Viral loads in human neural progenitor cells are shown as log10-transformed viral genome copies at different days post-infection (all strains n = 6, except for SUR_2016 n = 3). d Infectious virus in human neural progenitor cells is depicted as log10-transformed TCID50 per ml of supernatant at different days post-infection (all strains n = 6, except for SUR_2016 n = 3). Blue-colored dots/lines represent data of the two pre-epidemic ZIKV strains and purple-/red-colored dots/lines represent data of the five epidemic ZIKV strains in (ad). Data are presented as mean values ± standard deviation. Statistical significance of differences was determined by two-way ANOVA followed by Šídák’s multiple comparisons test. Source data are provided as a Source Data file.
Fig. 5
Fig. 5. Correlation between influx of Iba1-positive cells and brain defect severity.
a Number of Iba1-positive cells in E18.5 embryonic mouse brain after mock-infection (n = 8) or infection by either pre-epidemic (n = 28) or epidemic (n = 64) ZIKV strains. Data are mean values ± standard deviation. Blue dots represent data of the pre-epidemic ZIKV strains and purple dots represent data of the epidemic ZIKV strains. b Representative images of E18.5 embryonic mouse brains after mock-infection (left pictures) or infection with ZIKV (middle and right pictures). For ZIKV-infected brains, a representative picture of a mild (middle) and severely affected (right) embryonic brain is shown. Blue and green indicate DAPI and Iba1 staining, respectively. Scale bars represent 200 µm and 50 µm. ce Correlation between the number of Iba1-positive cells at E18.5 and the different brain defect assessments: DAPI-positive cells (c), cortical length (d) and ventricle area (e) of the corresponding embryos after ZIKV infection. Statistical significance in (a) was determined using the Kruskal-Wallis test followed by Dunn’s multiple comparisons test. Correlation in (ce) was determined using the two-sided Spearman r correlation test. Correlation is indicated by a black solid line with green shaded areas indicating 95% confidence intervals. Source data are provided as a Source Data file.
Fig. 6
Fig. 6. Immunological response in embryonic mouse brains after ZIKV infection.
Quantification of eleven chemokine and cytokine levels (i.e., C-C motif chemokine ligand 3 [CCL3], CCL5, C-X-C motif chemokine ligand 1 [CXCL1], CXCL10, Interferon-γ [IFN-γ], Interleukin-1β [IL-1β], IL-4, IL-6, IL-10, Macrophage Colony-Stimulating Factor [M-CSF], and Tumor Necrosis Factor-α [TNF-α]) in embryonic mouse brains after mock-infection or infection with either PHL_2012, THA_2014, BRA_2015 or SUR_2016 at E14.5 (a) or E18.5 (b). Black, dark blue, light blue, red and pink dots represent mock, PHL_2012, THA_2014, BRA_2015 and SUR_2016 data, respectively. N numbers are depicted in Supplementary Table 3. Data are mean values ± standard deviation. Statistical significance was determined using the Kruskal-Wallis test followed by Dunn’s multiple comparisons test, or the Brown-Forsythe and Welch ANOVA test, followed by Dunnett’s T3 multiple comparison test. Source data are provided as a Source Data file.
Fig. 7
Fig. 7. Brain pathogenicity and in vitro viral replication of THA_139N compared to WT THA_2014.
ad Measured brain defects in embryonic mouse brains at E18.5 following mock-infection (n = 26 for brain weight; n = 12 for the others) or infection with either THA_2014 (n = 12) or THA_139N (n = 6). Embryonic brains were examined morphologically by measuring the brain weight normalized to the head weight (a). Microcephaly-like phenotypes were assessed by measuring the cortical length (b) and the number of DAPI-positive cells (c). Ventriculomegaly was estimated by measuring the ventricle area (d). e Representative images of E18.5 embryonic mouse brains after mock-infection (left, n = 12) or infection with THA_2014 (middle, n = 12) or THA_139N (right, n = 6). Blue, green, red and white indicate DAPI, anti-cleaved caspase3 (ACC3), Zika virus, and Iba1 staining, respectively. Scale bars represent 500 µm and 50 µm. f Viral loads in neuroblastoma cells, shown as log10-transformed viral genome copies at different days post-infection (THA_2014: n = 6, THA_139N: n = 3). g Infectious virus in neuroblastoma cells, depicted as log10-transformed TCID50 per ml of supernatant at different days post-infection (THA_2014: n = 3, THA_139N: n = 3). h Viral loads in human neural progenitor cells, shown as log10-transformed viral genome copies at different days post-infection (THA_2014: n = 6, THA_139N: n = 3). i Infectious virus in human neural progenitor cells, depicted as log10-transformed TCID50 per ml of supernatant at different days post-infection (THA_2014: n = 6, THA_139N: n = 3). j Number of DAPI-positive cells at day 1 and day 4 after infection of hNPCs (THA_2014: n = 3, THA_139N: n = 3). Data for THA_2014 in (ad) are the same as those presented in Supplementary Fig. 2. Light blue and orange dots/lines represent THA_2014 and THA_139N data, respectively. Data are mean ± standard deviation in (ad) and (fj). Statistical significance of differences was determined by Brown-Forsythe and Welch ANOVA followed by Dunnett’s T3 multiple comparisons test (ad), or by Two-way ANOVA followed by Šídák’s multiple comparisons test (h, i). Only statistically significant differences are shown. Source data are provided as a Source Data file.

Similar articles

Cited by

References

    1. Wikan, N. & Smith, D. R. First published report of Zika virus infection in people: Simpson, not MacNamara. Lancet Infect. Dis.17, 15–17 (2017). - PubMed
    1. World Health Organization. Zika virus. Factsheet. WHO, Geneva, Switzerland. (2022). https://www.who.int/news-room/fact-sheets/detail/zika-virus
    1. Morris, J. et al. Prevalence of microcephaly: the Latin American Network of Congenital Malformations 2010-2017. BMJ Paediatr. Open5, e001235 (2021). - PMC - PubMed
    1. Freitas, D. A. et al. Congenital Zika syndrome: a systematic review. PLoS ONE15, e0242367 (2020). - PMC - PubMed
    1. Filgueiras, I. S. et al. The clinical spectrum and immunopathological mechanisms underlying ZIKV-induced neurological manifestations. PLoS Negl. Trop. Dis.15, e0009575 (2021). - PMC - PubMed

Publication types

MeSH terms