. 2024 Dec 30;15(1):10840.
doi: 10.1038/s41467-024-55152-7.

Wearable non-invasive neuroprosthesis for targeted sensory restoration in neuropathy

Affiliations

Wearable non-invasive neuroprosthesis for targeted sensory restoration in neuropathy

Noemi Gozzi et al. Nat Commun. .

Abstract

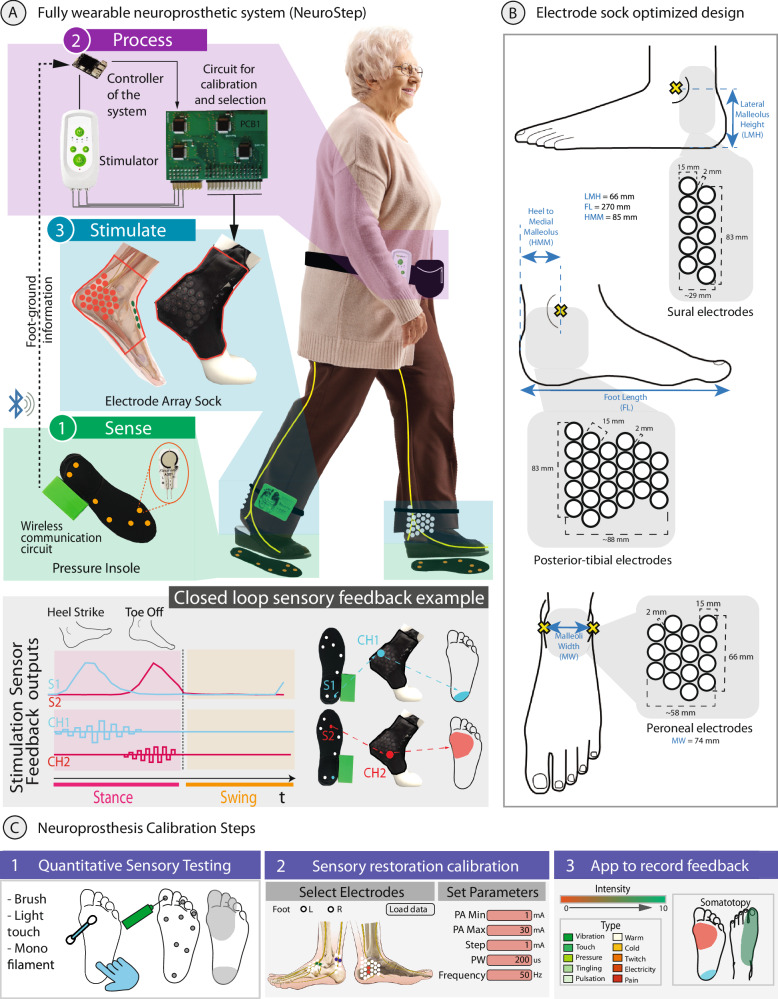
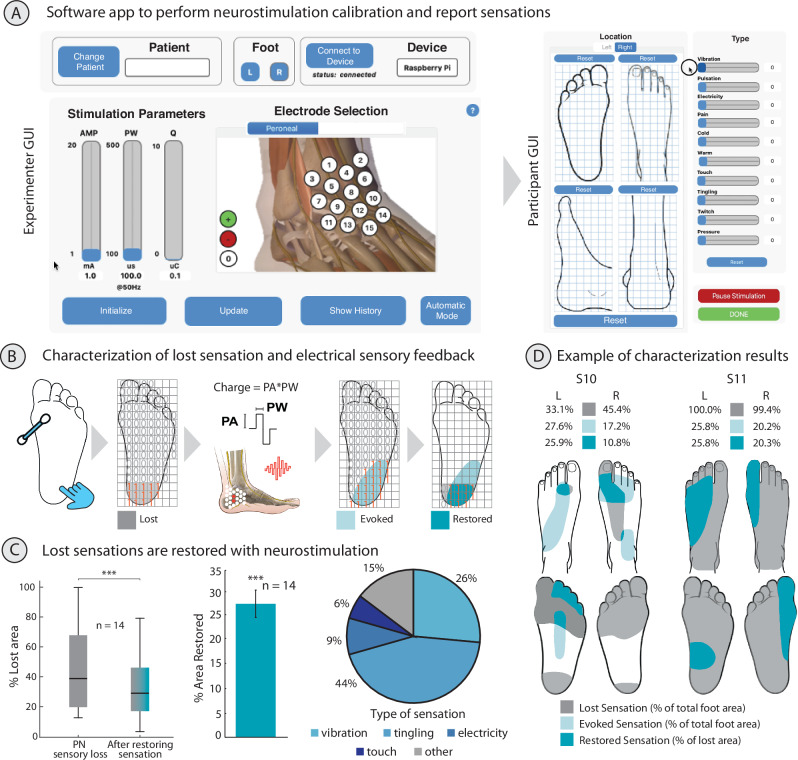
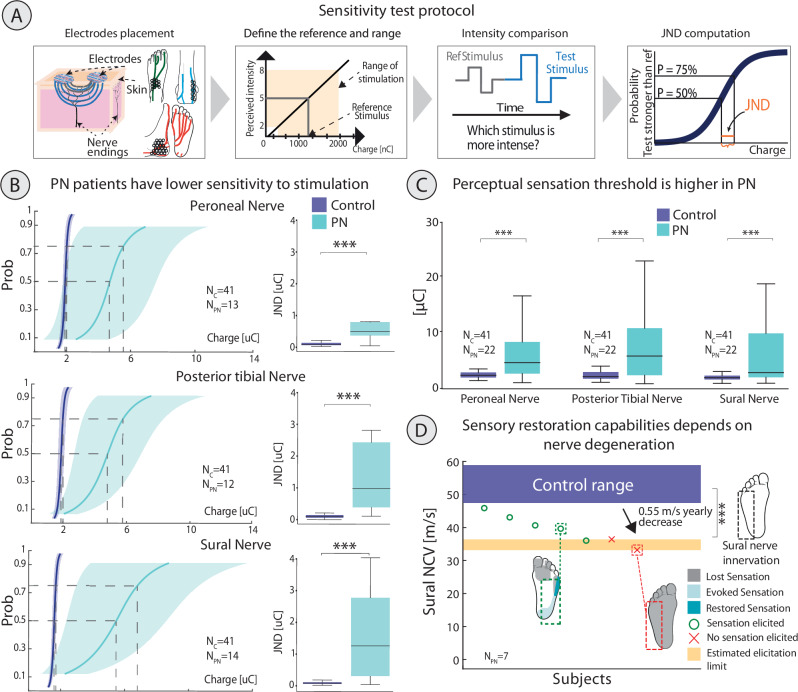
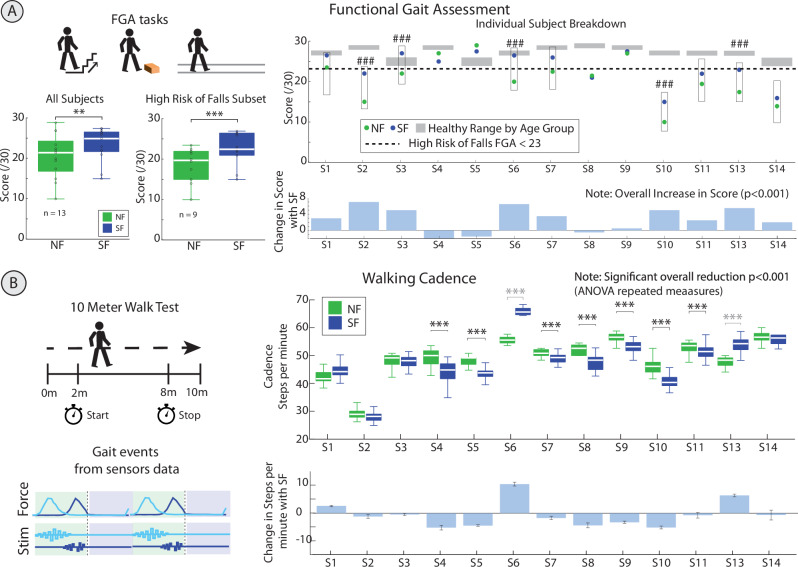
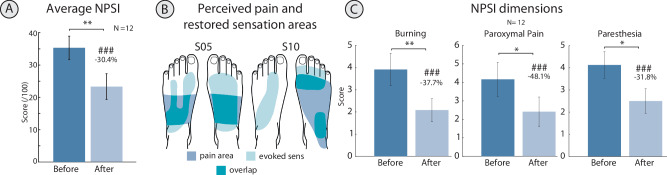
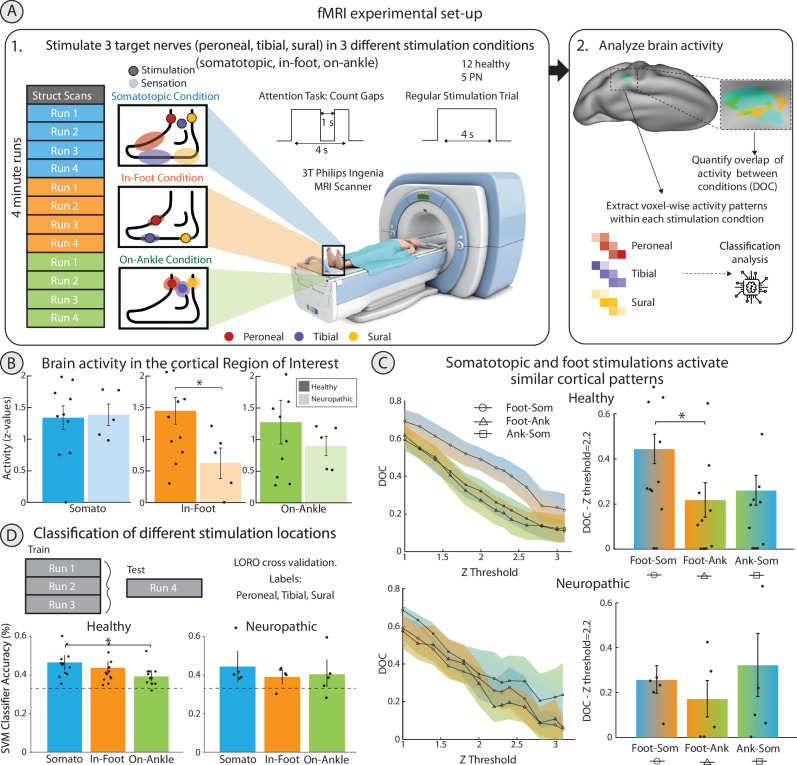
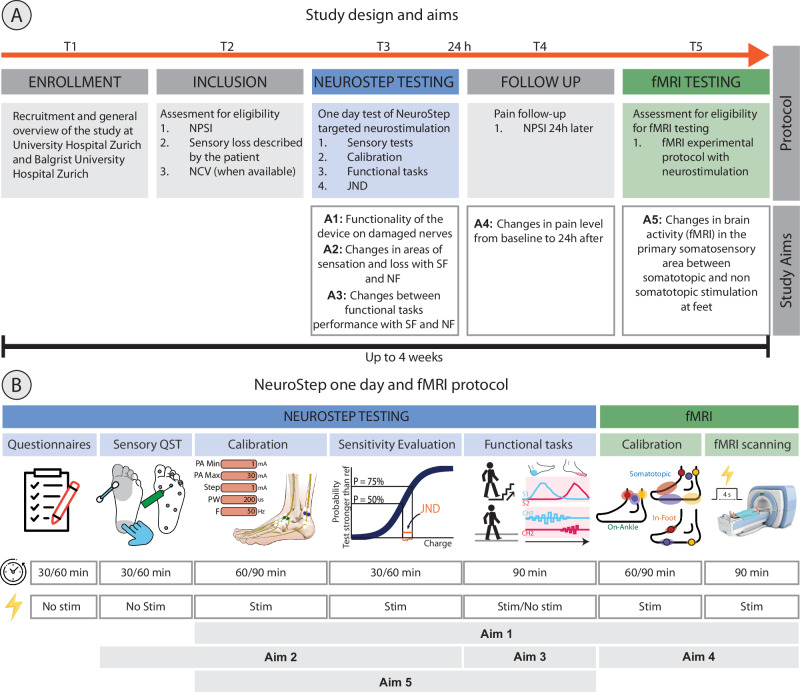
Peripheral neuropathy (PN), the most common complication of diabetes, leads to sensory loss and associated health issues as pain and increased fall risk. However, present treatments do not counteract sensory loss, but only partially manage its consequences. Electrical neural stimulation holds promise to restore sensations, but its efficacy and benefits in PN damaged nerves are yet unknown. We designed a wearable sensory neuroprosthesis (NeuroStep) providing targeted neurostimulation of the undamaged nerve portion and assessed its functionality in 14 PN participants. Our system partially restored lost sensations in all participants through a purposely calibrated neurostimulation, despite PN nerves being less sensitive than healthy nerves (N = 22). Participants improved cadence and functional gait and reported a decrease of neuropathic pain after one day. Restored sensations activated cortical patterns resembling naturally located foot sensations. NeuroStep restores real-time intuitive sensations in PN participants, holding potential to enhance functional and health outcomes while advancing effective non-invasive neuromodulation.


Conflict of interest statement

Competing interests: The authors do not have anything to disclose.

Figures

Fig. 1
Fig. 1. NeuroStep system overview and testing.
A NeuroStep is a wearable neuroprosthesis for closed-loop neurostimulation of damaged nerves of PN patients. (1) Force-sensitive insole sends foot-ground information. (2) The system controller receives insole data, selects different electrodes and modulates specific stimulation paradigms (found during calibration). (3) Stimulating sock with different electrodes mapped to different insole sensors. During gait, when different sensors are activated, the mapped sock channels are stimulated, and the participant perceives a sensation in the specific areas. B Electrode Sock Array Design. Anthropometric measures for key areas of the foot and ankle and specifications for array design with final number and position of electrodes. C NeuroStep calibration. 1: Quantitative Sensory Testing was performed with a brush, light touch, and a 10 g monofilament to evaluate the sensory loss of PN participants. 2: Electrical stimulation paradigms were calibrated, and appropriate active sites were personalised to achieve targeted sensory restoration. NeuroStep targets three lower-limb nerves: peroneal, posterior tibial (medial plantar, lateral plantar and medial calcaneal branches) and sural. 3: Calibration was performed using a software app to record the user feedback and select the next stimulation paradigm.
Fig. 2
Fig. 2. System calibration: steps for sensory restoration of lost sensations in PN participants.
A Custom designed software app with interactive GUI. On the left is the experimenter app, and on the right is the participant app to report the sensory feedback in terms of intensity, type and location. B Quantification of the perceived area of sensory loss and electrically evoked stimulation using the interactive GUI. The areas of sensory loss, elicited and restored sensations are then calculated. C Lost sensations are restored with targeted neurostimulation. From left to right: decrease in overall sensory loss after restoring sensation (N = 14 PN participants, Wilcoxon Signed-Rank test alternative two-sided, W = 14 and p = 2.6e-5), percentage of lost area that has been restored with neurostimulation (N = 14 PN participants, One sample Wilcoxon Signed-Rank test, W = 105 and p = 1.2e-4), and type of elicited sensation. D Example participants with lost, evoked, and restored sensation areas. ***p < 0.001. Barplots show the mean ± sem. Boxplots: Boxes: Q1 (25th), median (50th) and Q3 (75th). Whiskers with minimum and maximum: 1.5*IQR below Q1 and above Q3. Outliers outside 1.5*IQR below Q1 or above Q3 are not shown.
Fig. 3
Fig. 3. Characterising sensitivity to stimulation and charge threshold tests for neuropathic nerves vs healthy controls.
A Protocol to test and compute sensitivity through a tactile discrimination task. The sensitivity is proportional to the number of electrical intensity levels the participants can perceive during a modulated task. B On the left: pa sychometric curve with mean ± std representing the JND of each nerve in PN participants and healthy controls. On the right: boxplot comparison of JND (intensity at 75% probability – point of subjective equality at 50% (PSE)) between neuropathic and healthy participants. N refers to the number of nerves tested: NC = 41, NPN = 13, 12, 14, respectively for peroneal, posterior tibial and sural. Mann Whitney U test alternative two-sided, peroneal (U = 518, p < 0.0001), posterior tibial (U = 471, p < 0.0001), sural (U = 555, p < 0.0001). C Threshold charge to elicit a perceptual sensation in neuropathic and healthy control participants. Number of nerves tested: NC = 41, NPN = 22. Mann Whitney U test alternative two-sided, peroneal (U = 709, p = 0.0002), posterior tibial (U = 813, p < 0.0001), and sural nerves (U = 717, p = 0.0001). D Sensory restoration capabilities of NeuroStep depends on the progression of neuropathy and nerve degeneration. The sural nerve conduction velocity is a predictor of the NeuroStep abilities to elicit or not a sensation. ***p < 0.001. Boxplots (in B and C). Boxes: Q1 (25th), median (50t) and Q3 (75th). Whiskers with minimum and maximum: 1.5*IQR below Q1 and above Q3. Outliers outside 1.5*IQR below Q1 or above Q3 are not shown.
Fig. 4
Fig. 4. Real-time use of the NeuroStep device: Functional performance improved in PN participants using restored sensory feedback provided by the targeted neurostimulation.
A Functional Gait Analysis (FGA) performance with (SF) and without (NF) sensory feedback. Healthy Age Ranges obtained from Walker et al.. On the left: Box plots show the median score in all participants (NPN = 13) and in participants at a high risk of falls (NPN = 9) (Baseline FGA < 23). The individual breakdown shows the raw score and change in score. In box plots on the left: Wilcoxon Signed Rank test alternative two-sided, **p < 0.01 (W = 9, p = 0.008), ***p < 0.001 (W = 1, p = 0.0004). In individual plots on the right: ### clinically significant change. B Walking Cadence with (SF) and without (NF) sensory feedback during the 10-metre walk test. Box plots show the cadence in each participant with SF and NF. Repeated Measure ANOVA (NPN = 13), ***p < 0.001 (F statistic = 607.98, p = 1.2e-11). For single-subject results (N refers to the number of repetitions per subject, NSF = 6, NNF = 6), the Wilcoxon Signed Rank test ***p < 0.001. S12 did not perform functional tasks and is therefore excluded from this assessment. Boxplots (in A and B). Boxes: Q1 (25th), median (50t) and Q3 (75th). Whiskers with minimum and maximum: 1.5*IQR below Q1 and above Q3. Outliers outside 1.5*IQR below Q1 or above Q3 are not shown. Barplots (in B) show the mean ± sem.
Fig. 5
Fig. 5. Effects of one day of targeted neurostimulation on neuropathic pain reported by the participants.
A Average Neuropathic Pain Symptom Inventory (NPSI) before and after intervention (NPN = 12 participants). Wilcoxon Signed Rank Test 2-sided, W = 63, p = 0.0049. B Examples of reported areas of pain and evoked sensation. C Constant pain components of the NPSI (NPN = 12 participants). Wilcoxon Signed Rank Test 2-sided, burning: W = 36, p = 0.0078, paroximal: W = 51, p = 0.014, paraesthesia: W = 67, p = 0.026. *p < 0.05, **p < 0.01. ###=clinically significant change (reduction of 30%,,). Barplots (in A and C) show the mean ± sem.
Fig. 6
Fig. 6. Cortical patterns of somatotopic neurostimulation.
A Experimental Set-Up: The protocol consisted of three different conditions: somatotopic, in-foot, and on-ankle stimulation. Each condition was tested in four different runs of 36 stimulations of 4 s each, in which the three target locations (peroneal [red], tibial [blue], sural [yellow] nerves) were presented in a counterbalanced and predefined random order. During each run, an attentional task (counting gaps in stimulation) was performed. Each trial was performed with 3 T fMRI recorded. The processing is detailed in Methods. B Averaged z-standardised activity in the somatotopic (somato), in-foot and on-ankle conditions in a functionally defined foot and ankle S1 region of interest in healthy (dark colours) and PN (light colours) participants. In-foot activation for PN participants is statistically lower than healthy controls (Mann Whitney test alternative two-sided, NH = 12, NPN = 5, U = 11, *p = 0.048). C Spatial overlap of neural activity in the ROI (expressed using the DOC) between in-foot/somatotopic (Foot-Som; circle), in-foot/on-ankle (Foot-Ank; triangle), and on-ankle/somatotopic (Ank-Som; square) conditions. The DOC ranges from 0 (no spatial overlap) to 1 (perfect spatial overlap). The line plots show the DOC for activity thresholded using a Z threshold ranging from 1 to 3.2, with the line and shaded area representing the mean and standard deviation respectively. Statistical significance between condition pairs was determined for activity thresholded using Z > 2.2, as depicted in the bar plots on the right. For healthy participants, the overlap somatotopic/in-foot was higher than vs in-foot/on-ankle, Friedman test alternative two-sided, NH = 12, Q = 8.90, *p = 0.012. PN participants: Friedman test alternative two-sided, NPN = 5, p > 0.05. D Spatial distinguishability of the different stimulation locations (peroneal, tibial and sural) for each condition (somatotopic (somato), in-foot and on-ankle). The average accuracy of a three-class SVM classifier (Leave One Run Out cross-validation) among participants is reported. For healthy participants, somatotopic stimulation provides higher distinguishable patterns than on-ankle, Friedman post-hoc Nemeny test, test alternative two-sided, NH = 12, Q = 6.94, *p = 0.031. PN participants, Friedman post-hoc Nemeny test, test alternative two-sided, NPN = 5, p > 0.05. Barplots (in B, C and D) show the mean ± sem.
Fig. 7
Fig. 7. Study design.
A Study design. First, enrolment was performed at the clinical sites, followed by an assessment for eligibility (see flow diagram in Supplementary Fig. S8 for detailed information). Then patients that satisfied the inclusion and exclusion criteria were allocated to intervention. The timeline between enrolment and the first day of testing depended on the availability of the participant but was typically within 2 weeks. Then, participants performed a full day of tests with (SF) and without (NF) electrically induced sensory feedback. 24 hours later, a follow-up NPSI to assess pain was performed. Available participants that satisfied the inclusion criteria for fMRI testing were then enrolled for a further half a day of scanning. The fMRI scanning was performed up to one month after the first day of stimulation depending on the availabilities of participants and of the scanners. B Detailed protocol of one day of NeuroStep use and fMRI scanning. The time range of each step is shown.

Similar articles

Cited by

References

    1. WHO. Global report on diabetes. https://www.who.int/publications-detail-redirect/9789241565257 (2016).
    1. Marx, J. Unraveling the causes of diabetes. Science296, 686–689 (2002). - PubMed
    1. Williams, R. et al. Global and regional estimates and projections of diabetes-related health expenditure: Results from the International Diabetes Federation Diabetes Atlas, 9th edition. Diabetes Res. Clin. Pract.162, 108072 (2020). - PubMed
    1. Feldman, E. L. et al. Diabetic neuropathy. Nat. Rev. Dis. Prim.5, 1–18 (2019). - PMC - PubMed
    1. Lehmann, H. C., Wunderlich, G., Fink, G. R. & Sommer, C. Diagnosis of peripheral neuropathy. Neurol. Res. Pract.2, 20 (2020). - PMC - PubMed

Publication types

LinkOut - more resources