. 2024 Dec 30;15(1):10849.
doi: 10.1038/s41467-024-55146-5.

Multivariate stochastic modeling for transcriptional dynamics with cell-specific latent time using SDEvelo

Affiliations

Multivariate stochastic modeling for transcriptional dynamics with cell-specific latent time using SDEvelo

Xu Liao et al. Nat Commun. .

Abstract

Recently, RNA velocity has driven a paradigmatic change in single-cell RNA sequencing (scRNA-seq) studies, allowing the reconstruction and prediction of directed trajectories in cell differentiation and state transitions. Most existing methods of dynamic modeling use ordinary differential equations (ODE) for individual genes without applying multivariate approaches. However, this modeling strategy inadequately captures the intrinsically stochastic nature of transcriptional dynamics governed by a cell-specific latent time across multiple genes, potentially leading to erroneous results. Here, we present SDEvelo, a generative approach to inferring RNA velocity by modeling the dynamics of unspliced and spliced RNAs via multivariate stochastic differential equations (SDE). Uniquely, SDEvelo explicitly models inherent uncertainty in transcriptional dynamics while estimating a cell-specific latent time across genes. Using both simulated and four scRNA-seq and spatial transcriptomics datasets, we show that SDEvelo can model the random dynamic patterns of mature-state cells while accurately detecting carcinogenesis. Additionally, the estimated gene-shared latent time can facilitate many downstream analyses for biological discovery. We demonstrate that SDEvelo is computationally scalable and applicable to both scRNA-seq and sequencing-based spatial transcriptomics data.


Conflict of interest statement

Competing interests: The authors declare no competing interests.

Figures
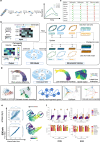
Fig. 1
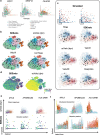
Fig. 1. Overview of SDEvelo.
a Left panel: the continuous RNA transcription-splicing-degradation process, illustrating the conversion of DNA transcripts to pre-mature mRNA u(t) (with transcription rate α(t)), pre-mature mRNA u(t) to mature mRNA s(t) (splicing rate β), and the eventual degradation (degradation rate γ). Right panel: a comparison of abundance over time between the deterministic ODE model and the stochastic SDE model, demonstrating the SDE model’s capability to capture stochasticity. b Input (upper left): unspliced and spliced matrices are provided as real data. Generation (lower middle): a nonlinear multivariate SDE model generates simulated data. Training process (right): the SDE model parameters are updated by minimizing the distributional divergence between real and generated data. Output (lower left): the trained SDE model produces estimated velocity and cell-specific latent time. c Chart comparing SDEvelo with other methods, focusing on aspects that include the nonlinearity of transcriptional dynamic model, the use of a multivariate model to collaboratively consider multiple genes, modeling with SDE, and robustness to spatial transcriptomics data. d SDEvelo is capable of visualizing streamline plots with estimated velocity and latent time heatmap plots. Additionally, SDEvelo can guarantee negative controls in mature-state populations, delineate stromal and tumor/normal epithelium (TNE) boundaries, identify carcinogenesis-related candidate genes, integrate with CellRank and analyze cell-cell communication. e Comparison between SDEvelo and scVelo (dyn) in terms of estimated latent time, including KDE scatter plots with the ground truth line between the estimated and true latent time (left panel) and a latent time heatmap on the projected PCA space. The arrow indicates the correct direction along the true latent time, and the circle highlights the inconsistent part estimated by scVelo (dyn). f For each setting with gene numbers from 100 to 1000, performance was evaluated using absolute relative ratio errors and Pearson correlation coefficients with ten-fold cross-validation (n = 10 cross-validation replicates per group). Bar plots show mean ± standard deviation (SD) with individual points. Box plots show median, quartiles, and 1.5 times interquartile range. Source data are provided as a Source Data file.
Fig. 2
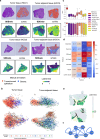
Fig. 2. Negative controls of transcriptional dynamics in mature-state cell populations (n = 65,877 cells).
a Scatter plots of unspliced and spliced mRNA data, colored by cell type, for noisy/mature genes in PBMCs. b Streamline plots generated by SDEvelo and other methods, including scVelo (dyn), VeloVI, and UniTVelo. SDEvelo displayed random velocities for most cell types, while other methods identified strong transitions among mature cells. c Upper panel: scatter plots of simulated noisy/mature genes between unspliced and spliced mRNA data. Lower panel: streamline plots of velocity estimated by SDEvelo and other methods, including scVelo (dyn), VeloVI, VeloAE, and DeepVelo. SDEvelo exhibited random velocities among cells, whereas other methods identified strong, erroneous directions. d Latent time heatmap for SDEvelo (left panel) and scVelo (dyn) (right panel). The latent time estimated by SDEvelo was closer to the terminal state than that by scVelo (dyn), and aligned more consistently with the mature states within PBMC data. e Generated deterministic trajectories from scVelo (dyn) (upper panel) and the stochastic trajectories generated by SDEvelo, colored by the estimated latent time (lower panel), for MYL6, APOBEC3G, and HLA-DRB1. The color scheme for cell type and estimated latent time is the same as in (a) and (d), respectively. f Scatter plots of estimated latent time and spliced abundance from scVelo (dyn) (upper panel) and SDEvelo (lower panel), colored by cell type. Color scheme for cell type is the same as in (a). ScVelo (dyn) identified erroneous cell type clusters along the estimated latent time.
Fig. 3
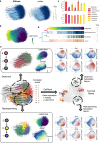
Fig. 3. Analysis of HCC data with spatial transcriptomics (n = 9, 812 spots).
a First and third rows: H& E images and manual annotations by a pathologist of tumor and tumor-adjacent tissue sections. Second and fourth rows: estimated latent time heatmap for SDEvelo and scVelo (dyn). SDEvelo identified clear gradual latent time transitions from stroma to TNE, while scVelo failed to obtain a clear and correct pattern that matched the annotations. b PCA-projected streamline plots for four human HCC samples. Clusters 1-5 represent TNE regions and clusters 6–9 are stromal regions. c Boxplots of cross-boundary direction correctness (CBDir) and AUC used to compare SDEvelo with other methods (n = 4 HCC sections biological replicates). Higher CBDir and AUC indicate better performance in terms of velocity estimates more consistent with the biological transitions. In the boxplot, the center line, box lines and whiskers represent the median, upper, and lower quartiles, and 1.5 times interquartile range, respectively. Source data are provided as a Source Data file. d Heatmaps of rank correlation across four HCC sections to benchmark the performance of all methods. A higher Spearman rank correlation suggests that the estimated latent time is more consistent with the true transitions. Source data are provided as a Source Data file. e Estimated latent time heatmap for SDEvelo in tumor-adjacent tissue sections, with spots whose latent time values are between 0.275 and 0.325 highlighted. The highlighted spots delineate a clear boundary between the stromal and TNE regions. f PPI network among TTR, APOC1, APOA1, APOE, APOC3, and C3, in which the connections represent significant interactions between the corresponding proteins.
Fig. 4
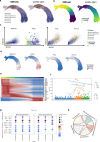
Fig. 4. Analysis of mouse embryonic reprogramming data (n = 85, 010 cells).
a Streamline plots from SDEvelo and scVelo (dyn) on projected PCA space, with each cell colored according to reprogramming days, ranging from 0 to 28. b Heatmap of the estimated latent time by SDEvelo on projected PCA space, showing consistency with reprogramming days. c Bar plots comparing SDEvelo with other methods (n = 5 cross-validation replicates). Upper panel: Pearson correlation coefficients between estimated latent time and reprogramming days. Bar plots show mean ± standard deviation (SD) with individual points. Lower panel: mean and standard deviations of AUC values quantifying the correctness of inferred transitions. Source data are provided as a Source Data file. d Comparative alignment heatmap of time estimates scaled from 0 to 1: latent time estimated by SDEvelo, true reprogramming days, Monocle’s estimated pseudotime, and latent time estimated by scVelo (dyn). Pearson correlation coefficients are calculated between each method’s time estimate and the true reprogramming days. e Middle left panel: overall streamline plot from SDEvelo in PCA space, visualized using a subset of 5000 cells for improved clarity. Top left panel: subset streamline plot illustrating SDEvelo’s identification of a dead-end trajectory spanning from Cluster 8 to 4 to 3, marked by the expression of the MEF marker gene Col1a2. The heatmap of estimated latent times on the PCA manifold illustrates the temporal progression within identified trajectories. Bottom left panel: subset streamline plot focusing on clusters 1, 2, and 6 within the PCA space and showcasing SDEvelo’s tracing of a reprogramming trajectory from Cluster 2 to 6 to 1, characterized by the expression of the iEP marker gene Apoa1. The corresponding heatmap of estimated latent time provides a visualization of temporal dynamics of the PCA manifold for the specified cluster subset. Right panel: After integrating the latent time and velocity estimated by SDEvelo with gene expression analyzed by CellRank, clusters 3 and 1 were identified as terminal states. The gene expression heatmap for top genes associated with the dead-end and reprogramming trajectories. The color scheme for latent time is the same as that used in (b).
Fig. 5
Fig. 5. Analysis of mouse gastrulation erythroid data (n = 9, 815 cells).
a Streamline plots of SDEvelo and scVelo (dyn) on the projected UMAP. SDEvelo successfully identified the correct transitions, while scVelo (dyn) estimated messy directions. b Heatmap of the estimated latent time for SDEvelo and scVelo (dyn). SDEvelo accurately estimated latent times that matched the differentiation progression, whereas scVelo (dyn) estimated reversed latent times. c Scatter plots of unspliced and spliced data with trajectories generated by SDEvelo, colored by estimated latent times from SDEvelo. Left panel shows genes with transcriptional boosts, and right panel shows genes with reversed directionality. d Gene expression heatmaps in UMAP space for selected genes. e Expression heatmaps along the estimated latent time from SDEvelo for prioritized genes. The color scheme for the cell type and estimated latent time is the same as in (a) and (b), respectively. f Bubble plot of Gene Ontology (GO) enrichment analysis within the contexts of biological process (BP), cellular component (CC), and molecular function (MF). Bubble size represents the number of genes in each GO term, and gray shadows indicate insignificant GO terms. The enrichment analysis was performed using two-tailed Fisher’s exact test, with p-values adjusted for multiple testing using the Benjamini-Hochberg false discovery rate (FDR) method. Source data are provided as a Source Data file. g Dot heatmap of ligand-receptor interactions from cell-cell communication (CCC) analysis. The size of each dot indicates the magnitude of the interaction, and the color of the dots represents permutation-based p-values. Statistical significance was assessed using one-tailed permutation tests (P = 1000 permutations) based on aggregated expression values (using Tuckey’s TriMean), with p-values calculated as the fraction of permuted values exceeding the observed values. Source data are provided as a Source Data file. h Chord chart summarizing the number of interactions between different cell subtypes, with connections between blood progenitors and erythroids highlighted.

Similar articles

Cited by

References

    1. Mereu, E. et al. Benchmarking single-cell rna-sequencing protocols for cell atlas projects. Nat. Biotechnol.38, 747–755 (2020). - PubMed
    1. Jovic, D. et al. Single-cell rna sequencing technologies and applications: A brief overview. Clin. Transl. Med.12, e694 (2022). - PMC - PubMed
    1. Trapnell, C. et al. The dynamics and regulators of cell fate decisions are revealed by pseudotemporal ordering of single cells. Nat. Biotechnol.32, 381–386 (2014). - PMC - PubMed
    1. Ji, Z. & Ji, H. Tscan: Pseudo-time reconstruction and evaluation in single-cell rna-seq analysis. Nucleic Acids Res.44, e117–e117 (2016). - PMC - PubMed
    1. Qiu, X. et al. Reversed graph embedding resolves complex single-cell trajectories. Nat. Methods14, 979–982 (2017). - PMC - PubMed

Publication types

LinkOut - more resources