. 2024 Dec 30;15(1):10892.
doi: 10.1038/s41467-024-55262-2.

Unsupervised inter-domain transformation for virtually stained high-resolution mid-infrared photoacoustic microscopy using explainable deep learning

Affiliations

Unsupervised inter-domain transformation for virtually stained high-resolution mid-infrared photoacoustic microscopy using explainable deep learning

Eunwoo Park et al. Nat Commun. .

Abstract

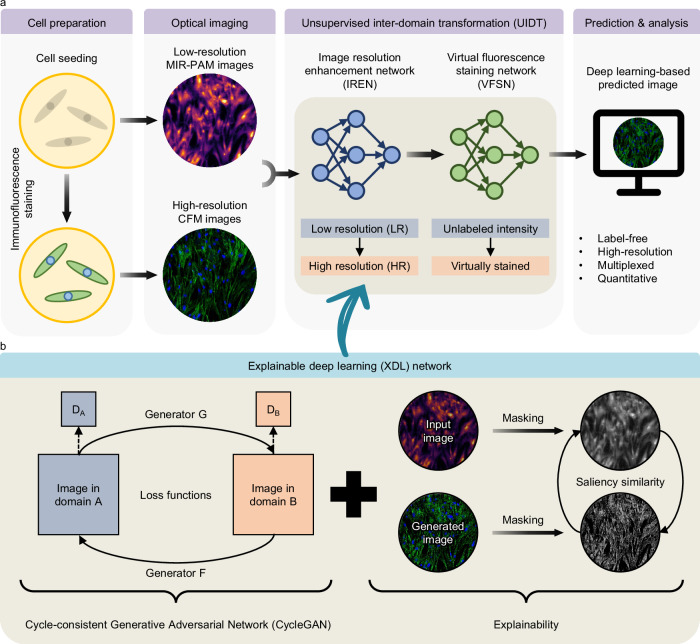
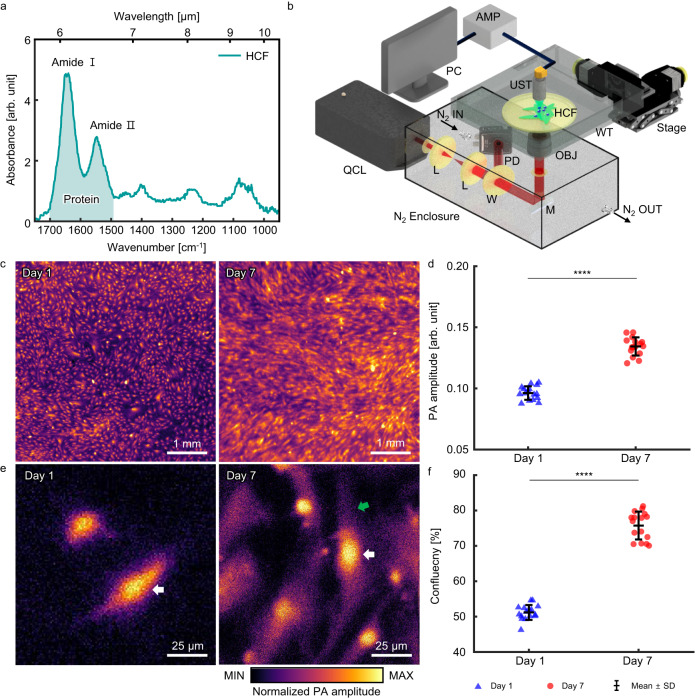
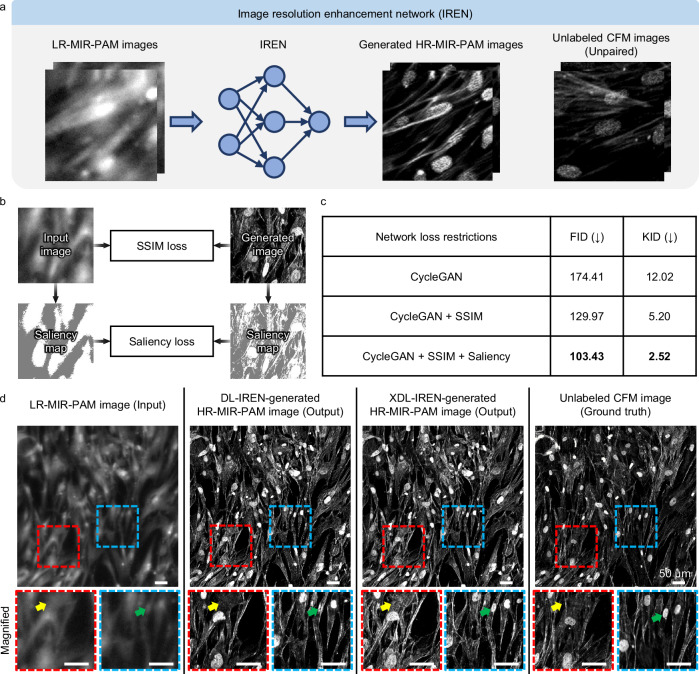
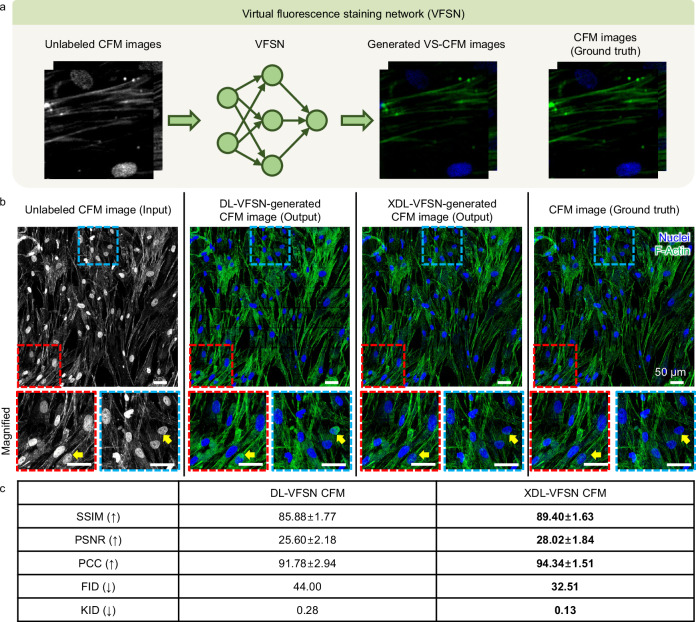
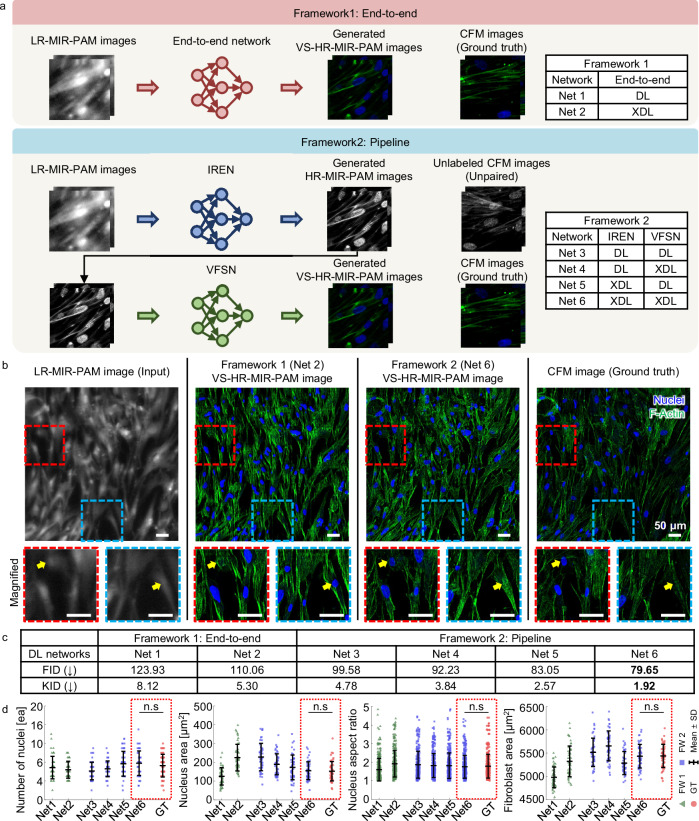
Mid-infrared photoacoustic microscopy can capture biochemical information without staining. However, the long mid-infrared optical wavelengths make the spatial resolution of photoacoustic microscopy significantly poorer than that of conventional confocal fluorescence microscopy. Here, we demonstrate an explainable deep learning-based unsupervised inter-domain transformation of low-resolution unlabeled mid-infrared photoacoustic microscopy images into confocal-like virtually fluorescence-stained high-resolution images. The explainable deep learning-based framework is proposed for this transformation, wherein an unsupervised generative adversarial network is primarily employed and then a saliency constraint is added for better explainability. We validate the performance of explainable deep learning-based mid-infrared photoacoustic microscopy by identifying cell nuclei and filamentous actins in cultured human cardiac fibroblasts and matching them with the corresponding CFM images. The XDL ensures similar saliency between the two domains, making the transformation process more stable and more reliable than existing networks. Our XDL-MIR-PAM enables label-free high-resolution duplexed cellular imaging, which can significantly benefit many research avenues in cell biology.


Conflict of interest statement

Competing interests: J.A. and C.K. have financial interests in OPTICHO, which, however, did not support this work. All other authors declare no competing interests.

Figures

Fig. 1
Fig. 1. Overview of the XDL-MIR-PAM.
a Workflow for UIDT in MIR-PAM images. Low-resolution MIR-PAM images and high-resolution CFM images of cultured cells are inputs of UIDT. The two-step UIDT produces high-resolution and virtually fluorescence-stained images of label-free cells. b The network configuration for the XDL. By adjusting the saliency masks between the input and generated images, the XDL model adopts a saliency similarity in loss functions of the existing network to achieve explainability. MIR-PAM, mid-infrared photoacoustic microscopy, CFM, confocal fluorescence microscopy, and DA and DB denote discriminators of each domain.
Fig. 2
Fig. 2. Label-free MIR-PAM of HCFs.
a Fourier-transform infrared spectrum of HCFs. b Schematic diagram of MIR-PAM system. c Label-free MIR-PAM images of HCFs at days 1 and 7 (pseudo-colored). d Averaged PA signal amplitudes (n = 16, mean ± SD). Significance by unpaired two-tailed t test: ****, p = 1.3 × 10−16. e Magnified view images of Fig. 2c. f, Cell confluency at day 1 and day 7 of growth. (n = 16, mean ± SD). Significance by unpaired two-tailed t test: ****, p = 4.9 × 1020. QCL, quantum cascade laser; L, Lens; W, window; M, Mirror; OBJ, Objective lens; WT, water tank; HCF, human cardiac fibroblasts; UST, Ultrasonic transducer; and AMP, Amplifier. Source data are provided as a Source Data file.
Fig. 3
Fig. 3. XDL network for image resolution enhancement.
a Conceptual workflow of the image resolution enhancement network (IREN). b Loss restrictions for the XDL-IREN. The SSIM and saliency similarity refer to the preserved structural content between the image domains. c Quantitative comparison of IREN performance with network restrictions. Arrows in parentheses indicate the direction of better performance and the best scores are highlighted in bold font. d Visual comparison of IREN-generated images from the domains. In the HCF images with enhanced resolution, the oval and linear structures are inferred to be cell nuclei and F-actins, respectively. Scale bars, 50 μm. SSIM, structural similarity index; FID, Frechet inception distance; KID, kernel inception distance; DL, deep learning; and XDL, explainable deep learning.
Fig. 4
Fig. 4. XDL network for virtual FL staining.
a Conceptual workflow of the virtual fluorescence staining network (VFSN). b Visual comparison of VFSN-generated images between the domains. In the FL-stained HCF images, the blue and green channels refer to the staining by Hoechst and FITC, respectively. The yellow arrows indicate non-specific staining errors in the DL-VFSN but are corrected in the XDL-VFSN. Scale bars, 50 μm. c Table for quantitative comparison of VFSN performance. SSIM, structural similarity index; PSNR, peak signal-to-noise ratio; PCC, Pearson’s correlation coefficient; FID, Frechet inception distance; and KID, kernel inception distance. Data are presented as mean ± SD. Arrows in parentheses indicate the direction of better performance and the best scores are highlighted in bold font. Source data are provided as a Source Data file.
Fig. 5
Fig. 5. Comparative performance of frameworks applied to the XDL-MIR-PAM.
a Schematic of two types of frameworks. b Visual and (c)table for quantitative comparison between the networks. Scale bars, 50 μm. In the VS-HR-MIR-PAM images of HCFs, the blue and green channels refer to the cell nuclei and F-actins, respectively. The best scores are highlighted in bold font. d Quantitative comparisons of the number of nuclei, nucleus area, nucleus aspect ratio, and fibroblast area among various frameworks (n = 49, mean ± SD). For the DL and XDL, the CycleGAN and explainable CycleGAN are adopted, respectively. Significance by one-way ANOVA with Dunnett’s multiple comparisons test: n.s, not significant (p > 0.05). p = 0.7059 (number of nuclei), p = 0.9999 (nucleus area), p = 0.9564 (nucleus aspect ratio), and p = 1.0000 (fibroblast area). Source data and p-values are provided as a Source Data file.

Similar articles

Cited by

References

    1. Pawley, J. Handbook of Biological Confocal Microscopy, 236. (Springer Science & Business Media, 2006).
    1. Lichtman, J. W. & Conchello, J.-A. Fluorescence microscopy. Nat. Methods2, 910–919 (2005). - PubMed
    1. Cutrale, F. et al. Hyperspectral phasor analysis enables multiplexed 5D in vivo imaging. Nat. Methods14, 149–152 (2017). - PubMed
    1. Schueder, F. et al. Multiplexed 3D super-resolution imaging of whole cells using spinning disk confocal microscopy and DNA-PAINT. Nat. Commun.8, 2090 (2017). - PMC - PubMed
    1. Zimmermann, T., Rietdorf, J. & Pepperkok, R. Spectral imaging and its applications in live cell microscopy. FEBS Lett.546, 87–92 (2003). - PubMed

Publication types

LinkOut - more resources