. 2024 Dec 30;15(1):10865.
doi: 10.1038/s41467-024-55209-7.

Age-dependent regulation of axoglial interactions and behavior by oligodendrocyte AnkyrinG

Affiliations

Age-dependent regulation of axoglial interactions and behavior by oligodendrocyte AnkyrinG

Xiaoyun Ding et al. Nat Commun. .

Abstract

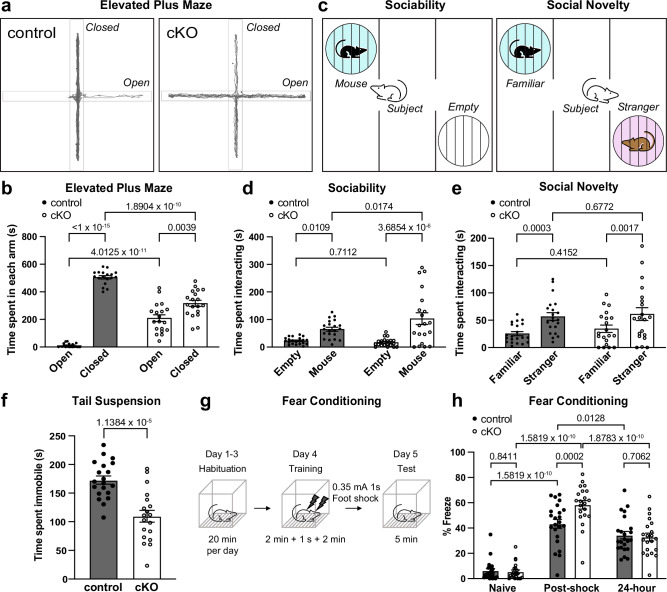
The bipolar disorder (BD) risk gene ANK3 encodes the scaffolding protein AnkyrinG (AnkG). In neurons, AnkG regulates polarity and ion channel clustering at axon initial segments and nodes of Ranvier. Disruption of neuronal AnkG causes BD-like phenotypes in mice. During development, AnkG is also expressed at comparable levels in oligodendrocytes and facilitates the efficient assembly of paranodal junctions. However, the physiological roles of glial AnkG in the mature nervous system, and its contributions to BD-like phenotypes, remain unexplored. Here, we show that oligodendroglia-specific AnkG conditional knockout results in destabilization of axoglial interactions in aged but not young adult mice. In addition, these mice exhibit significant histological, electrophysiological, and behavioral pathophysiologies. Unbiased translatomic profiling reveals potential compensatory machineries. These results highlight the functions of glial AnkG in maintaining proper axoglial interactions throughout aging and suggest a contribution of glial AnkG to neuropsychiatric disorders.


Conflict of interest statement

Competing interests: The authors declare no competing interests.

Figures

Fig. 1
Fig. 1. Loss of oligodendroglial AnkG leads to destabilization of paranodal junctions during aging.
a Schematic of the Ank3 conditional allele and NG2Cre-mediated recombination. b Immunoblot for AnkG in whole brain homogenates from 2 month-old control (Ank3F/F), AnkG cHT (NG2Cre+;Ank3F/+), and AnkG cKO (NG2Cre+;Ank3F/F) animals. All three major isoforms of AnkG (480 kDa, 270 kDa, 190 kDa) are detected. β-Actin is the loading control. c Densitometry analysis of AnkG (270 and 190 kDa isoforms) in the brains of 2 month-old control, cHT, and cKO mice. N = 4 for each genotype. Two-way ANOVA with multiple comparisons. 270 kDa WT vs cHT: t = 2.423, DF = 18.00; WT vs cKO: t = 2.084, DF = 18.00; cHT vs cKO: t = 4.507, DF = 18.00. 190 kDa WT vs cHT: t = 3.108, DF = 18.00; WT vs cKO: t = 5.445, DF = 18.00; cHT vs cKO: t = 2.337, DF = 18.00. d Representative immunofluorescence staining of AnkG and βIV spectrin in the optic nerve of 2 month-old control and cKO mice. Arrowheads indicate paranodes. Scale bar, 10 µm. (Cyan: AnkG, Magenta: βIV-spectrin) from at least 3 independent experiments. e Immunofluorescence labeling of nodal (Yellow: Neurofascin186), paranodal (Cyan: Caspr) and juxtaparanodal (Magenta: Kv1.2) proteins in the spinal cord of 14 month-old control and cKO mice. Severe paranodal unwinding is only observed in the large-diameter axons. From at least 3 independent experiments. Scale bar, 10 µm. fg Line-scan analysis of nodes of Ranvier on large-diameter axons of control (f) and cKO (g) mice. Black: Neurofascin186, cyan: Caspr, magenta: Kv1.2. h Quantification of the frequency of paranodal abnormalities (unwinding of Caspr and invasion of Kv1.2 into paranodes) in large- and small-diameter axons. Two-way ANOVA with multiple comparisons. Large diameter: t = 6.293, DF = 18.00, N = 5; small diameter: t = 0.9374, DF = 18.00, N = 6. Data are plotted as Mean±SEM. Each data point represents an individual animal. All p-values are labeled on the graphs. Source data are provided as a Source Data file.
Fig. 2
Fig. 2. Loss of paranodal AnkG leads to more nodes of Ranvier.
a Immunoblot of paranodal components Caspr, Contactin, and Neurofascin in whole spinal cord homogenates from 14 month-old control and cKO mice (run on 6% SDS-PAGE). β-Actin is used as the loading control (run separately on 14% SDS-PAGE). b-e Densitometry analysis of relative expression of Caspr (b), Contactin (c), NF186 (d) and NF155 (e) in the spinal cord of control and cKO mice. N = 7 for each genotype unless otherwise stated. Caspr: Unpaired t-test with 1 outlier in cKO is removed, two-tailed. t = 0.008603, DF = 11; Contactin: Unpaired t-test, two-tailed. t = 2.380, DF = 12; NF186: Unpaired t-test with 1 outlier in cKO removed, two-tailed. t = 4.376, DF = 11; NF155: Unpaired t-test with Welch’s correction, two-tailed. t = 0.9990, DF = 6.887. f Quantification of the ratio of NF155 to NF186 in the spinal cord of 14 month-old control and cKO mice. N = 7 for each genotype. Unpaired t-test, two-tailed. t = 3.099, DF = 12. g Nearest neighbor analysis of nodes of Ranvier in the optic nerve of 14 month-old control and cKO mice. N = 3 for each genotype. Unpaired t-test, two-tailed. t = 5.629, DF = 4. h Frequency distribution of distance between nearest nodes of Ranvier in the optic nerve of 14 month-old control and cKO mice. n = 7703 nodes from 3 control mice, and n = 13096 nodes from 3 cKO mice. Data are plotted as Mean±SEM. Each data point represents an individual animal. All p-values are labeled on the graphs. Source data are provided as a Source Data file.
Fig. 3
Fig. 3. Loss of oligodendroglial AnkG leads to thinner myelin.
a Representative images of transmission electron microscopy (TEM) analysis in the optic nerves of 16 month-old control, cHT and cKO mice. Scale bar, 1 μm. For each animal, more than 15 images were analyzed. b Scatter plot of g-ratio with axon diameter. Each data point represents an individual axon. n = 193 axons from one control and 187 axons from one cKO mice. Simple linear regression. c Quantification of g-ratio of axons in the optic nerves of 16 month-old control and cKO mice. Data are plotted as Mean±SEM. Each data point represents an individual axon. n = 191 axons from one control and 186 axons from one cKO mice. Two outliers from control and one outlier from cKO are excluded. Unpaired t-test, two-tailed. t = 3.708, DF = 375. d Immunostaining of CC1+ mature oligodendrocytes and myelin basic protein (MBP) in the optic nerve of 14 month-old control and cKO mice. Scale bar, 100 μm. e Quantification of relative density of CC1+ oligodendrocytes in the optic nerve of 14 month-old control and cKO mice. N = 3 for each genotype. Unpaired t-test, two-tailed. t = 0.2213, DF = 4. f Quantification of relative fluorescence intensity of MBP in the optic nerve of 14 month-old control and cKO mice. N = 5 for each genotype. Unpaired t-test, two-tailed. t = 2.788, DF = 8. g Immunoblot of whole spinal cord homogenates from 14 month-old control and cKO mice. β-Actin is used as the loading control (14% SDS-PAGE). h Densitometry analysis of relative expression of MBP in the spinal cord of 14 month-old control and cKO mice. N = 7 for each genotype. Unpaired t-test, two-tailed. t = 3.374, DF = 12. Data are plotted as Mean±SEM. Each data point represents an individual animal. Source data are provided as a Source Data file.
Fig. 4
Fig. 4. Loss of oligodendroglial AnkG results in slower conduction velocity of compound action potential.
a Representative compound action potential (CAP) traces recorded from freshly dissected 14 month-old optic nerves with suction electrodes ex vivo. Black: control, Magenta: cKO. b The overall CAP velocity is calculated using the following formula: VCAP= Length of optic nerve / (TVmax – TV0). N = 7 for control, N = 8 for cKO. Mann-Whitney test, two-tailed. U = 10. c Three Gaussian curves are fitted under each trace to differentiate fast-, medium- and slow-conducting axons. cKO optic nerves show a slower conduction velocity in all three groups of axons. N = 7 for control, N = 8 for cKO. Two-way ANOVA with multiple comparisons. Fitted Gaussian curve #1: t = 2.435, DF = 10.10; #2: t = 3.012, DF = 10.35; #3: t = 2.698, DF = 12.85. Data are plotted as Mean±SEM. Each data point represents an individual optic nerve. All p-values are labeled on the graphs. Source data are provided as a Source Data file.
Fig. 5
Fig. 5. Disruption of paranodal junction and myelination leads to astrogliosis and Purkinje cell death in AnkG cKO mice.
a Immunofluorescence staining of GFAP in the spinal cord of 14 month-old control and cKO mice. Scale bar, 50 µm. White matter region is zoomed in on the right. Scale bar, 10 µm. b Quantification of relative fluorescence intensity of GFAP in the spinal cord of 14 month-old control and cKO mice. N = 6 for each genotype. Unpaired t-test, two-tailed. t = 5.968, DF = 10. c Immunoblot of GFAP in the whole spinal cord homogenates of 14 month-old control and cKO mice. β-Actin is used as loading control. Experiments are repeated three times. d Immunofluorescence staining of Calbindin in the cerebellum of 14 month-old control and cKO mice. I – X label each lobule of the cerebellum. Asterisks indicate lobules with significant Purkinje cell death. Scale bar, 50 µm. Lobule IV is zoomed in on the right. Scale bar, 10 µm. e Quantification of Purkinje neuron density. N = 3 for each genotype. Unpaired t-test, two-tailed. t = 3.819, DF = 4. f Immunoblot of Calbindin in the cerebellar homogenates of 14 month-old control and cKO mice. β-Actin is used as loading control. Experiments are repeated three times. Data are plotted as Mean±SEM. Each data point represents an individual animal. All p-values are labeled on the graphs. Source data are provided as a Source Data file.
Fig. 6
Fig. 6. Loss of oligodendroglial AnkG is detrimental to survival, growth, and locomotion.
a cKO mice show postnatal lethality with incomplete penetrance. Chi-square test, two-tailed. b A representative image of male 14 month-old control and cKO mice. c Quantification of body weight in both sexes. Two-way ANOVA with multiple comparisons. 10 weeks: t = 2.551, DF = 96.00, N = 10 for control, N = 9 for cKO; 20 weeks: t = 6.192, DF = 96.00, N = 6 for control, N = 10 for cKO; 30 weeks: t = 11.46, DF = 96, N = 17 for control, N = 18 for cKO; 40 weeks: t = 9.857, DF = 96.00, N = 12 for control, N = 7 for cKO; 50 weeks: t = 11.74, DF = 96.00, N = 8 for control, N = 9 for cKO. d Representative image of hind-foot prints for gait analysis. eg Quantification of stride (e), sway (f), and stance (g) in mice older than 40 week-old of both sexes. N = 12 for control, N = 9 for cKO. Stride: Unpaired t-test with Welch’s correction, two tailed. t = 7.179, DF = 16.66; Sway: Unpaired t-test with Welch’s correction, two tailed. t = 11.22, DF = 16.17; Stance: Unpaired t-test, two-tailed. t = 12.74, DF = 19. h Representative track plots showing the center of 40 week-old male mice during a 10-minute open field test. i Quantification of distance traveled by both sexes (30 to 50 week-old). N = 21 for control, N = 20 for cKO. Unpaired t-test with Welch’s correction, two-tailed. t = 4.201, DF = 31.21. j Quantification of time spent in the inner zone. N = 21 for control, N = 20 for cKO. Whitney test, two-tailed. U = 209. Data are plotted as Mean±SEM. Each data point represents an individual animal. All p-values are labeled on the graphs. Source data are provided as a Source Data file.
Fig. 7
Fig. 7. Loss of oligodendroglial AnkG leads to altered sociability, anxiety, and learnt helplessness.
a Representative track plots showing the position of the center of the animal during a 10-minute elevated plus maze test. Left: 50 week-old female control mouse. Right: 50 week-old female cKO mouse. b Quantification of total time spent in the open arms by both male and female control and cKO mice that are between 30 and 50 week-old. N = 18 for control, N = 19 for cKO. Two-way ANOVA with multiple comparisons. controlopen vs controlclosed: t = 13.90, DF = 35.00; cKOopen vs cKOclosed: t = 3.089, DF = 35.00; controlopen vs cKOopen: t = 7.814, DF = 70.00; controlclosed vs cKOclosed: t = 7.448, DF = 70.00. c Illustration of three-chamber social tests for sociability and social novelty. d Quantification of sociability of both male and female control and cKO mice that are between 30- and 50 week-old by time spent interacting with mouse versus empty cage. N = 21 for control, N = 20 for cKO. Two-way ANOVA with multiple comparisons. controlempty vs controlmouse: t = 2.675, DF = 39.00; cKOempty vs cKOmouse: t = 5.386, DF = 39.00; controlempty vs cKOempty: t = 0.3716, DF = 78.00; controlmouse vs cKOmouse: t = 2.429, DF = 78.00. e Social novelty measured by time spent with stranger versus familiar mice. N = 21 for control, N = 20 for cKO. Two-way ANOVA with multiple comparisons. controlfamiliar vs controlstranger: t = 4.0090, DF = 39.00; cKOfamiliar vs cKOstranger: t = 3.365, DF = 39.00; controlfamiliar vs cKOfamiliar: t = 0.8191, DF = 78.00; controlstranger vs cKOstranger: t = 0.4179, DF = 78.00. f Quantification of immobility during the tail suspension test. N = 20 for control, N = 19 for cKO. Unpaired t-test, two-tailed. t = 5.069, DF = 37. g Illustration of contextual fear conditioning test for learning and memory. h Percentage of time spent freezing. N = 23 for control, N = 21 for cKO. Two-way ANOVA with multiple comparisons. controlnaïve vs cKOnaïve: q = 0.284, DF = 126.0; controlpost-shock vs cKOpost-shock: q = 5.370, DF = 126.0; control24-hour vs cKO24-hour: q = 0.534, DF = 126.0. controlnaïve vs controlpost-shock: q = 16.987, DF = 84.00; controlpost-shock vs control24-hour: q = 4.111, DF = 84.00; cKOnaïve vs cKOpost-shock: q = 23.161, DF = 84.00; cKOpost-shock vs cKO24-hour: q = 11.164, DF = 84.00. All data are plotted as Mean±SEM. Each data point represents an individual animal. Source data are provided as a Source Data file.
Fig. 8
Fig. 8. Loss of AnkG from adult mice causes mild deficits.
a Illustration of inducible loss of AnkG from oligodendrocytes in NG2CreERTM;Ank3 F/F mice (AnkG icKO). b-c Immunofluorescence staining of AnkG in the optic nerve of 3 month-old AnkG icKO mice (b) with littermate control (c). Experiments were performed three times. Scale bar, 10 µm. d, e Immunofluorescence staining in the optic nerve of 3 month-old AnkG icKO mice (d) with littermate control (e). Yellow: AnkG, Cyan: Caspr, Magenta: Kv1.2. f Body weight of AnkG icKO vs control mice. N = 21 for each genotype. Unpaired t-test, two-tailed. t = 0.4449, DF = 40. Experiments were performed three times. Scale bar, 10 µm. g-I Gait analyses of AnkG icKO vs control mice. N = 21 for each genotype. Stride: Unpaired t-test, two-tailed. t = 0.3321, DF = 40; Sway: Mann-Whitney test, two-tailed. U = 186; Stance: Unpaired t-test, two-tailed. t = 1.629, DF = 40. j, k Open field test. N = 20 for control, N = 21 for icKO. Distance traveled: Unpaired t-test, two-tailed. t = 0.3275, DF = 39; Time in inner zone: Mann-Whitney test, two-tailed. U = 170. l Latency to fall from the accelerating rotarod. N = 20 for each genotype. Two-way ANOVA with multiple comparisons. control vs icKO day1: t = 1.854, DF = 36.46. day2: t = 2.079, DF = 33.45. day3: t = 0.8175, DF = 37.76. m Immobility during the suspension test. N = 20 for control, N = 17 for icKO. Unpaired t-test, two-tailed. t = 2.114, DF = 35. n Time spent in open and closed arms during the elevated-plus-maze test. N = 18 for control, N = 20 for icKO. Two-way ANOVA with multiple comparisons. controlclosed vs controlopen: t = 71.11, DF = 72.00. icKOclosed vs icKOopen: t = 71.11, DF = 72.00. controlclosed vs icKOclosed: t = 1.102, DF = 72.00. controlopen vs icKOopen: t = 1.102, DF = 72.00. o Three-chamber test of sociability. N = 18 for control, N = 19 for icKO. Two-way ANOVA with multiple comparisons. controlempty vs controlmouse: t = 16.603, DF = 35.00, p < 1 ×10-15. icKOempty vs icKOmouse: t = 10.861, DF = 35.00. controlempty vs icKOempty: t = 0.958, DF = 70.00. controlmouse vs icKOmouse: t = 5.065, DF = 70.00. p Three-chamber test of social novelty. N = 18 for control, N = 19 for icKO. Two-way ANOVA with multiple comparisons. controlfamiliar vs controlstranger: t = 3.066, DF = 35.00. icKOfamiliar vs icKOstranger: t = 2.182, DF = 35.00. familiarcontrol vs icKOcontrol: t = 0.027, DF = 70.00. controlstranger vs icKOstranger: t = 0.982, DF = 70.00. Data are plotted as Mean±SEM. Data points represent an individual animal. Source data are provided as a Source Data file.
Fig. 9
Fig. 9. Translatomic profiling of AnkG-deficient oligodendrocytes reveals compensatory cytoskeletal mechanisms.
a Illustration of the experimental design for translatomic profiling in NG2+ oligodendroglial-lineage cells. b Immunofluorescence staining of HA-tagged ribosome and MBP in the coronal brain section of a 3 month-old NG2CreERTM;RiboTag mouse. (Cyan: HA, Magenta: MBP). Experiments are performed in three animals. Scale bar, 50 μm. c Relative enrichment of major cell-type markers (oligodendrocytes: Olig2, astrocytes: Aldh1l1, neurons: NeuN) by HA-IP in NG2CreERTM;RiboTag mice. Data are plotted as Mean±SEM. Data points represent individual animals (N = 3). d Relative enrichment of major AnkG isoforms (190 kDa, 270 kDa, 480 kDa) by HA-IP versus input in NG2CreERTM;RiboTag mice. Data are plotted as Mean±SEM. Each data point represents an individual animal (N = 3, except N = 2 for AnkG480 as Cq is undetectable in one IP sample). e Volcano plot of differentially expressed genes between AnkG icKO IP sample and control IP sample. Magenta dots represent significantly upregulated genes, blue dots represent significantly downregulated genes, and gray dots represent genes that are not statistically differentially expressed (dashed lines: log10(pvalue)=2 and log2FC∣=1). Differential gene expression analysis was performed using edgeR under a negative binomial generalized linear model with quasi-likelihood dispersion estimates, assuming an FDR < 0.1 as significant. Genes-of-interest are labeled individually (Blue: oligodendrocyte-specific genes. Magenta: cytoskeletal components. Black: other relevant genes-of-interest). f Immunoblot of AnkB and spectrins from 14 month-old cKO and control mouse brain. Experiments were performed three times. g, h Immunofluorescence labeling of AnkB (magenta) with βIV-spectrin (cyan) in the optic nerve of 6 month-old (g) and 14 month-old (h) control and cKO mice. Experiments were performed in replicates. Scale bar, 50 μm and 10 μm, respectively. Solid arrowheads indicate nodes of Ranvier. Empty arrowheads indicate AnkB+ paranodes. i Gene ontology analysis of significantly enriched differentially regulated cellular component (CC, solid bar) and molecular functions (MF, empty bar) in AnkG icKO RiboTag vs control RiboTag mice. Adjusted p-value is calculated based on clusterProfiler and pathview. Downregulated CC and MF (blue), and upregulated CC and MF (magenta). Enrichment scores are calculated by log10(pvalue). Source data are provided as a Source Data file.

Update of

References

    1. Hedstrom, K. L., Ogawa, Y. & Rasband, M. N. AnkyrinG is required for maintenance of the axon initial segment and neuronal polarity. J. Cell Biol.183, 635–640 (2008). - PMC - PubMed
    1. Zhou, D. et al. AnkyrinG is required for clustering of voltage-gated Na channels at axon initial segments and for normal action potential firing. J. Cell Biol.143, 1295–1304 (1998). - PMC - PubMed
    1. Stevens, S. R. & Rasband, M. N. Pleiotropic ankyrins: scaffolds for ion channels and transporters. Channels (Austin)16, 216–229 (2022). - PMC - PubMed
    1. Jenkins, P. M. et al. Giant ankyrin-G: a critical innovation in vertebrate evolution of fast and integrated neuronal signaling. Proc. Natl Acad. Sci. USA112, 957–964 (2015). - PMC - PubMed
    1. Rasband, M. N. & Peles, E. Mechanisms of node of Ranvier assembly. Nat. Rev. Neurosci.22, 7–20 (2021). - PubMed

Publication types

Associated data