. 2024 Dec 30;15(1):10878.
doi: 10.1038/s41467-024-55231-9.

Parallel single-cell metabolic analysis and extracellular vesicle profiling reveal vulnerabilities with prognostic significance in acute myeloid leukemia

Affiliations

Parallel single-cell metabolic analysis and extracellular vesicle profiling reveal vulnerabilities with prognostic significance in acute myeloid leukemia

Dorian Forte et al. Nat Commun. .

Abstract

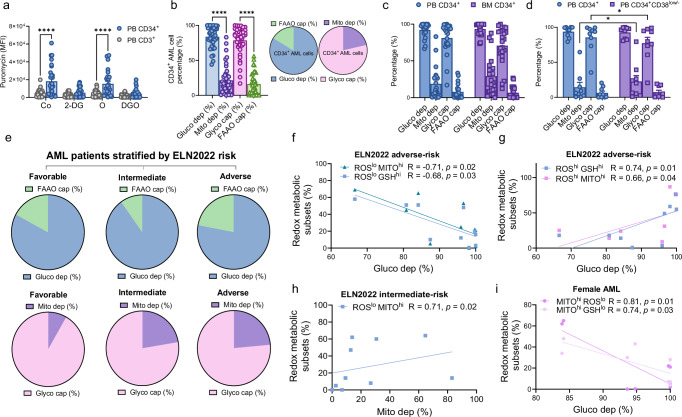
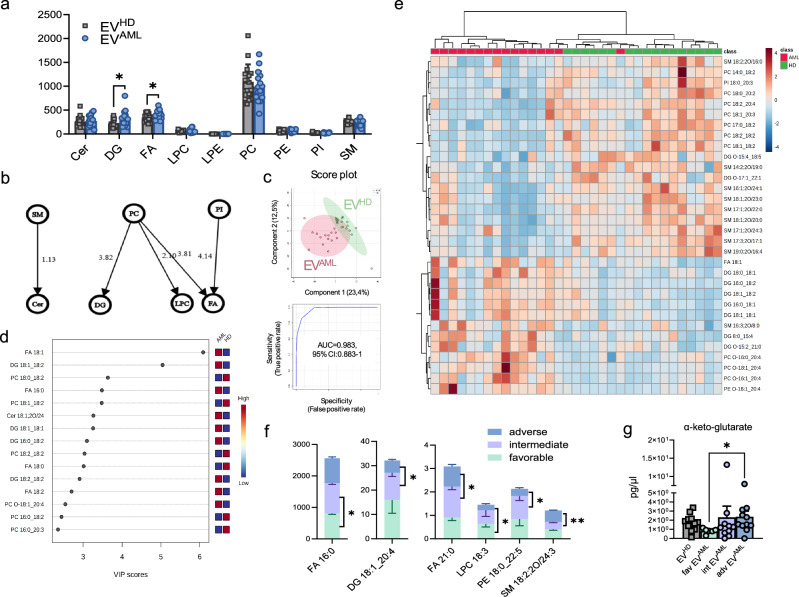
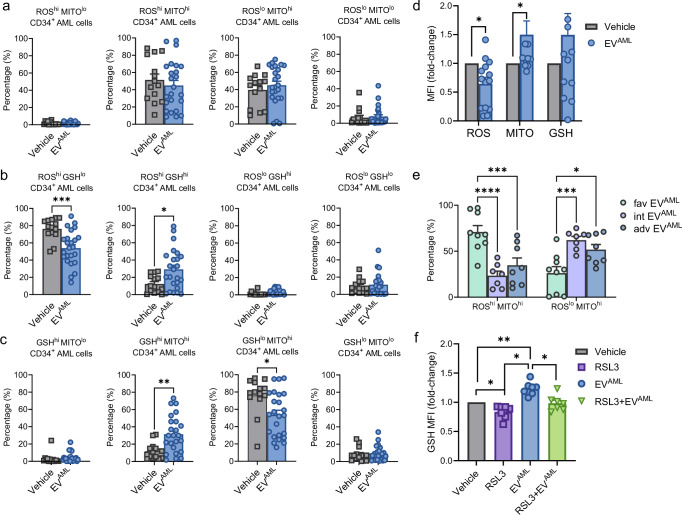
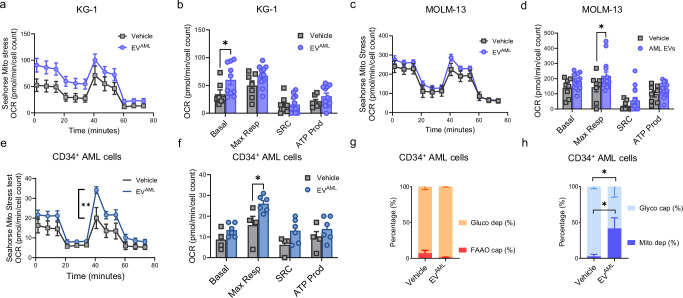
Acute myeloid leukemia (AML) is an aggressive disease with a high relapse rate. In this study, we map the metabolic profile of CD34+(CD38low/-) AML cells and the extracellular vesicle signatures in circulation from AML patients at diagnosis. CD34+ AML cells display high antioxidant glutathione levels and enhanced mitochondrial functionality, both associated with poor clinical outcomes. Although CD34+ AML cells are highly dependent on glucose oxidation and glycolysis for energy, those from intermediate- and adverse-risk patients reveal increased mitochondrial dependence. Extracellular vesicles from AML are mainly enriched in stem cell markers and express antioxidant GPX3, with their profiles showing potential prognostic value. Extracellular vesicles enhance mitochondrial functionality and dependence on CD34+ AML cells via the glutathione/GPX4 axis. Notably, extracellular vesicles from adverse-risk patients enhance leukemia cell engraftment in vivo. Here, we show a potential noninvasive approach based on liquid 'cell-extracellular vesicle' biopsy toward a redefined metabolic stratification in AML.


Conflict of interest statement

Competing interests: The authors declare no competing interests. Ethics: The research was approved by the institutional review board of the Area Vasta Emilia Centro (AVEC) Ethical Committee (approval code: 94/2016/O/Tess).

Figures

Fig. 1
Fig. 1. Redox metabolic profile of CD34+ AML cells from fresh whole blood.
ac On the left, representative dot plots illustrating the gating strategy used to profile CD34+ cells based on CD3+ cells for paired staining combinations of CellROX (ROS), MitoTracker CMXRos (MITO) and Thiol Tracker (GSH). On the right, percentages of CD34+ cells stained for ROS/MITO (a; p = 0.02, p < 0.0001, p = 0.03, p = 0.03, p = 0.02), ROS/GSH (b; p = 0.007, p = 0.0002), and GSH/MITO (c; p < 0.0001, p = 0.001, p = 0.001, p = 0.005, p = 0.005) in the blood of AML patients at diagnosis (n = 62). One-way ANOVA with Tukey’s correction for multiple comparison. Graphs for profiling AML CD34+ cells from paired PB versus BM whole blood according to ROS/MITO (d), ROS/GSH (e), and GSH/MITO (f) combinations (n = 31). Two-way ANOVA with Šidák’s multiple comparisons test. g Graph reporting sex differences in the following CD34+ cell fractions: GSHlo MITOhi (p = 0.04), ROShi MITOlo (p = 0.02), GSHhi MITOlo (p = 0.05) considering female AML patients (n = 26) versus male AML patients (n = 37). Mann-Whitney unpaired t-test. h Heatmap reporting the mean percentage differences for ROS, MITO, and GSH in CD34+ cells considering both high and low expression for each marker in AML patients stratified by ELN risk. ik Metabolic profile of AML CD34+ cells in the same AML patients stratified by ELN risk (favorable, n = 6; intermediate, n = 28; adverse, n = 27) for ROS/MITO (i; p = 0.04, p = 0.04), ROS/GSH (p = 0.03) and GSH/MITO (k). Two-way ANOVA with Dunnett’s multiple comparison test. For all panels (*) p < 0.05; (**) p < 0.01; (***) p < 0.001; (****) p < 0.0001. Data presented as mean values ± SEM. Source data are provided as a Source Data file.
Fig. 2
Fig. 2. Metabolic capacities and dependencies of CD34+ AML cells from fresh blood of AML patients at diagnosis using the SCENITH method.
a Translation level expressed by puromycin value (anti-Puro gMFI) after inhibition of metabolic pathways with Co (control, vehicle; p < 0.0001), 2-deoxy-D-glucose (2DG), oligomycin A (O; p < 0.0001) or both (DGO) comparing paired AML CD34+ and CD3+ cells from each patient (AML patients, n = 29). Two-way ANOVA with Šidák’s multiple comparisons test. b Metabolic profile of AML CD34+ cells expressed in percentages with the corresponding pie charts representative of two-by-two dependent parameters measured, namely, glucose dependence (gluco dep) with fatty acid and AA oxidation capacity (FAAO cap) and mitochondrial dependence (mito dep) with glycolytic capacity (glyco cap) (n = 42; p < 0.0001). One-way ANOVA with Tukey’s multiple comparison test. c Metabolic parameters according to the source, comparing paired AML PB CD34+ cells versus BM CD34+ cells (n = 22). d Differences in metabolic parameters between AML PB CD34+ and paired PB CD34+CD38low/- (n = 9) (p = 0.04; p = 0.04). Two-way ANOVA with Šidák’s multiple comparisons test (c, d). e Pie charts representing the metabolic profile in AML patients stratified according to ELN risk (favorable, n = 6; intermediate, n = 18; adverse, n = 19). f Inverse correlations between glucose dependence (%) in AML CD34+ cells measured by SCENITH and the percentages of ROSlo MITOhi (R = −0.71, p = 0.02) or ROSlo GSHhi (R = −0.68, p = 0.03) CD34+ cells from adverse-risk AML patients (n = 10). g Positive correlations between glucose dependence (%) in AML CD34+ cells with ROShi GSHhi (R = 0.74, p = 0.01) and ROShi MITOhi (R = 0.66 and p = 0.04) CD34+ cells from adverse-risk AML patients (n = 9). h Positive association between ROSlo MITOhi CD34+ cells and mitochondrial dependence (%) of CD34+ cells from intermediate-risk AML patients (R = 0.71, p = 0.02) (n = 10). i Inverse associations between MITOhi ROSlo CD34+ cells (R = 0.81, p = 0.01) and MITOhi GSHlo (R = 0.74, p = 0.03) in female AML patients (n = 8). Spearman’s test reported correlations. For all panels (*) p < 0.05; (****) p < 0.0001. Data are presented as mean values ± SEM. Source data are provided as a Source Data file.
Fig. 3
Fig. 3. General characterization of circulating EVAML in comparison to EVHD.
a, b Representative histograms of plasma-derived EV distributions measured by NTA for EVHD (n = 18) and EVAML (n = 20). c Summary table report of NTA data for each group. NTA results present the total number of particles per ml as well as the average median size and mode. Size distribution where 10% (D10), 50% (D50), and 90% (D90) of the sample is also reported. d Plasma-derived EV size measured by NTA (p = 0.004) and EV protein content measured using Bradford’s assay (p = 0.03) from AML patients (n = 20 for EV size; n = 18 for protein content) and HD (n = 18 for EV size; n = 11 for protein content). e Representative western blot analysis of specific EV markers (namely, Flotillin-1, TSG101, CD81, ARF6) and the antioxidant GPX3 in two individuals per group (n = 2 biological replicates for each group). Uncropped scans of Western blots in the figures are provided as a Source Data file. Significant differences were reported using the Mann–Whitney test for unpaired samples with (*) p < 0.05 and (**) p < 0.01 considered significant. Data are presented as mean values ± SEM.
Fig. 4
Fig. 4. Protein surface signatures on circulating EVs from HD and AML patients.
a Heatmap of the expression of 37 EV surface markers expressed on EVHD (n = 12) and EVAML (n = 41). b Background-corrected median APC fluorescence intensity for surface markers significantly different comparing EVHD (squares in gray; n = 12) and EVAML (circles in blue; n = 41): CD4 (p = 0.0007), CD14 (p = 0.0045), CD40 (p = 0.04), CD41b (p = 0.0005), CD42a (p = 0.003), CD44 (p < 0.0001), CD62P (p = 0.001), CD105 (p = 0.007), CD133-1 (p = 0.009), CD209 (p = 0.01), HLA-DRDPDQ (p = 0.008), and ROR1 (p = 0.004); c Area under the ROC curve for EV CD44 expression to discriminate AML patients (n = 41) versus HD subjects (n = 12) (AUC = 0.9; p = 0.0001). d Background-corrected median APC fluorescence intensity for surface markers (CD2, CD8, CD49e, CD146) significantly different in favorable-risk AML patients compared to intermediate-risk patients (p = 0.03, p = 0.01, p = 0.007, p = 0.04) or adverse-risk patients (p = 0.04). Two-way ANOVA with Tukey’s multiple comparison test. e Heatmap for the expression of 37 EV surface markers expressed on EVAML from patients stratified according to the ELN risk stratification: favorable-risk (n = 7), intermediate-risk (n = 18), and adverse-risk AML patients (n = 16). f Spearman’s correlations between CD14 MFI on EVAML from intermediate-risk patients (R = 0.66, p = 0.03; n = 11) or adverse-risk patients (R = −0.88, p = 0.003; n = 8) with glucose dependence (%) reported on AML CD34+ cells measured using SCENITH. g Spearman’s correlations between CD209 MFI on EVAML from intermediate-risk patients (R = 0.63, p = 0.04; n = 11) or adverse-risk patients (R = −0.94, p = 0.0004; n = 8) with glucose dependence (%) reported on AML CD34+ cells. Significant markers between HD and AML-derived EVs were reported as (*) p < 0.05, (**) p < 0.01, (***) p < 0.001, and (****) p < 0.001 using the Mann–Whitney test for unpaired samples or one-way ANOVA with Tukey’s multiple comparison test unless stated. Data are presented as mean values ± SEM. Source data are provided as a Source Data file.
Fig. 5
Fig. 5. Lipidomic analysis of EVs.
a Graph for the nine lipid classes detected in EVAML (n = 16) and EVHD (n = 17) (p = 0.01 for DG and p = 0.03 for FA). b Network of transformations between lipid classes. The lines connecting the nodes indicate the interaction’s direction and status. The numbers (z-score) indicate the intensity of the reaction on an arbitrary scale. c Partial least squares-discriminant analysis (PLS-DA) for lipid species differentially expressed in EVAML compared to EVHD and multivariate ROC analysis of the EV lipidomic dataset between AML patients and HD (AUC = 0.98). d Variable importance in projection (VIP) scores of PLS-DA for lipid species in EVAML and EVHD. The colored boxes on the right indicate the relative concentrations of the corresponding lipid species (red for high; yellow for intermediate and blue for low levels). e Corresponding heatmap for lipid species. f Selected lipid species levels differentially expressed in EVs, namely, FA 16:0 (p = 0.04), LPC 18:3 (p = 0.04), DG 18:1_20:4 (p = 0.01), FA 21:0 (p = 0.04), PE 18:0_22:5 (p = 0.03) and SM 18:2;20/24:3 (p = 0.006), according to ELN risk status: favorable (n = 3), intermediate (n = 6) and adverse (n = 5) risk. Graphs are obtained based on the data matrix normalized by the median and autoscaled. Significant markers were reported as (*) p < 0.05, (**) p < 0.01 by Mann–Whitney test for unpaired samples or two-way ANOVA with Sidak’s multiple comparisons tests. g Targeted metabolomic data on EVAML (n = 27) versus EVHD (n = 12). TCA cycle intermediate α-ketoglutarate expressed as pg/µl between favorable (n = 6), intermediate (n = 10), and adverse (n = 11) EVAML (p = 0.03). A significant difference was reported by the Kruskal-Wallis test with Dunn’s post-test. Data are presented as mean values ± SEM. Source data are provided as a Source Data file.
Fig. 6
Fig. 6. Redox metabolic profiling for OCI-AML3 and MOLM-13 treated for 24 h with EVAML from adverse, intermediate or favorable-risk AML patients and in vivo engraftment assay.
OCI-AML3 (a, b, c) or MOLM-13 cell lines (d, e, f) were treated with favorable EVAML (n = 10), intermediate EVAML (n = 8) or adverse EVAML (n = 8) from 8 independent biological experiments. ROS/MITO subsets expressed as percentages were reported for OCI-AML3 (a; p = 0.03) or MOLM-13 (d). Percentage of ROS/GSH subsets for OCI-AML3 (b; p = 0.002, p < 0.0001) and MOLM-13 (e). Percentages of GSH/MITO subsets for OCI-AML3 (c) and MOLM-13 (f; p = 0.04). af Two-way ANOVA reported significant differences with Dunnett’s multiple comparisons test. g MOLM-13 pre-treated with EVAML for 4 h before adding Venetoclax (150 nM) for 24 h. MOLM-13 were treated with vehicle or favorable EVAML (n = 3) or intermediate EVAML (n = 4) or adverse EVAML (n = 5) from 5 independent biological experiments. A significant difference was reported using the Mann–Whitney test for unpaired samples (p = 0.03). h, i Mice transplanted with luc-mCherry MOLM-13 cells pre-treated for 24 h with vehicle control (PBS, n = 5), adverse-risk EVAML (n = 5) or intermediate-risk EVAML (n = 5) or favorable-risk EVAML (n = 5). The graph shows the quantification of bioluminescence as the average total photon flux per second from days 6 to 18 after initiation (h). Whole-animal bioluminescence imaging from day 18. Ventral (left) and dorsal view images (right) from mice for each group are shown. Each animal’s region of interest (ROI) was defined at every time point (inset) (i). Two-way ANOVA with Tukey’s multiple comparison test. Data are presented as mean values ± SEM. Source data are provided as a Source Data file.
Fig. 7
Fig. 7. Redox metabolic phenotype of CD34+ AML cells in coculture with vehicle (PBS) or EVAML.
Percentages of CD34+ cells isolated from AML patients at diagnosis in coculture with vehicle (PBS) (n = 14) or EVAML (n = 24) for 24 h before staining for a ROS/MITO: ROShi MITOlo, ROShi MITOhi, ROSlo MITOhi, and ROSlo MITOlo subsets; b ROS/GSH to determine the ROShi GSHlo (p = 0.0006), ROShi GSHhi (p = 0.02), ROSlo GSHhi, and ROSlo GSHlo subsets; c GSH/MITO: GSHhi MITOlo, GSHhi MITOhi (p = 0.004), GSHlo MITOhi (p = 0.01), and GSHlo MITOlo subsets. Significant differences were reported as (*) p < 0.05, (**) p < 0.01, (***) p < 0.001 using the Mann–Whitney test for unpaired samples from 14 biological experiments. d The expression levels for ROS (n = 14; p = 0.02), MITO (n = 12; p = 0.02), and GSH (n = 13) in CD34+ cells treated with EVAML are expressed as MFI normalized to the MFI of untreated cells used as a control (MFI fold change). Significant differences were reported as (*) p < 0.05 using the Mann–Whitney test for unpaired samples. e Percentages of ROShi MITOhi (p < 0.0001 and p = 0.0004) and ROSlo MITOhi (p = 0.0007 and p = 0.01) for CD34+ AML cells treated with favorable EVAML (n = 9), intermediate EVAML (n = 7) or adverse EVAML (n = 8) from 10 independent experiments. Two-way ANOVA reported significant differences with Šidák’s multiple comparisons test. P values < 0.01 (**), <0.001 (***), <0.0001 (****) were considered significant. f gMFI for ThiolTracker of AML CD34+ cells treated for 24 h with vehicle (PBS), RSL3 (1 µM; p = 0.02), EVAML (p = 0.0003) or after pre-treatment with RSL3 (1 µM) for 6 h before adding EVAML (p = 0.0004 versus EVAML). The expression levels for each marker are expressed as gMFI normalized to the MFI of untreated cells used as a control (MFI fold change). One-way ANOVA with Tukey’s multiple comparisons (n = 7). P values < 0.05 (*) and <0.01 (**) were considered significant. Data are presented as mean values ± SEM. Source data are provided as a Source Data file.
Fig. 8
Fig. 8. Metabolic studies on leukemic cell lines (KG-1 and MOLM-13) or CD34+ AML cells isolated from AML patients in coculture with vehicle (PBS) or EVAML for 24 h.
ad Seahorse XFp Cell Mito Stress profile and analyses of KG-1 (n = 7 vehicle vs. n = 11 with EVAML) or MOLM-13 cells (n = 8 vehicle vs. n = 14 with EVAML); ac Oxygen consumption rate (OCR) for KG-1 (a) or MOLM-13 (c). Bioenergetic parameters extracted from the OCR plot: basal respiration (basal), maximal respiration (Max Resp), spare respiratory capacity (SRC), and ATP-linked OCR (ATP prod) for KG-1 (b; p = 0.03) and MOLM-13 cells (d; p = 0.04). e, f Seahorse XFp Cell Mito Stress profile of AML CD34+ cells and relative bioenergetic parameters extracted from the oxygen consumption rate (OCR) plot (n = 4 independent biological experiments; p = 0,001 and p = 0.02). g, h Metabolic profile using SCENITH in MNCs cocultured with vehicle (PBS) or EVAML and then stained for CD34+. Stacked graph with percentages of CD34+ cells using glucose dependence (gluco dep) or FAAO capacity on the left and glycolytic capacity or mitochondrial dependence (percentages) on the right (n = 4 vehicle vs. n = 6 with EVAML; p = 0.02) from 4 biological experiments. Statistical significance was reported by two-way ANOVA with Sidak’s multiple comparisons test or using the Mann–Whitney test for unpaired samples. Data are presented as mean values ± SEM. Source data are provided as a Source Data file.

References

    1. Döhner, K. & Döhner, H. Molecular characterization of acute myeloid leukemia. Haematologica93, 976–982 (2008). - PubMed
    1. Estey, E. H. Acute myeloid leukemia: 2021 update on risk-stratification and management. Am. J. Hematol.95, 1368–1398 (2020). - PubMed
    1. Levin, M., Stark, M., Ofran, Y. & Assaraf, Y. G. Deciphering molecular mechanisms underlying chemoresistance in relapsed AML patients: towards precision medicine overcoming drug resistance. Cancer Cell Int21, 53 (2021). - PMC - PubMed
    1. Forte, D. et al. Bone marrow mesenchymal stem cells support acute myeloid leukemia bioenergetics and enhance antioxidant defense and escape from chemotherapy. Cell Metab.32, 829–843.e829 (2020). - PMC - PubMed
    1. Culp-Hill, R., D’Alessandro, A. & Pietras, E. M. Extinguishing the embers: targeting AML metabolism. Trends Mol. Med.27, 332–344 (2021). - PMC - PubMed

Publication types