. 2024 Dec 30;15(1):10904.
doi: 10.1038/s41467-024-55291-x.

The Theranostic Genome

Affiliations

The Theranostic Genome

Xiaoying Xu et al. Nat Commun. .

Abstract

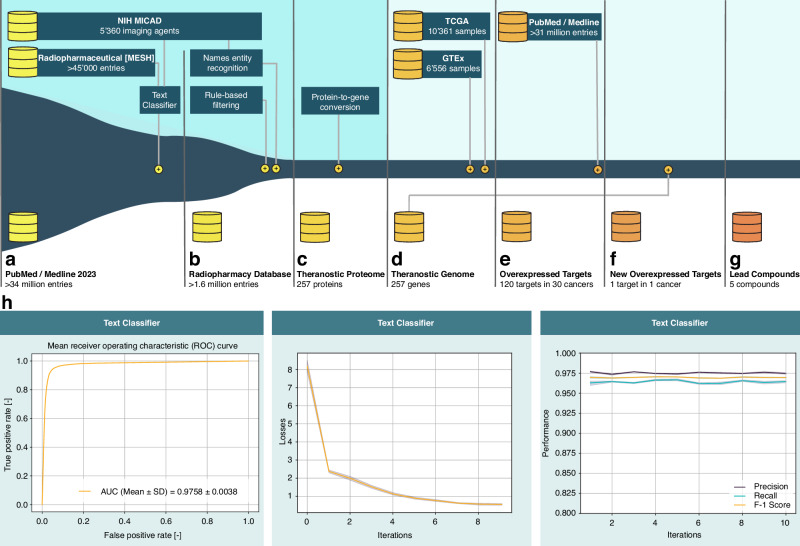
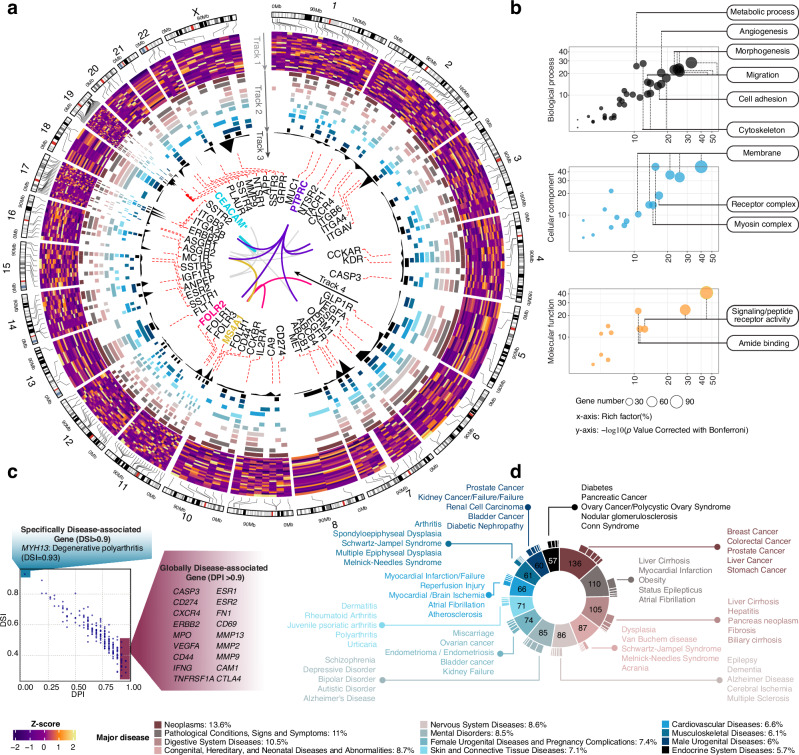
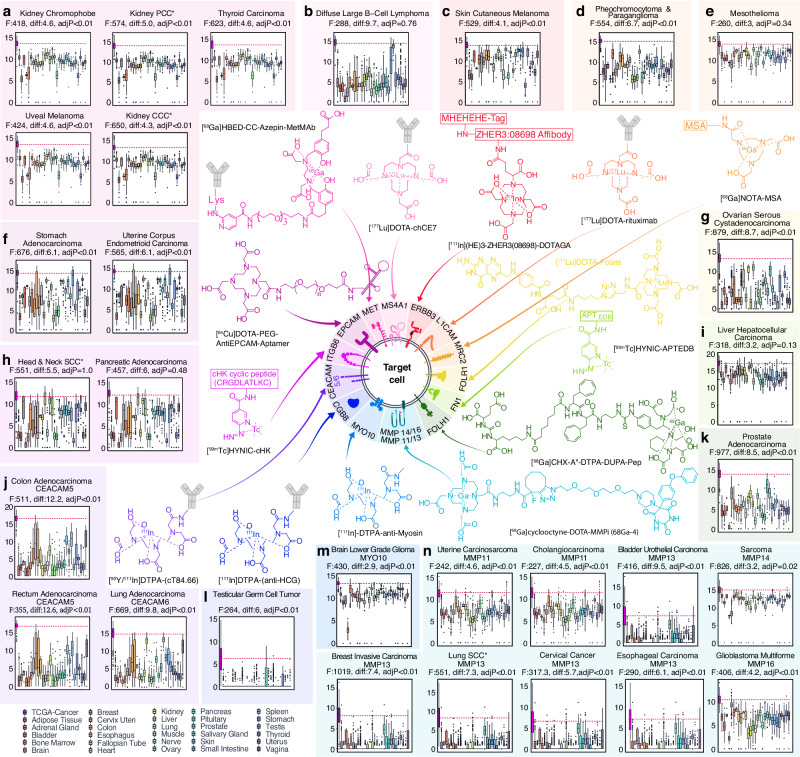
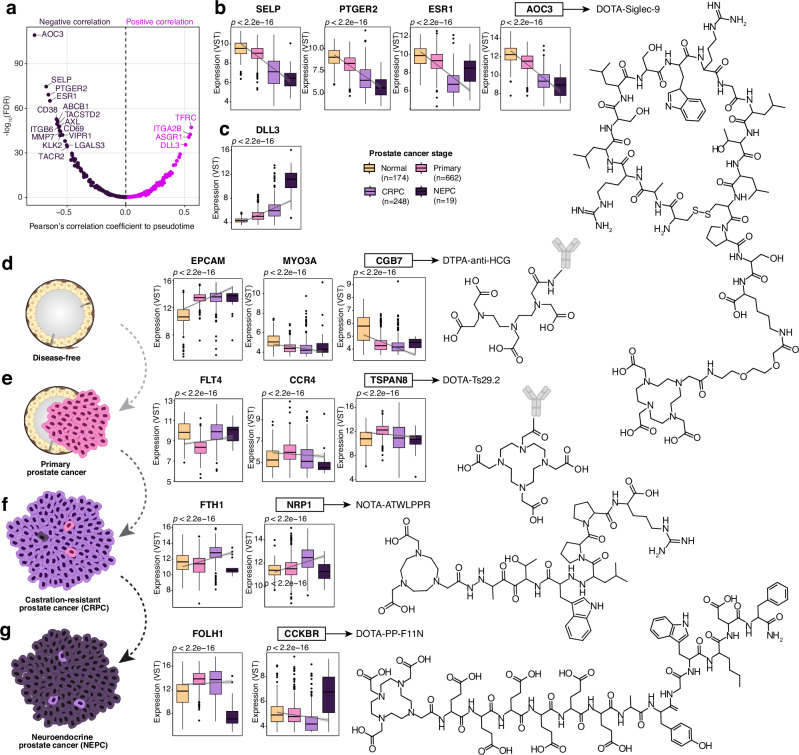
Theranostic drugs represent an emerging path to deliver on the promise of precision medicine. However, bottlenecks remain in characterizing theranostic targets, identifying theranostic lead compounds, and tailoring theranostic drugs. To overcome these bottlenecks, we present the Theranostic Genome, the part of the human genome whose expression can be utilized to combine therapeutic and diagnostic applications. Using a deep learning-based hybrid human-AI pipeline that cross-references PubMed, the Gene Expression Omnibus, DisGeNET, The Cancer Genome Atlas and the NIH Molecular Imaging and Contrast Agent Database, we bridge individual genes in human cancers with respective theranostic compounds. Cross-referencing the Theranostic Genome with RNAseq data from over 17'000 human tissues identifies theranostic targets and lead compounds for various human cancers, and allows tailoring targeted theranostics to relevant cancer subpopulations. We expect the Theranostic Genome to facilitate the development of new targeted theranostics to better diagnose, understand, treat, and monitor a variety of human cancers.


Conflict of interest statement

Competing interests: The authors declare no competing interests.

Figures

Fig. 1
Fig. 1. Data pipeline.
a We downloaded and parsed the entire baseline MEDLINE/PubMed dataset. b Then, we employed a text classifier that identified PubMed entries on radiotracer imaging and therapy, and a named entity recognizer that extracted radiotracers and their target proteins from the PubMed entries on radiotracer imaging and therapy. c We subsequently utilized filters to identify theranostic radiotracers and tracer-to-protein associations, thereby defining the Theranostic Proteome. d Then, we translated the names of the proteins to those of the coding genes, thereby establishing the Theranostic Genome. e Subsequently, we screened for high expression of all the theranostic genes in 10’361 samples from 32 different tumours to identify overexpressed targets. f Finally, we back-crossed the list of all theranostic genes that are overexpressed in tumour tissues with the entire baseline MEDLINE/PubMed dataset to identify theranostic targets that are new to oncology, as well as g the respective theranostic lead compounds. h text classifier training plots; from left to right: first, a receiver operating characteristic (ROC) curve demonstrating the trade-off between true and false positive rate, with a mean area under the curve (AUC) value of 0.9758 and a standard deviation of ±0.0038, indicating excellent classifier performance. Second, a loss function plot revealing the development of the loss value over the 10 training iterations. Third, a performance plot, showing the development of the performance metrics precision, recall, and F1 Score over the 10 training iterations.
Fig. 2
Fig. 2. The Theranostic Genome.
a A Circos plot distribution of 257 theranostic genes along their respective chromosome locations. The outermost layer displays the cytoband hg38. Grey to black bands - varying intensities of Giemsa staining; red bands - centromeric; blue bands - the short arm of acrocentric chromosomes. Track 1 - expression across 24 healthy organs (purple: high expression, dark green: low expression); Track 2 - gene–disease associations across 12 major diseases, using a color code that corresponds to the classifications shown in panel (c); Track 3 - number of radiotracers targeting each gene. The height of the black peak reflects the number of radiotracers (ranging from 1 to 130). Track 4 - genes targeted by over 30 radiotracers are labelled, connections to their co-expressed genes across the 24 healthy tissues are illustrated with blue, pink, yellow, and purple lines. CECAM*: CECAM3/4/5/6/7. b Gene ontology analysis processed by the Cytoscape App “ClueGo”,. The size of each dot represents the number of theranostic genes associated with each significantly enriched gene ontology (GO) term (levels 2–3). The molecular function, biological process and cellular component categories are displayed separately, with a Bonferroni corrected p value < 0.001 applied as a filtering criterion. Rich factor (%) - the ratio of theranostic genes in a GO category to the total number of input theranostic genes. c Disease classification processed based on DisGeNET data retrieved through the disgenet2r package. a nested pie chart depicting the distribution of theranostic genes. Genes with a disease pleiotropy index (DPI) > 0.9 or a disease specificity index (DSI) > 0.9 are highlighted. d The inner circle labels indicate the number of theranostic genes associated with each of the top 12 major diseases, while the outer circle identifies the five highest-ranked sub-diseases (based on gene associations) for each major disease. The width of each block corresponds to the ratio of total genes in a sub-disease to those in its major disease counterpart. The color coding for major diseases aligns with Track 2 in panel (a). Source data are provided as a Source data file.
Fig. 3
Fig. 3. Targeting the Theranostic Genome.
a A total of 242 theranostic genes were categorized into 13 major groups, each containing one or multiple protein families. be The binding affinities of tracers for theranostic gene products are shown as equilibrium dissociation (KD) values or half-maximal inhibitory concentration (IC50), measured in nM. The KD/IC50 values, detailed in Supplementary Data 1, were mapped onto the phylogenetic tree, with dot sizes corresponding to the KD/IC50 values. The significance of differences in KD/IC50 values across conditions is illustrated by boxplots. Dots are color-coded based on the following conditions: (b) 13 major protein families (degrees of freedom = 81, effect size η2 = 0.24); (c) peptide versus antibody (95% confidence interval [CI], 0.6–12.6); (d) small molecule versus large molecule (95% confidence interval [CI], 0.6–20.5); and (d) four reference year groups (degrees of freedom = 91, effect size η2 = 0.03. Multiple comparisons were conducted using Tukey’s HSD for the 13 groups, with the compact letters displayed atop each boxplot in panel (b). Groups with the same letter means they are not detectably different and groups that are detectably different get different letters. Groups with more than one letter reflects an overlap between the sets of groups. P values were determined using a two-sided Wilcoxon rank sum test for panels (c, d) and a one-way ANOVA test for panels (b and e). TNF - tumour necrosis factor, Tyr - tyrosine. Source data are provided as a Source data file. All boxplots display the median, first and third quartiles (25th and 75th percentiles), and two whiskers. All dots in panel (be) represent independent biological replicates.
Fig. 4
Fig. 4. The broad applicability of the Theranostic Genome in human cancers.
an Displayed boxplots of a representative theranostic gene with significantly elevated expression in a TCGA cancer tissue compared to 29 GTEX non-cancerous organs, followed by the illustration of the relevant theranostic gene product located on the cell membrane, and the chemical structure of a clinically available radiotracer targeting this theranostic gene product. For each boxplot, cancer type is specified on top. The x-axis represents, from left to right, the TCGA cancer tissue, (pink box to the far left) and the 29 GTEX non-cancerous organs (rainbow-colored boxes), and the y-axis represents the expression level of a theranostic gene (unit: log2 (norm_count+1)). The dashed red line indicates the average expression level of the representative theranostic gene in a TCGA cancer tissue. The expression of a theranostic gene can be induced in multiple TCGA cancers. So, the TCGA cancer types sharing a (or from the same gene family) representative theranostic gene are grouped, with the relevant boxplots, radiotracer chemical structures and gene products are highlighted with the same background color. i.e. a MET is a theranostic gene with significantly elevated expression in five TCGA cancers versus 29 GTEX normal organs. A radiotracer named [68Ga]HBED-CC-Azepin-MetMAb binds to the MET protein located on the cell membrane. PCC* - papillary cell carcinoma; CCC* - clear cell carcinoma; SCC* - squamous cell carcinoma; MSA* - (mannosylated human serum albumin). F and p values were calculated via one-way ANOVA, with corrections applied from Tukey’s honestly significant difference test using Tukey-Kramer procedure (adjP) shown on top of each boxplot. Each boxplot includes the median, first and third quartiles (25th and 75th percentiles), and two whiskers. Detailed statistics for each condition are provided in supplementary data.
Fig. 5
Fig. 5. Tailoring targeted theranostics.
a A dot plot illustrates the correlation between theranostic gene expression and pseudotime (path to prostate cancer progression along the trajectory). It features boxplots with trend lines for key theranostic genes. b, c The analysis highlights 4 theranostic genes with highest negative correlation scores and 1 theranostic gene with highest positive correlation score to pseudotime. AOC3 was selected as an example to show that it is targeted by a radiotracer named DOTA-Siglec-9 for PET imaging. The chemical structure of this tracer is shown to the right side of the box plot. dg Selected representative stage-specific theranostic genes with up-regulated or down-regulated expressions at each disease stage. Similar as in panel (b), for each disease stage, one of the selected theranostic gene was shown to be targeted by a clinical available radiotracer, with the radiotracer name and a chemical structure illustration shown to the right side of the box plot. P values derived from the Kruskal Wallis test are indicated atop the boxplots. CRPC - metastatic castration-resistant prostate cancer. NEPC - neuroendocrine prostate cancer. Each boxplot displays the median, first and third quartiles (25th and 75th percentiles), along with two whiskers. VST: variance stabilizing transformation. An illustration depicting prostate cancer progression was created with BioRender.com. Source data are provided as a Source data file.

Similar articles

Cited by

References

    1. Vamathevan, J. et al. Applications of machine learning in drug discovery and development. Nat. Rev. Drug Discov.18, 463–477 (2019). - PMC - PubMed
    1. Tropsha, A., Isayev, O., Varnek, A., Schneider, G. & Cherkasov, A. Integrating QSAR modelling and deep learning in drug discovery: the emergence of deep QSAR. Nat. Rev. Drug Discov.10.1038/s41573-023-00832-0 (2023). - PubMed
    1. Pandi, A. et al. A versatile active learning workflow for optimization of genetic and metabolic networks. Nat. Commun.13, 3876 (2022). - PMC - PubMed
    1. Luo, Y., Liu, Y. & Peng, J. Calibrated geometric deep learning improves kinase–drug binding predictions. Nat. Mach. Intell.5, 1390–1401 (2023). - PMC - PubMed
    1. Zhang, Y. et al. Emerging drug interaction prediction enabled by a flow-based graph neural network with biomedical network. Nat. Computational Sci.3, 1023–1033 (2023). - PubMed

Publication types

LinkOut - more resources