. 2024 Dec 30;15(1):10925.
doi: 10.1038/s41467-024-55446-w.

NS1 binding protein regulates stress granule dynamics and clearance by inhibiting p62 ubiquitination

Affiliations

NS1 binding protein regulates stress granule dynamics and clearance by inhibiting p62 ubiquitination

Pureum Jeon et al. Nat Commun. .

Erratum in

Abstract

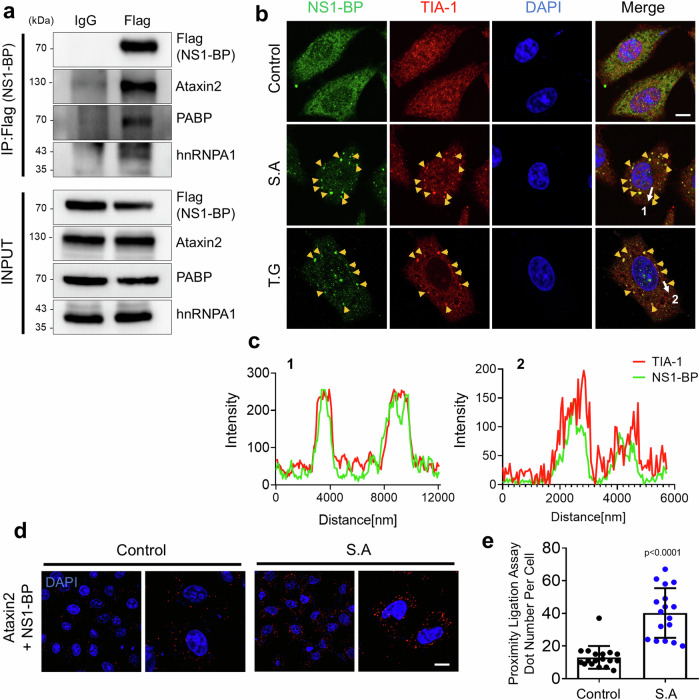
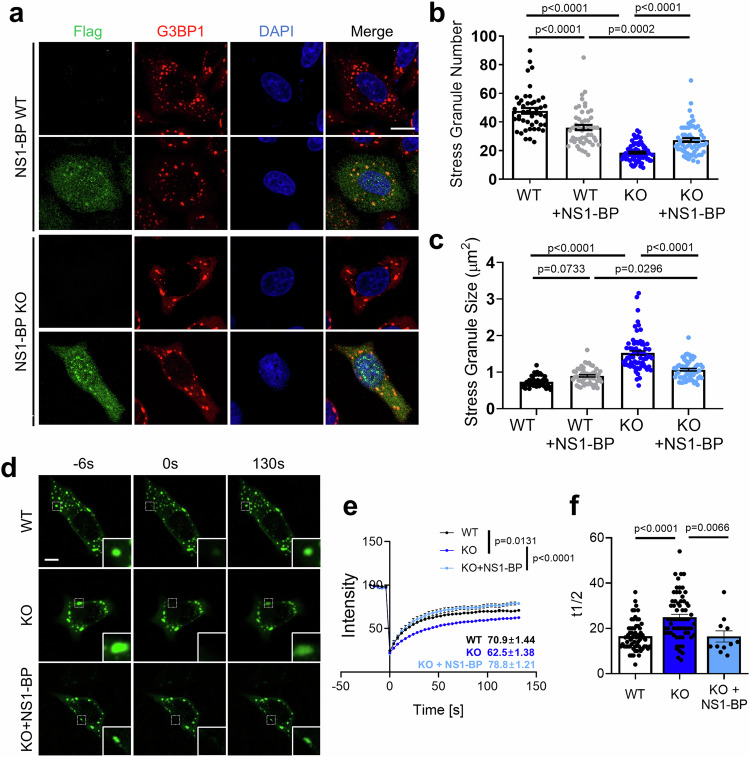
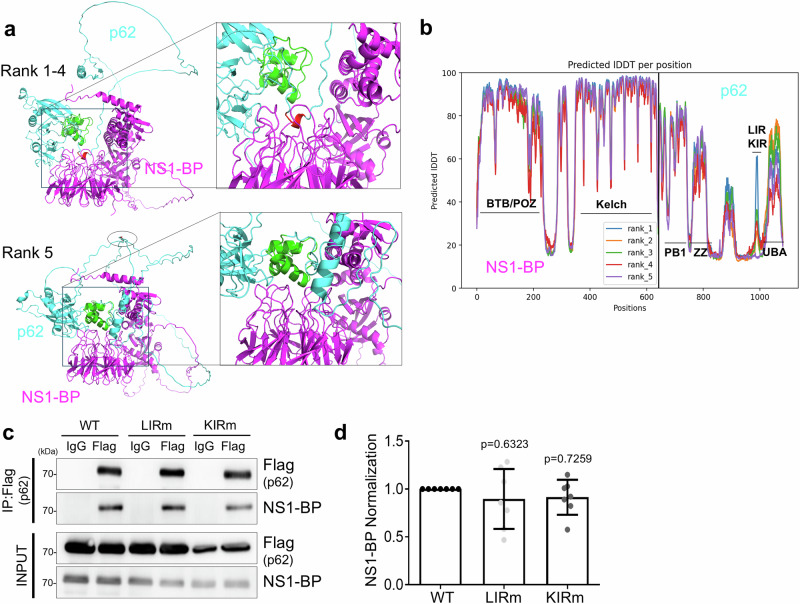
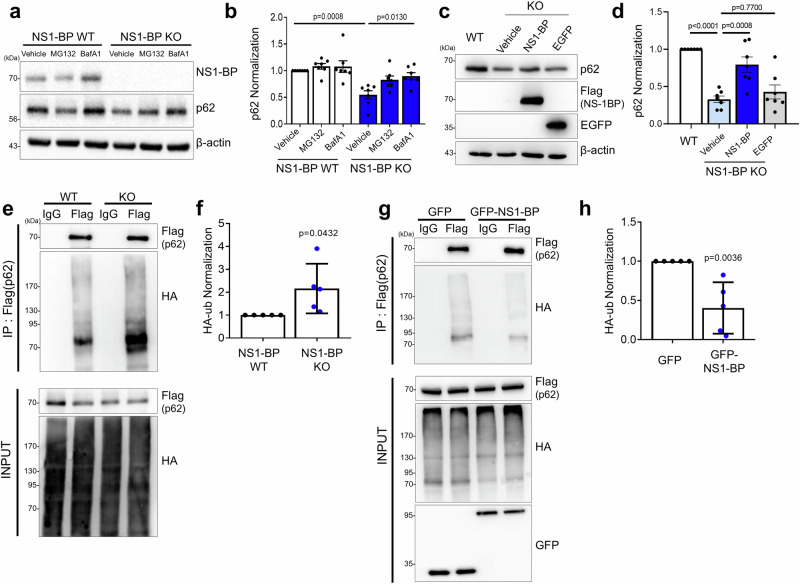
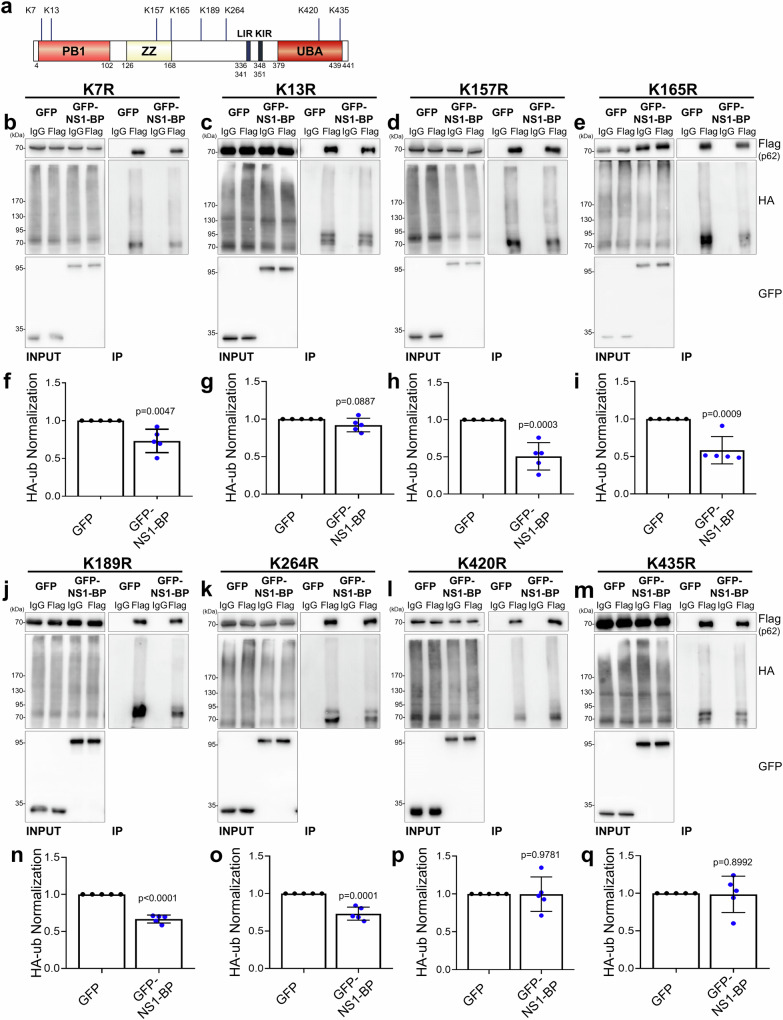
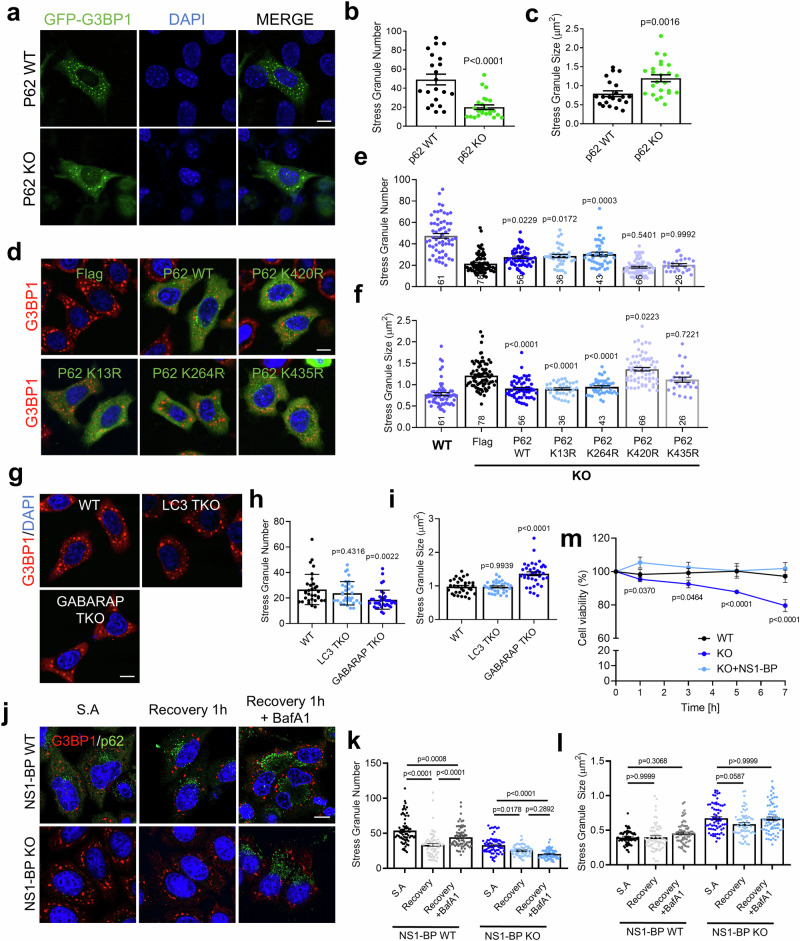
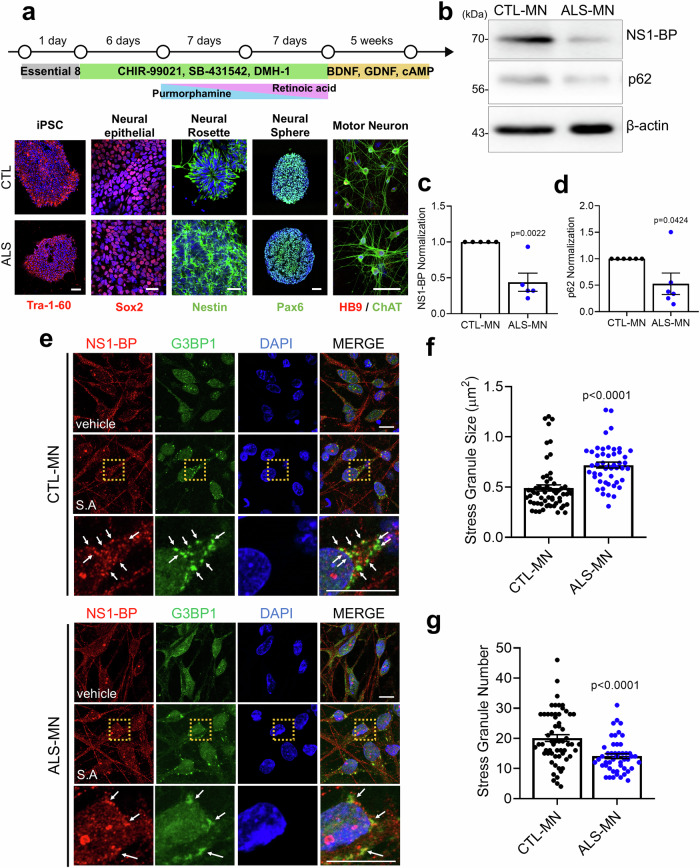
The NS1 binding protein, known for interacting with the influenza A virus protein, is involved in RNA processing, cancer, and nerve cell growth regulation. However, its role in stress response independent of viral infections remains unclear. This study investigates NS1 binding protein's function in regulating stress granules during oxidative stress through interactions with GABARAP subfamily proteins. We find that NS1 binding protein localizes to stress granules, interacting with core components, GABARAP proteins, and p62, a protein involved in autophagy. In cells lacking NS1 binding protein, stress granule dynamics are altered, and p62 ubiquitination is increased, suggesting impaired stress granule degradation. Overexpression of NS1 binding protein reduces p62 ubiquitination. In amyotrophic lateral sclerosis patient-derived neurons, reduced NS1 binding protein and p62 disrupt stress granule morphology. These findings identify NS1 binding protein as a negative regulator of p62 ubiquitination and a facilitator of GABARAP recruitment to stress granules, implicating it in stress granule regulation and amyotrophic lateral sclerosis pathogenesis.


Conflict of interest statement

Competing interests: The authors declare no competing interests.

Figures

Fig. 1
Fig. 1. Interaction of NS1-BP with stress granule (SG) components.
a Immunoprecipitation and western blot analysis using HEK293T cell lysates expressing Flag-NS1-BP with anti-Flag (or IgG), anti-Ataxin2, anti-PABP, and anti-hnRNPA1 antibodies. The experiment was repeated three times independently. b Representative images illustrating the cellular localization of NS1-BP (green) with TIA-1 (red) in HeLa cells under sodium arsenite (S.A) (0.5 mM, 1 h) or thapsigargin (T.G) (50 μM, 1 h) treatment conditions. Yellow and white arrows indicate each SGs and the region and direction for line scan, respectively. Scale bar, 10 μm. c Line scan graphs depicting the co-localization of TIA-1 (red) with NS1-BP (green). d Representative images displaying the results of the proximity ligation assay (PLA) for Ataxin2 with NS1-BP under sodium arsenite (0.5 mM, 1 h) condition. Scale bar, 10 μm. e Bar graph showing the proximity ligation assay dots. Data were quantified with a two-tailed unpaired Student’s t-test and presented as mean ± SEM; Control, n = 18; S.A, n = 17. Source data are provided as a Source Data file.
Fig. 2
Fig. 2. Regulation of stress granule (SG) dynamics by NS1-BP.
a Representative images depicting G3BP1-positive SGs (red) in NS1-BP WT and KO HeLa cells expressing either Flag-vector or Flag-NS1-BP (green). Scale bar, 10 μm. b, c Bar graph illustrating the number(b) and size(c) of SGs. Each dots represent the average number or size of SGs per cell. Data were quantified by one-way ANOVA in conjunction with the Tukey post hoc test and presented as mean ± SEM; WT, n = 44; WT + NS1-BP, n = 50; KO, n = 71; KO + NS1-BP, n = 61. d Representative images showing the GFP-G3BP1-containing SGs before and after photobleaching in NS1-BP WT, NS1-BP KO, or Flag-NS1-BP expressing NS1-BP KO HeLa cells. Scale bar, 5 μm. e The graph displaying normalized GFP-G3BP1 intensity after photobleaching. Data were quantified with a two-tailed unpaired Student’s t-test and presented as mean ± SEM; WT, n = 65; KO, n = 66; KO + NS1-BP, n = 11. f The graph showing the half-time of recovery (t1/2) of GFP-G3BP1 positive stress granules. Data were quantified using one-way ANOVA in conjunction with the Tukey post hoc test and presented as mean ± SEM; WT, n = 65; KO, n = 66; KO + NS1-BP, n = 11. Source data are provided as a Source Data file.
Fig. 3
Fig. 3. Interaction of NS1-BP with p62 via its kelch motif and UBA domain in p62 in an oxidative stress-dependent manner.
a Immunoprecipitation and western blot using HEK293T cell lysates expressing Flag-NS1-BP or Flag-p62, treated with sodium arsenite (0.5 mM, 1 h) with anti-Flag (or IgG), anti-p62, and anti-NS1-BP antibodies. The experiments were repeated five times independently. b Immunoprecipitation and western blot using HeLa cell lysates with anti-p62 (or IgG) antibodies. Cells were treated with sodium arsenite (0.5 mM, 1 h). c Bar graph showing NS1-BP normalization. Data were quantified using a two-tailed unpaired Student’s t-test and presented as mean ± SEM; Control, n = 5; S.A, n = 5. d Schematic model illustrating the constructs of 3xFlag-NS1-BP, 3xFlag-p62, and their deletion mutants (3xFlag-NS1-BP ΔKelch, 3xFlag-NS1-BP ΔBTB/POZ, 3xFlag-p62 ΔPB1, 3xFlag-p62 ΔUBA). e Immunoprecipitation and western blot using HEK293T cell lysates expressing Flag-NS1-BP WT, Flag-NS1-BP ΔKelch, or Flag-NS1-BP ΔBTB/POZ with anti-Flag (or IgG) and anti-p62 antibodies. f Bar graph showing the normalization of p62. Data were quantified using one-way ANOVA in conjunction with the Tukey post hoc test and presented as mean ± SEM; WT, n = 6; ΔKelch, n = 6; ΔBTB/POZ, n = 6. g Immunoprecipitation and western blot using HEK293T cell lysates expressing Flag-p62 WT, Flag-p62 ΔUBA, or Flag-p62 ΔPB1 with anti-Flag (or IgG) and anti-NS1-BP antibodies. h Bar graph showing the normalization of NS1-BP. Data were quantified using one-way ANOVA in conjunction with the Tukey post hoc test and presented as mean ± SEM; WT, n = 3; ΔUBA, n = 3; ΔPB1, n = 3. Source data are provided as a Source Data file.
Fig. 4
Fig. 4. Interaction between p62 and NS1-BP mediated through its UBA domain and KIR motif.
a ColabFold prediction models of the complex depicting NS1-BP (magenta) and p62/SQSTM1 (cyan). Close-up view of the interacting boxed regions in both models is on the right. Rank 1-4 models are shown in the upper model. The NS1-BP interacts with the KIR of p62 (red) whereas the UBA domain (green) in p62 does not interact with NS1-BP in this complex model. Another predicted model of NS1-BP (magenta) and p62 (cyan) ranked fifth in ColabFold prediction (lower in this panel). The UBA domain (green) in p62/SQSTM1 involved in the interaction with NS1-BP whereas the KIR motif (black oval) locate at far from the NS1-BP. b Predicted local distance difference test (pLDDT) of the ColabFold prediction top5 ranked models. The predicted model of NS1-BP is more accurate than that of p62. c Immunoprecipitation and western blot using HEK293T cell lysates expressing Flag-p62 WT, Flag-p62 LIR mutant, or Flag-p62 KIR mutant, treated with S.A (0.5 mM, 1 h) with anti-Flag (or IgG) and anti-NS1-BP antibodies. d Bar graph showing the normalization of NS1-BP. Data were quantified using one-way ANOVA in conjunction with the Tukey post hoc test and presented as mean ± SEM; WT, n = 7; LIRm, n = 7; KIRm, n = 7. Source data are provided as a Source Data file.
Fig. 5
Fig. 5. Negative regulation of p62 ubiquitination by NS1-BP.
a NS1-BP WT and KO HeLa cells were treated with MG132 (10 μM, 6 h) or BafilomycinA1 (100 nM, 6 h) and assayed for western blot using anti-NS1-BP, anti-p62, and anti-β-actin antibodies. b The bar graph represents the normalization of p62 protein levels. Data were quantified using one-way ANOVA in conjunction with the Tukey post hoc test and presented as mean ± SEM; WT vehicle, n = 7; WT MG132, n = 7; WT BafA1, n = 7; KO vehicle, n = 7; KO MG132, n = 7; KO BafA1, n = 7. c Immunoblotting showing the p62 protein levels in NS1-BP WT and Flag-NS1-BP or EGFP lentivirus infected NS1-BP KO HeLa cells. d Bar graph showing p62 Normalization. Data were quantified using one-way ANOVA in conjunction with the Tukey post hoc test and presented as mean ± SEM; WT, n = 7; KO vehicle, n = 7; KO NS1-BP, n = 7; KO EGFP, n = 7. e Ubiquitination immunoprecipitation and western blot using NS1-BP WT and KO HeLa cell lysates expressing 3xFlag-p62 and HA-ub, treated with sodium arsenite (0.5 mM, 1 h) with anti-Flag (or IgG) and anti-HA antibodies. f Bar graph showing the normalization of HA-ub. Data were quantified with a two-tailed unpaired Student’s t-test and presented as mean ± SEM; NS1-BP WT, n = 5; NS1-BP KO, n = 5. g Ubiquitination immunoprecipitation and western blot using HEK293T cell lysates expressing 3xFlag-p62, HA-ub, and GFP or GFP-NS1-BP, treated with sodium arsenite (0.5 mM, 1 h) with anti-Flag (or IgG) and anti-HA antibodies. h Bar graph showing the normalization of HA-ub. Data were quantified with a two-tailed unpaired Student’s t-test and presented as mean ± SEM; GFP, n = 5; GFP-NS1-BP, n = 5. Source data are provided as a Source Data file.
Fig. 6
Fig. 6. Regulation of p62 ubiquitination by NS1-BP on Lysine 13, Lysine 420, and Lysine 435.
a Schematic model illustrating p62 ubiquitination sites. b, c, d, e, j, k, l, m Ubiquitination immunoprecipitation (Ub-IP) and western blot using HEK293T cells lysates expressing EGFP or EGFP-NS1-BP and Flag-p62 K7R(b), Flag-p62 K13R(c), Flag-p62 K157R(d), Flag-p62 K165R(e), Flag-p62 K189R(j), Flag-p62 K264R(k), Flag-p62 K420R(l), or Flag-p62 K435R(m) treated with sodium arsenite (0.5 mM, 1 h) with anti-Flag (or IgG), anti-GFP, and anti-HA antibodies. f, g, h, i, n, o, p, q. Graphs showing the normalization of HA-ub. Data were quantified with a two-tailed unpaired Student’s t-test and presented as mean ± SEM; GFP, n = 5; GFP-NS1-BP, n = 5. Source data are provided as a Source Data file.
Fig. 7
Fig. 7. Regulation of stress granule (SG) dynamics by p62 and GABARAP family proteins.
a Representative images showing the cellular localization of EGFP-G3BP1 in p62 WT and KO MEFs. Cells were transfected with EGFP-G3PB1 and treated with sodium arsenite (0.5 mM, 1 h). Scale bar, 10 μm. b, c Graphs showing the number(b) and size(c) of SGs per cell. Data were quantified using a two-tailed unpaired Student’s t-test and presented as mean ± SEM; p62 WT, n = 21; p62 KO, n = 24. d Representative images showing G3BP1 positive SGs in NS1-BP KO HeLa cells expressing Flag vector, Flag-p62 WT, Flag-p62 K13R, Flag-p62 K264R, Flag-p62 K420R, or Flag-p62 K435R treated with sodium arsenite (0.5 mM, 1 h). Scale bar, 10 μm. e, f Bar graphs showing the number(e) and size(f) SGs per cell. Data were quantified using one-way ANOVA in conjunction with the Tukey post hoc test and presented as mean ± SEM; WT, n = 61; KO, n = 78; KO+p62 WT, n = 56; KO+p62 K13R, n = 36; KO+p62 K264R, n = 43; KO+p62 K420R, n = 66; KO+p62 K435R, n = 26. g Representative images show G3BP1-positive SGs in LC3 TKO and GABARAP TKO HeLa cells under sodium arsenite (0.5 mM, 1 h) treatment condition. Scale bar, 10 μm. h, i Bar graphs showing the number(h) and size(i) of SGs per cell. Data were quantified using a two-tailed unpaired Student’s t-test and presented as mean ± SEM; WT, n = 32; LC3 TKO, n = 32; GABARAP TKO, n = 37. j Representative images show G3BP1-positive SGs in NS1-BP WT and KO HeLa cells upon sodium arsenite treatment and recovery 1 h with or without BafA1 (10 nM, 24 h). Scale bar, 10 μm. k, l Bar graphs showing the number(k) and size(l) of SGs per cell. Data were quantified using a two-tailed unpaired Student’s t-test and presented as mean ± SEM; WT S.A, n = 70; WT recovery, n = 67; WT BafA1, n = 70; KO S.A, n = 69; KO recovery, n = 66; KO BafA1, n = 70. m Cell viability of NS1-BP WT, NS1-BP KO, and NS1-BP overexpressed KO cells was assessed after 1, 3, 5, 7 h of sodium arsenite treatment (0.5 mM). The viability was compared with that of untreated cells. Data were quantified using one-way ANOVA in conjunction with the Tukey post hoc test and presented as mean ± SEM; WT, n = 5; KO, n = 5; KO + NS1-BP, n = 5. Source data are provided as a Source Data file.
Fig. 8
Fig. 8. Dysregulation of stress granules (SGs) due to reduced NS1-BP levels in ALS-patient iPSC-derived motor neurons.
a Schematic model illustrating iPSC differentiation to motor neurons. b Analysis of NS1-BP and p62 protein levels through western blot using anti-NS1-BP, anti-p62, anti-beta-actin in CTL-MN and ALS-MN. c Bar graph indicating the normalization of NS1-BP protein levels. Data were quantified using a two-tailed unpaired Student’s t-test and presented as mean ± SEM; CTL-MN, n = 5; ALS-MN, n = 5. d Bar graph indicating the normalization of p62 protein levels. Data werequantified using a two-tailed unpaired Student’s t-test and presented as mean ± SEM; CTL-MN, n = 6; ALS-MN, n = 6. e Representative images showing NS1-BP (red) and G3BP1-positive SGs (green) in CTL-MN and ALS-MN upon sodium arsenite (0.5 mM, 90 min) treatment or not. Scale bar, 10 μm. f, g Bar graphs showing the SG size(f) and number(g). White arrows indicate NS1-BP and G3BP1-positive SGs. Data were quantified using a two-tailed unpaired Student’s t-test and presented as mean ± SEM; CTL-MN, n = 60; ALS-MN, n = 48. Source data are provided as a Source Data file.

References

    1. Glick, D., Barth, S. & Macleod, K. F. Autophagy: cellular and molecular mechanisms. J Pathol.221, 3–12 (2010). - PMC - PubMed
    1. Murrow, L. & Debnath, J. Autophagy as a stress-response and quality-control mechanism: implications for cell injury and human disease. Annu Rev Pathol.8, 105–137 (2013). - PMC - PubMed
    1. Buchan, J. R., Yoon, J. H. & Parker, R. Stress-specific composition, assembly and kinetics of stress granules in Saccharomyces cerevisiae. J Cell Sci.124, 228–239 (2011). - PMC - PubMed
    1. Anderson, P. & Kedersha, N. Stress granules. Curr Biol19, R397–R398 (2009). - PubMed
    1. Kedersha, N. et al. G3BP-Caprin1-USP10 complexes mediate stress granule condensation and associate with 40S subunits. J Cell Biol212, 845–860 (2016). - PMC - PubMed

Publication types

MeSH terms

Substances

LinkOut - more resources