. 2024 Dec 30;15(1):10887.
doi: 10.1038/s41467-024-55238-2.

Liver cancer multiomics reveals diverse protein kinase A disruptions convergently produce fibrolamellar hepatocellular carcinoma

Affiliations

Liver cancer multiomics reveals diverse protein kinase A disruptions convergently produce fibrolamellar hepatocellular carcinoma

David Requena et al. Nat Commun. .

Abstract

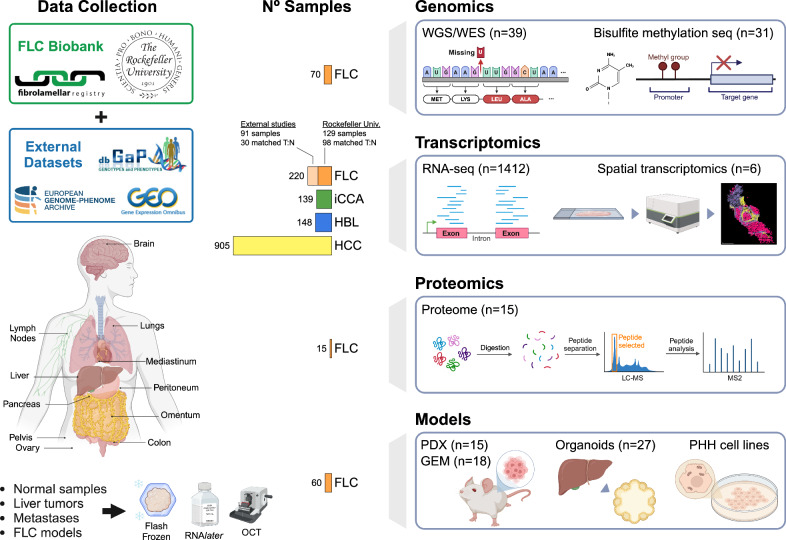
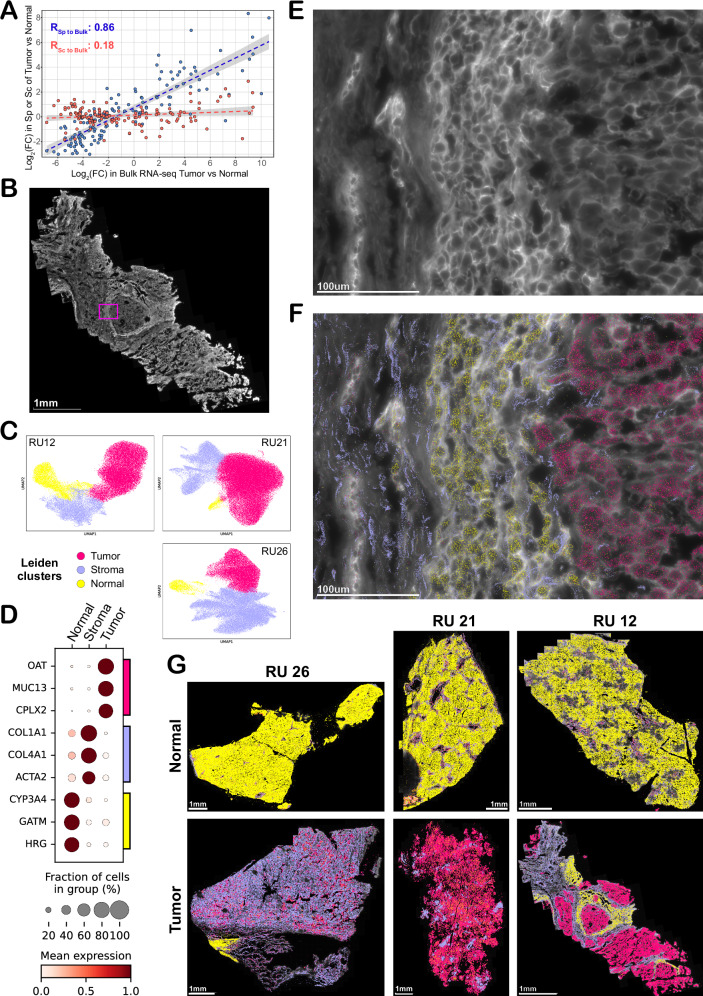
Fibrolamellar Hepatocellular Carcinoma (FLC) is a rare liver cancer characterized by a fusion oncokinase of the genes DNAJB1 and PRKACA, the catalytic subunit of protein kinase A (PKA). A few FLC-like tumors have been reported showing other alterations involving PKA. To better understand FLC pathogenesis and the relationships among FLC, FLC-like, and other liver tumors, we performed a massive multi-omics analysis. RNA-seq data of 1412 liver tumors from FLC, hepatocellular carcinoma, hepatoblastoma and intrahepatic cholangiocarcinoma are analyzed, obtaining transcriptomic signatures unrestricted by experimental processing methods. These signatures reveal which dysregulations are unique to specific tumors and which are common to all liver cancers. Moreover, the transcriptomic FLC signature identifies a unifying phenotype for all FLC tumors regardless of how PKA was activated. We study this signature at multi-omics and single-cell levels in the first spatial transcriptomic characterization of FLC, identifying the contribution of tumor, normal, stromal, and infiltrating immune cells. Additionally, we study FLC metastases, finding small differences from the primary tumors.


Conflict of interest statement

Competing interests: The authors declare no competing interests.

Figures

Fig. 1
Fig. 1. Schematic representation of the samples studied.
This includes 1412 RNA-seq samples (FLC: 220, iCCA: 139, HBL: 148, HCC: 905. Some of these FLC samples were also studied through whole-genome and whole-exome sequencing (n = 39), targeted bisulfite methylation sequencing (n = 31), proteome sequencing (n = 15), and spatial single-cell transcriptomics (n = 6). We also developed FLC models, including 15 different PDX, 18 genetically engineered mice, 27 organoids, and primary human hepatocytes expressing the chimeras DNAJB1::PRKACA and ATP1B1∷PRKACA.
Fig. 2
Fig. 2. Finding the transcriptomic signature of FLC.
A Differentially expressed genes obtained by the library (FDR < 0.05 and |log2(FC)| > 1). In (B) filters were applied to the intersection of the exploration datasets to obtain the transcriptomic FLC signature (287 up- and 406 down-regulated genes), as detailed in the Methods. C Validation using three external datasets. In these, we calculated the dysregulation trends of the FLC signature genes. In all cases, we confirmed that they matched with the trends obtained in panel (B). The libraries used correspond to the human tissue samples sequenced in RU-A: Simon et al., RU-B and RU-C: this study, RU-D: Lalazar et al., RU-E: Narayan et al.. We used as validation three external datasets of patients’ samples: Sorenson et al., Francisco et al. and the TCGA-LIHC study. In these datasets, we calculated the dysregulation trend of each of the genes in the FLC signature. For all genes, we confirmed that these trends matched those obtained in panel (B). The raw reads and normalized read counts for this figure are deposited in their corresponding dbGAP, GEO, and EGA repositories, as detailed in the data availability section. Access can be requested directly to these repositories under their privacy and confidentiality terms.
Fig. 3
Fig. 3. Studying FLC-like samples using the FLC signature.
Panels (A, B) Unsupervised clustering using UMAP with HDBSCAN of FLC and FLC-like samples. We analyzed the samples of Requena et al. (this study), and the samples deposited in public databases from the studies of Francisco et al., Xu et al., Robinson et al., Sorenson et al., Simon et al., Hirsch et al., and the TCGA-LIHC study (N = 185 samples). In the legend (upper right) the symbol “-” indicates that the corresponding dataset does not have normal samples. A Plot using all the genes, showing a strong batch effect. B Plot using only the genes of the FLC signature, showing no batch effect. All the FLC tumors included have the fusion transcript DNAJB1::PRKACA, but the FLC-like samples do not. Instead, they either have the chimera ATP1B1::PRKACA, mutations in BAP1, or missing R1A activity (∆R1A). Panels (CE) Histopathological assessment of a pair of samples from a patient, classified by the hospital as a tumor and a normal sample. Surprisingly, the normal sample clustered with the FLC tumors (in B, a light blue square with a black arrowhead pointing to it). Blind pathological assessment with 300 additional de-identified slides resulted in the identification of normal regions (panel C), but also other regions with large eosinophilic cells and fibrous bands (panel D), characteristic of FLC tumors. These regions look histologically like the paired tumor piece (panel E). The scale bar for panels (CE) is 100 μM. The specific sample IDs are detailed in the tables in Supplementary Data 1 and 2. The raw reads and normalized read counts for this figure are deposited in their corresponding dbGAP, GEO, and EGA repositories, detailed in the data availability section. Access can be requested directly to these repositories under their privacy and confidentiality terms.
Fig. 4
Fig. 4. Transcriptomic alteration in FLC metastases.
The transcriptome of 51 samples from 13 patients with concurrent resections of at least one Normal (N), one Primary (P), and one metastatic (M) tumor samples were compared. A Differentially expressed genes with progressive dysregulation (N < P < M: n = 14, N > P > M, n = 54) from normal samples (N) to primary tumors (P) and metastases (M) of FLC patient samples. B Box-scatter-violin plots of the normalized counts (in log2 scale) of the top 39 genes with differential expression in metastases. The box plot spans the Q1, Q2 (median, red line), and Q3 quartiles, with the whiskers extending to 1.5 in the interquartile range. The heatmap and violin-box-scatter plots were generated using all the FLC patients with triplets of Normal-Primary-Metastastic samples. The specific sample IDs are detailed in the Supplementary Data 2. The raw reads and normalized read counts for the samples in these figures are deposited in their corresponding dbGAP, GEO, and EGA repositories (details in the data availability section). Access can be requested directly to these repositories under their privacy and confidentiality terms.
Fig. 5
Fig. 5. Multiomics of the FLC signature.
A Fold Change (in log2 scale) of the genes in the transcriptomic FLC signature and the differentially regulated proteins in tumors versus normal samples (N = 238 genes). A positive correlation is observed (R = 0.73). B Differentially methylated genes in tumor versus normal samples in the transcriptomic FLC signature (N = 41 genes). Red: overexpressed, Blue: underexpressed. In (A, B), the gray-shaded region indicates the range of possible values for the linear regression fit with 95% confidence. C Circos plot representing the genes of the transcriptomic FLC signature at different omic levels, from external to internal circle: chromosome, transcriptome, proteome, methylome, and genome/exome. The Log2(Fold Change) of FLC tumor versus normal samples at transcriptional level is shown in a red (overexpressed) white (no change), and blue scale (underexpressed). The log2(Fold Change) at the proteome level is presented in a yellow (down) to blue (up) scale. The percentage of differentially hyper- and hypo-methylation in FLC tumors versus normal samples in a yellow (down) to blue (up) scale. For the proteome and methylome, white = undetected. The genomic variants detected in the WGS/WES data of FLC tumors versus normal samples are represented as bars, where the height represents the number of tumors mutated (from 0 to 10), and the grayscale intensity represents the number of mutations. The raw reads and normalized read counts of the transcriptome are deposited in dbGAP phs003643. Access can be requested directly from dbGAP under their privacy and confidentiality terms. The methylation data is provided in the Supplementary Data 5 in the present article. The proteome data is from Supplementary Table 1, 2 of Levin et al..
Fig. 6
Fig. 6. Spatial single-cell transcriptomics of FLC tumors.
A Changes in expression (as log2 fold change) in tumor vs normal samples of 140 genes screened using spatial transcriptomics (Sp), with their corresponding change in single-cell (Sc) transcriptomics and bulk RNA-seq. B Tissue section imaged using MERFISH. C Dimensionality reduction and unsupervised clustering of the gene expression by cell resulted in 3 Leiden clusters in three different patient samples (RU12, RU21, and RU26). D Top 3 differentially expressed genes among the 3 clusters identified in (C) across the three samples. The color represents the gene expression normalized from 0 (white) to 1 (dark red), and the size of the circle represents the percentage of cells expressing the gene. E, F 100X zoom of the pink rectangle in (B), showing morphological features that allow depicting stromal (left), normal (center), and tumor (right) cells. When the genes identified in (D) were mapped in (E), they matched with these three cell types, as shown in (F). G Paired normal and tumor sections from three different FLC patients (RU12, RU21, and RU26), colored using the markers selected in (D). The spatial transcriptomics data and the single cell reads are available under dbGAP accession code phs003643. Access can be requested directly from dbGAP under their privacy and confidentiality terms.
Fig. 7
Fig. 7. Using the transcriptomic FLC signature to evaluate in vivo models of FLC.
UMAP plots of the PDX and the normal and tumor patient samples (N = 25) presented by Lalazar et al., using (A) all the genes and (B) using only the genes of the transcriptomic FLC signature. Each color represents a different patient, and the shape indicates if the sample is normal (circle), patient tumor (square), or tumor PDX (rhombus) tissue sample. The letter inside the square indicates if the sample is a primary (P), recurrence (R), or metastatic (M) tumor. The number inside the rhombus indicates the PDX passage number. C Comparison of the log2(fold change) in FLC PDX relative to normal samples from patients (y-axis) and the log2(fold change) in patient tumors relative to normal samples (x-axis), using only the differentially expressed genes (FDR < 0.05) in the FLC signature, obtaining a high correlation (R2 = 0.95). D Revisiting the stemness of FLC. Violin plots (in yellow) of the log2 normalized gene counts of AHR and the stem/progenitor markers screened by Oikawa et al. We analyzed RNA-seq data of 143 FLC patient tumor and normal tissue samples from different FLC studies,,– (in variations of green) and the tumor line and the biliary tree stem cells studied by Oikawa (magenta). The color of the significance bar represents the variation of each of the groups in the X-axis compared to patient normal samples (red: overexpressed, blue: underexpressed), and the symbols on top represent if that variation was significant (*: 0.01 < FDR ≤ 0.05, **: 0.001 < FDR ≤ 0.01, ***: 0.0001 < FDR ≤ 0.001, ****: FDR ≤ 0.0001) or not (n.s.) in the Wald two-sided test performed by DESeq2. The box plots (vertical rectangles in gray) span the Q1, Q2 (median, black line), and Q3 quartiles, with the whiskers extending to 1.5 in the interquartile range. We used all the FLC RNA-seq data available: Requena et al. (this study), and the samples deposited in public databases from the studies of Francisco et al., Xu et al., Robinson et al., Sorenson et al., Simon et al., Hirsch et al. and the TCGA-LIHC study. We included the tumor model data of Oikawa et al.. Their accession numbers are provided in the Data Availability section. Access can be requested directly to dbGAP, GEO and EGA under their privacy and confidentiality terms.
Fig. 8
Fig. 8. The FLC signature distinguishes FLC from other liver tumors.
Paired tumor-normal samples from hepatocellular carcinoma (HCC),–, hepatoblastoma (HBL), intrahepatic cholangiocarcinoma (iCCA), fibrolamellar carcinoma (FLC),,– and FLC-like tumors with the chimera ATP1B1::PRKACA, mutations in BAP1, or missing R1A activity (∆R1A) are represented in the columns (N = 986). They are categorized by sample type in: Normal sample, Primary tumor, Recurrence, Metastasis, or Uncategorized tumor. Using only genes of the FLC signature, hierarchical clustering separated the normal samples apart from the tumors, and FLC tumors in its own branch. The rows represent the genes of the transcriptomic FLC signature, which were hierarchically clustered in a dendrogram. It shows branches with expression patterns exclusive of FLC, distinct from other liver tumors. We used all the paired FLC tumor and normal samples with RNA-seq data available: Requena et al. (this study), and the samples deposited in public databases from the studies of Francisco et al., Xu et al., Robinson et al., Sorenson et al., Simon et al., Hirsch et al., and the TCGA-LIHC study. Also, the FLC-like samples with R1A and ATP1B1::PRKACA mutations from Requena et al. (this study) and the BAP-1 FLC-like samples from Hirsch et al.. Their accession numbers are provided in the Data Availability section. Access can be requested directly to dbGAP, GEO and EGA under their privacy and confidentiality terms.

References

    1. Edmondson, H. A. Differential diagnosis of tumors and tumor-like lesions of liver in infancy and childhood. AMA J. Dis. Child91, 168–186 (1956). - PubMed
    1. Craig, J. R., Peters, R. L., Edmondson, H. A. & Omata, M. Fibrolamellar carcinoma of the liver: a tumor of adolescents and young adults with distinctive clinico-pathologic features. Cancer46, 372–379 (1980). - PubMed
    1. Torbenson, M. Fibrolamellar carcinoma: 2012 update. Scientifica2012, 743790 (2012). - PMC - PubMed
    1. Kassahun, W. T. Contemporary management of fibrolamellar hepatocellular carcinoma: diagnosis, treatment, outcome, prognostic factors, and recent developments. World J. Surg. Oncol.14, 151 (2016). - PMC - PubMed
    1. Kaseb, A. O. et al. Prognostic indicators and treatment outcome in 94 cases of fibrolamellar hepatocellular carcinoma. Oncology85, 197–203 (2013). - PMC - PubMed

Publication types

MeSH terms

Substances

Supplementary concepts