. 2024 Dec 30;15(1):10911.
doi: 10.1038/s41467-024-55305-8.

Rapid lightsheet fluorescence imaging of whole Drosophila brains at nanoscale resolution by potassium acrylate-based expansion microscopy

Affiliations

Rapid lightsheet fluorescence imaging of whole Drosophila brains at nanoscale resolution by potassium acrylate-based expansion microscopy

Xuejiao Tian et al. Nat Commun. .

Abstract

Taking advantage of the good mechanical strength of expanded Drosophila brains and to tackle their relatively large size that can complicate imaging, we apply potassium (poly)acrylate-based hydrogels for expansion microscopy (ExM), resulting in a 40x plus increased resolution of transgenic fluorescent proteins preserved by glutaraldehyde fixation in the nervous system. Large-volume ExM is realized by using an axicon-based Bessel lightsheet microscope, featuring gentle multi-color fluorophore excitation and intrinsic optical sectioning capability, enabling visualization of Tm5a neurites and L3 lamina neurons with photoreceptors in the optic lobe. We also image nanometer-sized dopaminergic neurons across the same intact iteratively expanded Drosophila brain, enabling us to measure the 3D expansion ratio. Here we show that at a tile scanning speed of ~1 min/mm3 with 1012 pixels over 14 hours, we image the centimeter-sized fly brain at an effective resolution comparable to electron microscopy, allowing us to visualize mitochondria within presynaptic compartments and Bruchpilot (Brp) scaffold proteins distributed in the central complex, enabling robust analyses of neurobiological topics.


Conflict of interest statement

Competing interests: The authors declare no competing interests.

Figures
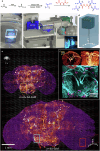
Fig. 1
Fig. 1. KA-ExM with Bessel lightsheet microscopy (∆BLX) for expansion and imaging of whole Drosophila brains.
a Synthesis of the in situ KA-ExM hydrogel. KPS potassium persulfate, TEMED tetramethylethylenediamine. b A free-standing KA hydrogel hosting an expanded fly brain stained with DAPI and illuminated by a 405 nm laser under a wide-field microscope. c The core ∆BLX system for imaging free-standing hydrogels comprises two ultrasonic piezo motors (U521) and one DC motor (M122) for sample translation, as well as a voice coil stage (V308) for sample scanning acquisition up to 7 mm. EO excitation objective, DO detection objective. Inset is a photograph of a centimeter-sized hydrogel in the water-filled imaging core. d Schematic for how a centimeter-sized gel is tiled by sample scanning using the voice coil motor. Note that there is no tiling in the z direction. e Maximum intensity projection (MIP) images of a series of expansions acquired by ∆BLX from an identical fly brain (grayscale image) with GFP-expressing dopaminergic neurons (heatmap) and nuclear staining (purple) first subjected to in situ KA-ExM and then iterative expansion (re-KA-ExM). Five independent gel expansions performed with similar results. f Enlarged 3D images for the ellipsoid body (EB) neuropil extracted from the expanded whole fly brain images in (e): heatmap images are the top (left) and side (right) views from an in situ KA-ExM brain and the two-color image (cyan and purple) is a top view of the re-KA-ExM sample. Note that the size of the original EB is shown in the yellow dashed box and all images have the same scale bar. Gamma correction applied to display colors on the 3D rendering.
Fig. 2
Fig. 2. Comparison of MIP images of the central nervous system of the Drosophila brain pre-expansion, and following in situ KA-ExM and re-KA-ExM.
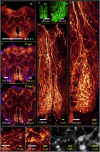
a Confocal image of dopaminergic neurons where PRW neuropil marked in a green box in the original (1x) TH-GAL4, 20XUAS-6XGFP/+ Drosophila using a NA = 1.1 objective. b, c Two-color images (purple, nuclei; heatmap, dopaminergic neurons) of the identical TH-GAL4 fly brain stained with DAPI shown in (a) after in situ KA-ExM (8x) and re-KA ExM (13x). The identical PRW neuropil highlighted in the yellow and blue dashed boxes for iterative expansion process. d A green box for confocal image of the partial area within the green dashed box in (a) and enlarged view of the punctate structures outlined by the red dashed box. e, f Enlarged views of the regions highlighted by the colored dashed boxes in (b) and (c), respectively, with the same scale bar for the same neuropil following in situ KA-ExM (8x) and re-KA ExM (13x). g, h Zoomed-in views of the selected areas within the white dashed boxes of (e) and (f). The marked areas (white dotted circles) show the same biological structures after 8x and 13x expansion. i, j Raw images of the same punctuate structures (highlighted in blue dotted circles) after in situ KA-ExM and re-KA-ExM. Note that the scale bars for all panels in real physical units (white font) vary according to the expansion factor (yellow font). Five independent gel expansions performed with similar results. Gamma correction applied to display colors on the 3D image rendering.
Fig. 3
Fig. 3. Oligomeric PKA-ExM and respective iterative ExM (re-PKA-ExM) of an identical TH-GAL4 Drosophila brain.
a The PKA-based ExM chemical reaction of DMAA with potassium polyacrylate (oligomeric form) with cross-linking and self-crosslinking products, as initiated by potassium persulfate (KPS) and accelerated by tetramethylethylenediamine (TEMED). b The original (1x) TH-GAL4, 20XUAS-6XGFP/+ Drosophila brain (grayscale image, top left in a red box) and following PKA-ExM treatment giving rise to 10x expansion, as well as a two-color (purple, nuclei; heatmap, dopaminergic neurons) image of the whole 10x-expanded fly brain subjected to tile scanning by ∆BLX. c The tile demarcated by a white dashed box in (b) rendered in 3D side view to demonstrate axial resolution. The two sub-volumes highlighted by green and blue dashed cubes are shown at right, revealing punctate (white arrow) and fibrous neuronal structures (yellow and blue arrows). A 2x enlarged slice view marked with blue arrow shown in the inset. d Side-view in 3D of the same tile from (b) following re-PKA-ExM treatment, resulting in a 30x expansion ratio. A sliced view of dopaminergic neuronal cell bodies (~250 µm, blue frame) and a sub-volume illustrating puncta marked with white arrow (30 ~ 40 µm, yellow frame). Note that the scale bars for all panels in real physical units (white font) vary according to the expansion factor (yellow font). Seven independent PKA-ExM performed with similar results. Gamma correction applied to display colors on the 3D image rendering.
Fig. 4
Fig. 4. ∆BLX imaging of an identical DAPI-stained Drosophila brain sample pre- and post- PKA-ExM expansion.
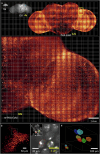
a All of the different expanded samples, i.e., 1x (grayscale, upper left), 4x (grayscale, upper middle), 12x (heatmap, upper right), and 32x (heatmap, bottom) of an identical fly brain presented on the same checkered canvas and subjected to 3D ∆BLX imaging. Note that the scale bar for all images is 1 mm. The area demarcated by yellow frame is used for comparing the 12x and 32x images. Three independent measurements performed with similar results. b A slice view for the area marked with yellow frame in (a) for 12x expanded fly brain. c Enlarged views in the white dashed box in (b) of the same nuclei colored red and green for PKA-ExM (12x, inset) and re-PKA-ExM (32x, main image), with the same scale bar for the inset and main image. d 3D renderings of the same selected regions in the dashed frame in (b), representing PKA-ExM (left) and re-PKA-ExM (right). In both cases, six nuclei have been segmented and rendered in different colors within the 3D image. Note that the scale bars in real physical units (white font) vary according to the expansion factor (yellow font). Gamma correction applied to display colors on the 3D image rendering.
Fig. 5
Fig. 5. Segmentation of Tm5a visual neurons in the Drosophila optic lobe following re-PKA-ExM expansion.
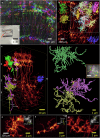
a MIP image colored according to depth of field showing the distributions of Tm5a neurons spanning multiple medullary layers. A hydrogel hosting an expanded fly brain marked with red arrow (outlined in red) is shown in the inset. Ten independent trials performed with similar results. b Enlarged MIP (heatmap) of a group of Tm5a neurons, with selected individual neurons highlighted in red, green and yellow, as well as a single axon terminal in blue. A group of segmented Tm5a neurons shown in the white dashed box. c 3D side view rendering of the data shown in (b), again showing the four selected Tm5a neurons and one axon terminal. An enlarged view (2-fold magnification) of two entangled Tm5a neurons (yellow and pink) is shown at bottom left. d Top view of the white dashed box labeled “1” in (c), representing the extent of the Tm5a neuron in the M6 layer. A zoomed-in slice view of two adjacent dendritic processes (outlined in an orange dashed box) is shown in the inset. eg Top views of the white dashed boxes labeled “2”, “3”, and “4” in (c), representing the extent of the Tm5a neuron in the M6, M8, and terminal layers, respectively. The insets in (e), (f) represent 2-fold magnifications of the regions demarcated by white dashed boxes in the respective main images. Note that the scale bars for all panels in real physical units (white font) reflect the 40x expansion factor (yellow font). Gamma correction applied to display colors on the 3D image rendering.
Fig. 6
Fig. 6. 3D skeletonization feature of densely packed Tm5a neurons in the re-PKA ExM fly optic lobe with 40 plus expansion ratio.
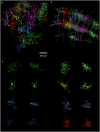
a Top view of a group of skeletonized visual neurons Tm5a based on the segmentation data in the white dashed box of Fig. 5b. b Side view of these transmedullary neurons in (a) with their dendrites extending into the M3, M6, and M8 layers from top to bottom. c The top view (left) and side view (right) of the individual and colored Tm5a neurons with dendritic processes in M6 layer marked with white arrowhead in (b). Note that all the images sharing the same scale bar.
Fig. 7
Fig. 7. 3D rendering of multicolor volumetric imaging of an expanded Drosophila optic lobe with sparse labeling on lamina or medullary visual neurons.
a Three-color MIP image for cell nuclei (DAPI) in blue, photoreceptors R7 and R8 (GMR-RFP) in red, and visual neurons (GFP-labeled membrane) in green. b A 3D view of the nuclei, photoreceptors, and one segmented lamina monopolar neuron, L3. c An enlarged view of the spatial arrangement of a L3 neuron (blue color) and photoreceptor (heatmap) pair, with a rotated view (clockwise) shown in the inset. d Two slice images of the areas indicated by the white arrow in (c), with the photoreceptor shown in heatmap and L3 neuron axonal shafts in green. e A slice image of the L3 axon terminal, together with the photoreceptor (R7 and R8) area indicated by the red arrow in (c). Note that the scale bars in real physical units (white font) reflect the 40x expansion factor (yellow font). Gamma correction applied to display colors on the 3D image rendering.
Fig. 8
Fig. 8. 3D mapping of mitochondria inside presynaptic compartments and the nano-organization of Brp in the adult fly brain.
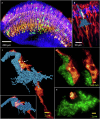
a Two-color MIP image of GFP-labeled TH-GAL4 (green) and mCherry-labeled mitochondria (red) in the PRW region of the PKA-ExM fly brain. b Expanded slice view of the red box in (a) showing only mitochondria. The white arrow marked as identical presynaptic compartment in (a) and (b). Five independent measurements performed with similar results. c A tiled lightsheet image of the central complex of the re-PKA ExM fly brain, showing an expanded FB (yellow) of ~3.5 mm and the AB region highlighted in blue. Three trials made with similar results. d MIP image of the AB stained with BrpNc82 coupled with Cy3, with individual active zones highlighted in the top left part by surface rendering. e Enlarged 3D view of the identified active zones in the AB shown in (d), with different orientations of the T bar, the primary unit of active zone architecture (arrowheads). f Color-coded depth mapping of (d) to 30 µm with z-intervals of 10 µm. Single or multiple clusters in different orientations (arrowheads) are shown. The inset is a zoomed in view of the clusters marked by a red arrowhead. Note that the scale bars in real physical units (white font) reflect the 40x expansion factor (yellow font).
Fig. 9
Fig. 9. The re-PKA ExM based on 100 µm spheroids generated from the HCT116 cell line in which nuclei stained by DAPI and imaged by ∆BLX.
a Image of the original ~100-µm spheroid. b Lightsheet imaging of the spheroid shown in (a) after the re-PKA-ExM process, resulting in a ~40x-plus expansion to ~4 mm (the original size is shown in the inset at the same scale). c Raw 3D MIP image of one ~300 µm mitotic cell selected from (b) after re-PKA-ExM. d Single slice view of (c) showing the detailed structure of the chromosomes. Five independent trials of re-KA and 4 trials of re-PKA ExM performed. Source data are provided as a source data file.

Similar articles

Cited by

References

    1. Chen, F., Tillberg, P. W. & Boyden, E. S. Optical imaging. Expansion microscopy. Science347, 543–548 (2015). - PMC - PubMed
    1. Chen, F. et al. Nanoscale imaging of RNA with expansion microscopy. Nat. Methods13, 679–684 (2016). - PMC - PubMed
    1. Chang, J. B. et al. Iterative expansion microscopy. Nat. Methods14, 593–599 (2017). - PMC - PubMed
    1. Gao, R., Asano, S. M. & Boyden, E. S. Q&A: expansion microscopy. BMC Biol.15, 50 (2017). - PMC - PubMed
    1. Wen, G., Leen, V., Rohand, T., Sauer, M. & Hofkens, J. Current progress in expansion microscopy: chemical strategies and applications. Chem. Rev.123, 3299–3323 (2023). - PubMed

Publication types

LinkOut - more resources