. 2024 Dec 30;15(1):10919.
doi: 10.1038/s41467-024-55387-4.

The chromatin remodeling factor OsINO80 promotes H3K27me3 and H3K9me2 deposition and maintains TE silencing in rice

Affiliations

The chromatin remodeling factor OsINO80 promotes H3K27me3 and H3K9me2 deposition and maintains TE silencing in rice

Kangxi Du et al. Nat Commun. .

Abstract

The INO80 chromatin remodeling complex plays a critical role in shaping the dynamic chromatin environment. The diverse functions of the evolutionarily conserved INO80 complex have been widely reported. However, the role of INO80 in modulating the histone variant H2A.Z is controversial. Moreover, whether INO80 helps regulate heterochromatin remains unknown. Here, we characterize the regulatory effects of OsINO80 on protein-coding genes and transposable elements (TEs) in rice. Upon OsINO80 overexpression in rice, we found three types of OsINO80-occupied regions with different chromatin signatures: type I (enriched with H2A.Z), type II (enriched with H3K9me2), and type III (deficient in H2A.Z/H3K9me2). Loss of OsINO80 results in a decrease in H3K27me3, but not H2A.Z, at type I regions as well as a decrease in H3K9me2 at type II regions, which correlates with TE activation and transposition. Our findings reveal that OsINO80 facilitates H3K27me3 establishment, promotes H3K9me2 deposition, and maintains TE silencing.


Conflict of interest statement

Competing interests: The authors declare no competing interests.

Figures

Fig. 1
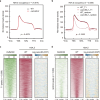
Fig. 1. Three types of OsINO80-occupied regions upon OsINO80 overexpression.
a Heatmaps of the distributions of OsINO80, H2A.Z, H3, H3K4me2, H3K4me3, H3K9me2, H3K27me3, H3K36me3, and H2Aub within OsINO80-enriched peaks and 1-kb flanking regions as determined by the ChIP-seq analysis. T1, T2, and T3 OsINO80-occupied regions had H2A.Z-enriched, H3K9me2-enriched, and H2A.Z/H3K9me2-deficient peaks, respectively. Rows are sorted according to decrease in the OsINO80 signal within peaks. The ChIP-seq data for H2A.Z, H3, H3K4me2, H3K4me3, H3K9me2, H3K27me3, H3K36me3, and H2Aub in wild-type (WT) rice plants were generated in this study. b Mean coverage profiles for the C/G base frequency of the three types of putative OsINO80 targets (T1, red; T2, blue; T3, orange) and the 2-kb flanking regions; the same number of random fragments (gray) with the same widths served as the control. c Average distributions of methylated DNA in the CG, CHG, and CHH contexts in WT rice within the T1 (red), T2 (blue) and T3 peaks (orange) and within control peaks (gray) that were randomly selected from the genome on the basis of number and length. Source data underlying (a) are provided as a Source Data file.
Fig. 2
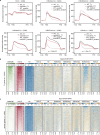
Fig. 2. Loss of OsINO80 does not cause global H2A.Z changes.
a Average density plots of the distribution of the normalized histone variant H2A.Z occupancy on the H2A.Z-enriched genes in the wild-type (WT) and the osino80-2 mutant. The plots present the region from 3 kb upstream of the transcription start site (TSS) to 3 kb downstream of the transcription termination site (TTS). b Average density plots of the distribution of the normalized H2A.Z occupancy within the randomly selected T1 putative OsINO80 target genes (n = 3000) and random control genes (enriched of H2A.Z but not OsINO80, n = 3000). The plots present the region from 3 kb upstream of TSS to 3 kb downstream of TTS. c, d Heatmaps of OsINO80, H2A.Z, and H2A.Z changes in the osino80-2 mutant (compared with the WT control) within randomly selected T1 OsINO80-occupied peaks (n = 5000) (c) and random control peaks (enriched of H2A.Z but not OsINO80, n = 5000) (d), with rows ordered according to decrease in OsINO80 (c) and H2A.Z (d) signals. Statistic significances were determined by two-sided Welch Two Sample t-test.
Fig. 3
Fig. 3. Loss of OsINO80 leads to a decrease in the H3K27me3 level.
a Average density plots of the normalized H3, H3K4me3, H3K36me3, H3K4me2, H3K27me3, and H2Aub profiles of randomly selected putative T1 OsINO80 target genes (n = 3000) and the random control H2A.Z-enriched genes (without OsINO80 enrichment) selected on the basis of number and length in the wild-type (WT) and the osino80-2 mutant. The plots present the region from 1 kb upstream of TSS to 1 kb downstream of TTS. b Heatmaps of OsINO80, H2A.Z, and H3 distributions within randomly selected putative T1 OsINO80 target genes (n = 3000) in WT rice plants and the changes in H2A.Z, H3, H3K4me3, H3K36me3, H3K4me2, H3K27me3, and H2Aub distributions in the osino80-2 mutant (compared to the WT control), with rows ordered according to decrease in OsINO80 signal. c Heatmaps of random H2A.Z-enriched genes (without OsINO80 enrichment) selected on the basis of number and length as the control for (b), with rows ordered according to decrease in H2A.Z signal. b, c Heatmaps of the ChIP-seq signals were generated for the region from 1 kb upstream of TSS to 1 kb downstream of TTS. Statistic significances were determined by two-sided Welch Two Sample t-test.
Fig. 4
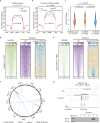
Fig. 4. Loss of OsINO80 results in decreased H3K9me2 levels and the activation of TEs.
a Genome-wide H3K9me2 occupancy profiles in the wild-type (WT) control (dark) and the osino80-2 mutant (red). The plots present the read densities within ±3 kb of the H3K9me2-enriched peaks analyzed by ChIP-seq. b Average density plots of the distribution of normalized H3K9me2 within randomly selected T2 OsINO80-occupied peaks (n = 5000) and random control H3K9me2-enriched peaks (without OsINO80 enrichment) in the WT control and the osino80-2 mutant. The plots were generated from H3K9me2 peaks and the 3-kb flanking regions. c Violin plots showing the changes of H3K9me2 levels in the osino80-2 mutant (compared with the WT control) according to the H3K9me2-enriched peaks with OsINO80 enrichment (+ OsINO80) or without OsINO80 enrichment (− OsINO80). The center line and edges of boxes indicate the median, upper and lower bounds respectively representing the 50th, 75th and 25th percentile. Log2(Fold Change) ranging from −2 to 2 are limited to whiskers. d, e Heatmaps of the OsINO80, H3K9me2, and H3K9me2 changes in the osino80-2 mutant (compared with the WT control) within randomly selected T2 OsINO80-occupied regions and the 1-kb flanking regions (d) and in the randomly selected H3K9me2-enriched peaks (without OsINO80 enrichment, n = 5000) (e), with rows ordered according to decrease in the OsINO80 (d) and H3K9me2 signal (e). f Circos plot of the TE transposition in the osino80-2 mutant (compared with the WT control). The start and end of the arrows represent the original and insertion sites for the transposed TEs, respectively. Different colored lines represent different TE subfamilies. g One TE transposition event was confirmed by PCR amplification. The PCR products were amplified using a transposon-specific primer (forward primer) and a reverse primer flanking the new insertion site. Primers are indicated by black arrows. Statistic significances were determined by two-sided Welch Two Sample t-test. PCR experiments were repeated independently twice. Source data underlying g are provided as a Source Data file.

Similar articles

Cited by

References

    1. Clapier, C. R. & Cairns, B. R. The biology of chromatin remodeling complexes. Annu. Rev. Biochem.78, 273–304 (2009). - PubMed
    1. Yang, T. et al. Chromatin remodeling complexes regulate genome architecture in Arabidopsis. Plant Cell.34, 2638–2651 (2022). - PMC - PubMed
    1. Lin, A., Du, Y. & Xiao, W. Yeast chromatin remodeling complexes and their roles in transcription. Curr. Genet.66, 657–670 (2020). - PubMed
    1. Morrison, A. J. Chromatin-remodeling links metabolic signaling to gene expression. Mol. Metab.38, 100973 (2020). - PMC - PubMed
    1. Morrison, A. J. & Shen, X. Chromatin remodelling beyond transcription: the INO80 and SWR1 complexes. Nat. Rev. Mol. Cell Biol.10, 373–384 (2009). - PMC - PubMed

Publication types