

Serum and plasma as a good candidates of body fluids for detection lung cancer by FTIR liquid biopsy
- PMID: 39738239
- PMCID: PMC11686151
- DOI: 10.1038/s41598-024-81649-8
Serum and plasma as a good candidates of body fluids for detection lung cancer by FTIR liquid biopsy
Abstract
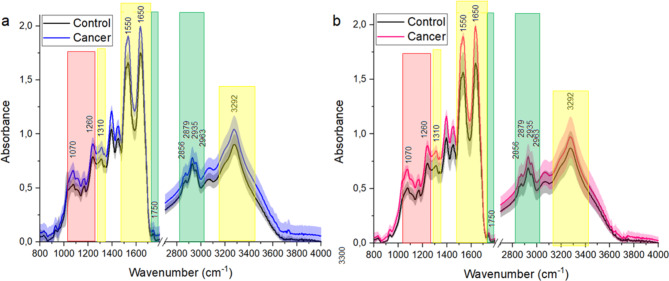
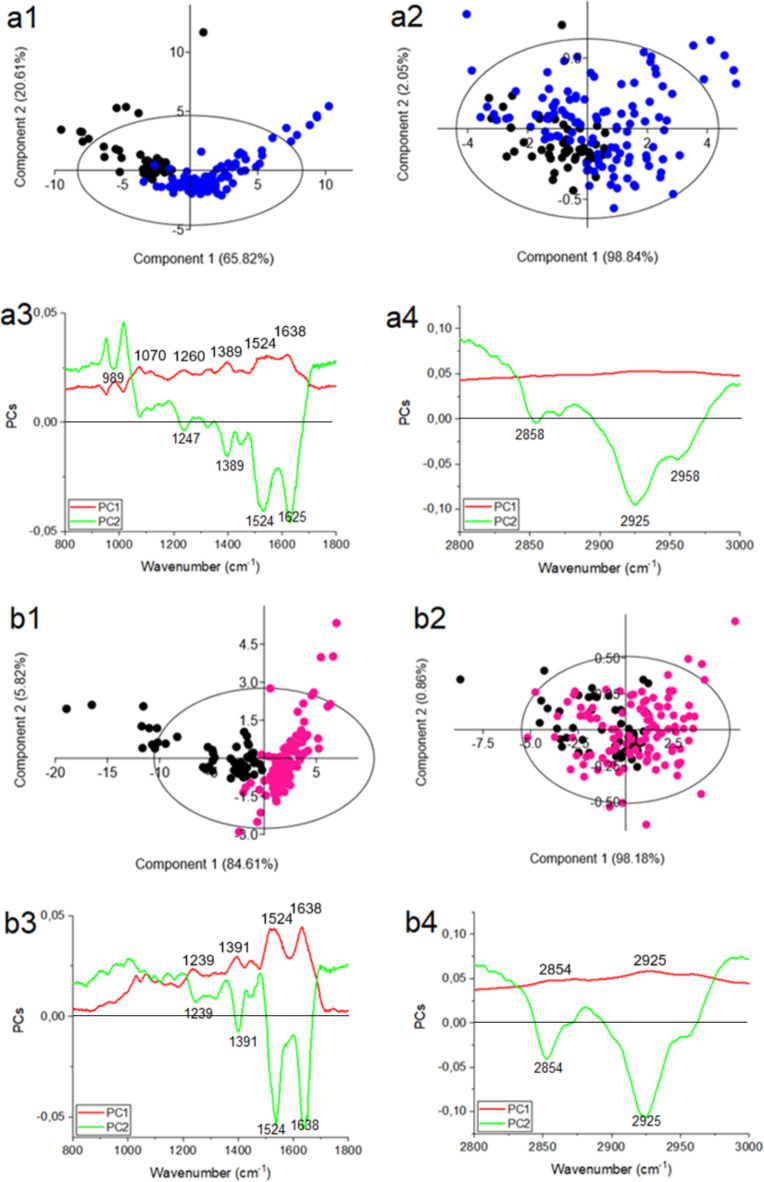
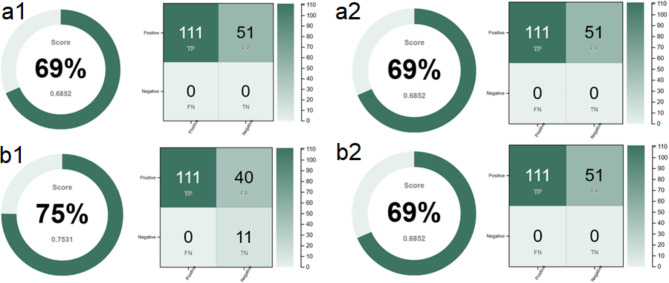
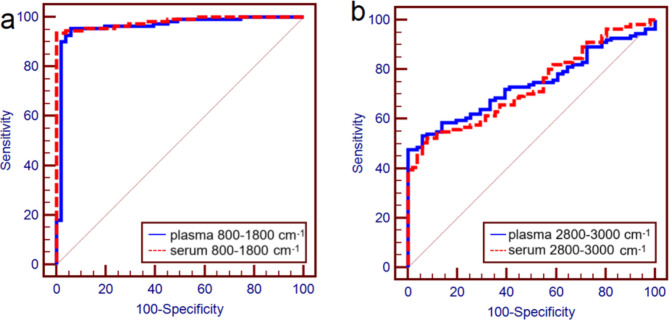
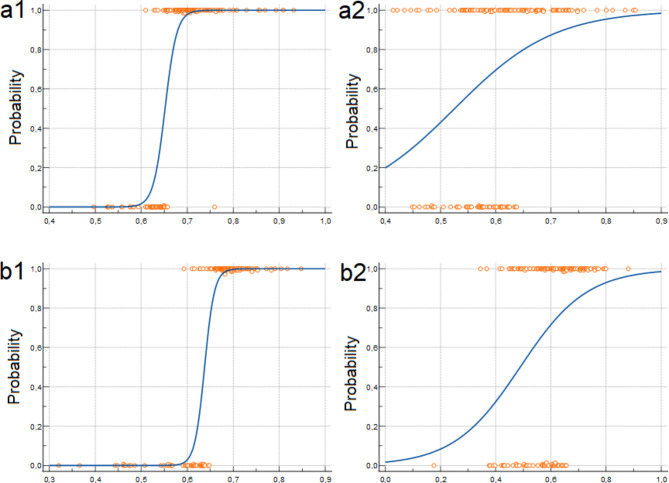
Using Fourier Transform Infrared spectroscopy (FTIR), it is possible to show chemical composition of materials and / or profile chemical changes occurring in tissues, cells, and body fluids during onset and progression of diseases. For diagnostic application, the use of blood would be the most appropriate in biospectroscopy studies since, (i) it is easily accessible and, (ii) enables frequent analyses of biochemical changes occurring in pathological states. At present, different studies have investigated potential of serum, plasma and sputum being alternative biofluids for lung cancer detection using FTIR. However, until now, it has not been shown which biofluid; among serum and plasma, that can serve as the best material medium for detecting lung cancer with highest levels of accuracy. In this study, plasma and serum isolated from blood consenting participants without lung cancer symptoms (controls) and lung cancer patients. The samples were measured using FTIR and subsequently analyzed by machine learning (ML) algorithms in order to show which fluids (serum or plasma) would better enhance detection of lung cancer. Higher absorbances values of PO2-, CH2, CH3 and amides vibrations in FTIR spectra of both serum and plasma samples, collected from lung cancer patients were observed in comparison to individuals without lung cancer symptoms (controls). Principal component analysis (PCA) of FTIR spectra showed plasma and serum samples collected from lung cancer patients and individuals without lung cancer symptoms were better differentiated in fingerprinting region (from 800 to 1800 cm- 1) when compared to lipid region (2800-3000 cm- 1). Moreover, also sensitivity specificity and accuracy calculated by logistic regression (LR) and receive operating characteristic (ROC) showed higher values for fingerprint range (800-1800 cm- 1) in comparison with lipids (2800-3000 cm- 1) one for both, serum and plasma. However, using these methods differences between serum and plasma were not existed. From the all obtained results, it was visible, that both fluids could be used in detected lung cancer using FTIR. Moreover, it was also showed that fingerprint range gave a better distinction between the studied patient groups than the lipid range. This was noticeable for both serum and plasma.
Keywords: FTIR-ATR; Lung cancer; Machine learning; Plasma; Serum.
© 2025. The Author(s).
Conflict of interest statement
Declarations. Competing interests: The authors declare no competing interests.
Figures
References
-
- Durak, T. & Depciuch, J. Effect of plant sample preparation and measuring methods on ATR-FTIR spectra results. Environ. Exp. Bot.169, 103915 (2020). - DOI
-
- Drzymała, E. et al. Structural, chemical and optical properties of SnO2 NPs obtained by three different synthesis routes. J. Phys. Chem. Solids107, 100–107 (2017). - DOI
-
- Yang, C. & Woll, C. IR spectroscopy applied to metal oxide surfaces: adsorbate vibrations and beyond. Adv. Phys. X2, 373–408 (2017).
MeSH terms
Substances
LinkOut - more resources
Full Text Sources
Medical
Miscellaneous
