. 2024 Dec 30;14(1):31629.
doi: 10.1038/s41598-024-79478-w.

Real-time monitoring by interferometric light microscopy of phage suspensions for personalised phage therapy

Collaborators, Affiliations

Real-time monitoring by interferometric light microscopy of phage suspensions for personalised phage therapy

Benjamine Lapras et al. Sci Rep. .

Abstract

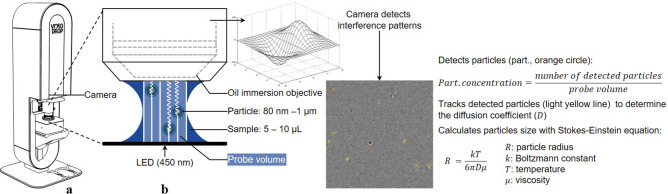
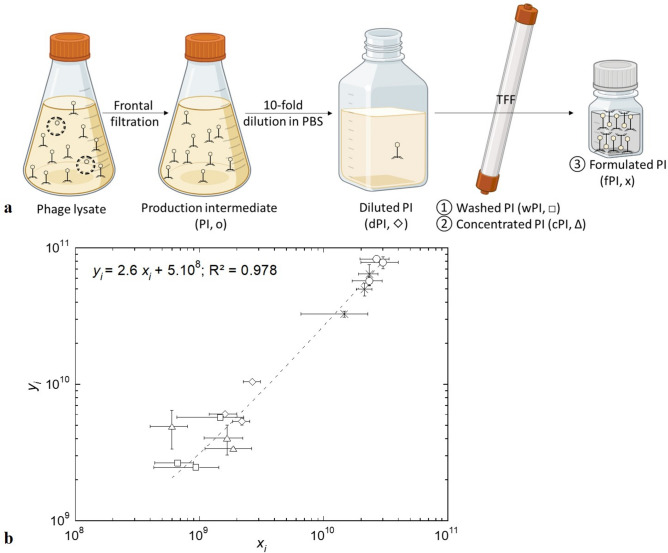
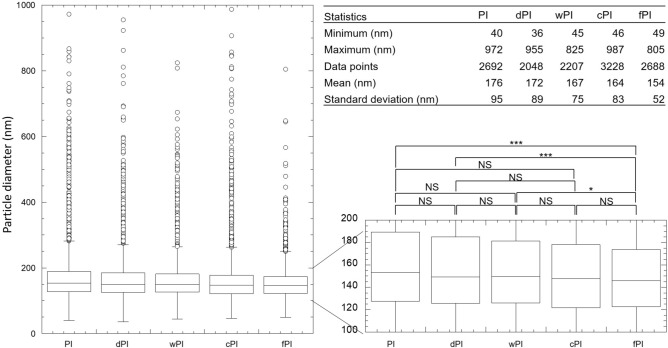
Phage therapy uses viruses (phages) against antibiotic resistance. Tailoring treatments to specific patient strains requires stocks of various highly concentrated purified phages. It, therefore, faces challenges: titration duration and specificity to a phage/bacteria couple; purification affecting stability; and highly concentrated suspensions tending to aggregate. To address these challenges, interferometric light microscopy (ILM), characterising particles (size, concentration, and visual homogeneity) within minutes, was applied herein to anti-Staphylococcus aureus myovirus phage suspensions. Particle concentration was linearly correlated with phage infectious titre (R2 > 0.97, slope: 3 particles/plaque forming units (PFU)) at various degrees of purification, allowing to approximate the infectious titre for suspensions ≥ 3 × 10⁸ PFU/mL, thereby encompassing most therapeutic doses. Purification narrowed and homogenised particle distribution while maintaining therapeutic concentrations. When compared to dynamic light scattering, electrophoretic mobility, and UV/Visible-spectroscopy, ILM best detected aggregates according to our homemade scoring. Although ILM has certain limitations, such as the inability to detect podoviruses (hydrodynamic diameter < 80 nm), or to measure particles in low-concentrated suspensions (< 108 particles/mL), the present proof-of-concept positions this technique as a valuable quality control tool, as a complement to titration rather than a replacement for this technique, for phage suspensions, paving the way for further investigations.

Keywords: Aggregation; Bacteriophages; Fast purification monitoring; Therapeutic phage suspension; Viral stability; Virus quantification.


Conflict of interest statement

Declarations. Competing interests: Myriade, the manufacturer of Videodrop® loaned the equipment for one month. However, Myriade had not provided funding for the study and had no role in the design of the study, in the collection, analyses, or interpretation of data, in the decision and the way to publish the results. Therefore, the authors declare no competing interests..

Figures

Fig. 1
Fig. 1
Principle of interferometric light microscopy (ILM) measurement. (a) and (b) adapted from Myriade communications.
Fig. 2
Fig. 2
Comparison of (xi) phage infectious titre (PFU/mL) and (yi) particle concentration (particles/mL) (N = 10 experimental data; o). (a) Difference plot. Dashed lines represent the acceptable limits, i.e., formula image according to standard NF EN ISO 15,189:2022 methodology. (b) Particle concentration and phage infectious titre ratio. The dotted line represents the linear regression fitted to the experimental data set and the dashed lines represent the limits of the 95% confidence interval. (c) Particle concentration as a function of phage infectious titre. The dotted line represents the linear regression fitted to the experimental data set and the dashed lines represent the limits of the 95% confidence interval. Statistical analyses: Levene’s test (p = 0.10), paired t-test (t0.05,9 = 2.26), hypothesis test for the slope (tβ1 = 17.66), and hypothesis test for the intercept (tβ0 = 0.15).
Fig. 3
Fig. 3
(a) Purification process flowchart (partly created with BioRender.com). The phage lysate undergoes a frontal filtration, forming a production intermediate (PI), which is then tenfold diluted in PBS, forming a diluted PI (dPI), which enters tangential flow filtration (TFF) where the phage suspension is washed (wPI), then 10-time concentrated (cPI) and finally formulated (fPI) in PBS. (b) Particle concentration (yi) as a function of phage infectious titre (xi) during three replicates of purifications: (o) production intermediate, PI; (◇) diluted PI, dPI; (□) washed PI, wPI; (Δ) concentrated PI, cPI; (x) formulated PI, fPI. Each point is the mean value of three experimental measurements ± standard deviation. The dashed line represents the linear regression fitted to the experimental data set (overall N  = 15). Statistical analyses: Levene’s test (p = 0.08), paired t-test (t0.05,14 = 2.15), hypothesis test for the slope (tβ1 = 23.74), and hypothesis test for the intercept (tβ0 = 0.29).
Fig. 4
Fig. 4
Size distribution of all detected particles by ILM for each purification step and all purifications (N = 3). The data set’s characteristics used for the box plot representation is depicted in the table in the top right corner. The line in the box plot represents the median. The homogeneity of variances was demonstrated with Levene’s test (p = 0.27). One way repeated measures ANOVA performed on all groups. All pairs comparison performed with Tukey HSD Post Hoc test: NS: not significant; * p < 0.05; ** p < 0.01; *** p < 0.001.
Fig. 5
Fig. 5
Algorithm for assigning a phage aggregation score (ranging from − 1 to 3) to the values obtained from the comparison with the control. Aggregation index, AI; polydispersity index, PDI; limit of quantification, LOQ; not detected, ND.
Fig. 6
Fig. 6
Screenshots of aggregates (outlined in black) viewed with ILM images for different aggregative conditions. The images are obtained by adjusting the viewing parameters of the software between the interference patterns (background formed by black and white dots) and the optical microscopy image (scale provided at the bottom right of the image and retraced to improve readability). (a) Suspension acidified to pH 3 (mean aggregative score of 2.6/3.0); scale bars, 1 µm. (b) Suspension alkalised to pH 12 (mean aggregative score of 1.1/3.0); scale bars, 5 µm. (c) Suspensions maintained for 4 days at 40 °C (mean aggregative score of 2.1/3.0); scale bars, 1 µm. Some artefacts are visible in the images, particularly in images (a) and (c), i.e., concentric circles.

Similar articles

References

    1. Interagency Coordination Group on Antimicrobial Resistance. No time to wait: securing the futur from drug-resistant infections. at https://www.who.int/antimicrobial-resistance/interagency-coordination-gr... (2019).
    1. Uyttebroek, S. et al. Safety and efficacy of phage therapy in difficult-to-treat infections: A systematic review. The Lancet Infectious Diseases0, (2022). - PubMed
    1. Principi, N., Silvestri, E. & Esposito, S. Advantages and limitations of bacteriophages for the treatment of bacterial infections. Front. Pharm.10, 457104 (2019). - PMC - PubMed
    1. Verbeken, G. & Pirnay, J.-P. European regulatory aspects of phage therapy: Magistral phage preparations. Curr. Opin. Virol.52, 24–29 (2022). - PubMed
    1. Ferry, T. et al. Phage therapy as adjuvant to conservative surgery and antibiotics to salvage patients with relapsing s aureus prosthetic knee infection. Front. Med. (Lausanne)7, 570572 (2020). - PMC - PubMed

LinkOut - more resources